

Every ranking board I have priced on this desk, from the Formula 1 drivers' title to the Ballon d'Or, rests on a state variable you can only estimate, and the Largest Company 2026 market on Polymarket is the rare one where you can measure it to the dollar. Multiply Friday's closing prices by the share counts on the cover pages of each company's latest SEC filing and you get the answer to the question the contract asks, as of 25 September: Nvidia is worth about $5.42 trillion, Apple about $4.98 trillion, and the gap between them is 9.0%. The board prices Nvidia to still be on top at the 31 December close at 74.5%. That is a number you can test, because the only thing between today and resolution is 67 trading sessions of two stock prices moving against each other, and we have a year of evidence on how violently they do that.
Here is what the headline odds leave out. On 29 July 2026, on the same filing-based arithmetic, Apple was the larger company by almost 8%, and the Nvidia leg still traded at 48.5%. Since then the ratio has climbed 17% and the price has jumped 26 points. Run the gap through the realised volatility of the Nvidia-to-Apple ratio (43% a year, because the two stocks barely move together) and a 9% cushion is worth about 60.5%, not 74.5%. To justify the market price, Nvidia has to be expected to beat Apple by roughly six percentage points in three months. Over the past year it did the reverse.
- Nvidia YES trades at 74.5% (bid 74, ask 75) on $1.29m of volume; Apple at 17.45% on $0.95m. Polymarket gamma API, 28 September 2026, 06:56 UTC
- Nvidia market cap $5.42 trillion: $225.07 close times 24.1 billion shares. Stockanalysis close 25 September 2026; Nvidia 10-Q cover, shares as of 21 August 2026
- Apple market cap $4.98 trillion: $341.07 close times 14,594,180,000 shares. Apple 10-Q cover, shares as of 17 July 2026
- Gap between the two: 9.0%, down from 14.2% a year earlier on the same share counts. TTS calculation from daily closes, 25 September 2025 to 25 September 2026
- Daily volatility of the log Nvidia/Apple ratio: 2.71%, or 43% annualised, with a daily return correlation of just 0.09. TTS calculation, 251 sessions to 25 September 2026
- Our fair value for the Nvidia leg: 60.5%, against 74.5% on the board. TTS joint bootstrap, 200,000 paths, 67 sessions to 31 December 2026
Measuring the gap from the filings, not from a ranking site
Market-cap league tables on the web disagree by a percent or two, so we built the numbers from the primary documents. Nvidia's 10-Q for the quarter ended 26 July 2026 reports 24.1 billion shares outstanding as of 21 August, a figure the company rounds to one decimal place, so our Nvidia number carries an error band of roughly 0.2% either way. Apple's 10-Q for the June quarter is exact to the share: 14,594,180,000 as of 17 July.
Alphabet takes more care. Its June-quarter 10-Q lists 5,868 million Class A shares, 835 million unlisted Class B shares and 5,527 million Class C shares as of 15 July. Pricing Class B at the Class A close, as most ranking sites do, gives $4.19 trillion. Microsoft's annual report shows 7,425,545,491 shares as of 23 July, which at Friday's $516.17 comes to $3.83 trillion.
| Company | 25 Sep close | Shares (filing date) | Market cap | Rise needed to pass Nvidia |
|---|---|---|---|---|
| Nvidia | $225.07 | 24.1bn (21 Aug) | $5.42tn | n/a |
| Apple | $341.07 | 14.59bn (17 Jul) | $4.98tn | 9.0% |
| Alphabet | $343.92 A / $341.08 C | 12.23bn A+B+C (15 Jul) | $4.19tn | 29.4% |
| Microsoft | $516.17 | 7.43bn (23 Jul) | $3.83tn | 41.5% |
| Amazon | $249.67 | 10.79bn (22 Jul) | $2.69tn | 101% |
| SpaceX | $148.68 | 13.18bn A+B (28 Jul) | $1.96tn | 177% |
| Tesla | $372.11 | 3.95bn (16 Jul) | $1.47tn | 269% |
Saudi Aramco closed at SAR 25.78 on 24 September on the Tadawul. With 241.91 billion shares, the count Stockanalysis carries, and the riyal's 3.75 peg, that is about $1.66 trillion. We could not reach Aramco's own share register from this desk, so treat that line as secondary-sourced. It changes nothing: Aramco would need to more than triple.
So the race has two runners. Alphabet needs a 29% relative move in three months and Microsoft 41%, both tail events. Everything interesting sits in one number, the ratio of Nvidia's value to Apple's, now 1.090. Single-stock views live on our stocks desk, including its Apple forecast and Alphabet forecast.
What 43% ratio volatility does to a 9% cushion
The mechanism is simple enough to do on the back of a filing. Take the log of the market-cap ratio: ln(5.424 / 4.978) = 0.0859. Over the past 251 sessions the daily change in that log ratio had a standard deviation of 2.712%. Nvidia's own annualised volatility was 37.7% and Apple's 24.6%, and because the daily correlation between them was only 0.09, the spread between them is more volatile than either stock alone.
From Monday 28 September to Thursday 31 December there are 67 US trading sessions, after removing Thanksgiving on 26 November and Christmas Day. Scale the daily figure by the square root of 67 and the ratio's standard deviation to resolution is 22.2%. A margin of 8.59 log points against 22.2 points of noise is a z-score of 0.387. With no drift assumed, the normal distribution gives Nvidia a 65.1% chance of still being ahead of Apple on 31 December.
That two-horse figure overstates Nvidia, because it ignores the chance that Alphabet or Microsoft passes both. To handle all four at once we resampled whole trading days, keeping each day's four returns together so the real correlations survive, demeaned the returns so no stock gets credit for last year's trend, and drew 200,000 paths of 67 days. The 12-month sample gives Nvidia 61.3%, Apple 31.9%, Alphabet 5.0% and Microsoft 1.8%. The last six months alone, a more volatile stretch, gives Nvidia 58.2%. Five-day block resampling, which keeps short momentum runs intact, lands between 59% and 61%. We use 60.5% for Nvidia and 32% for Apple.
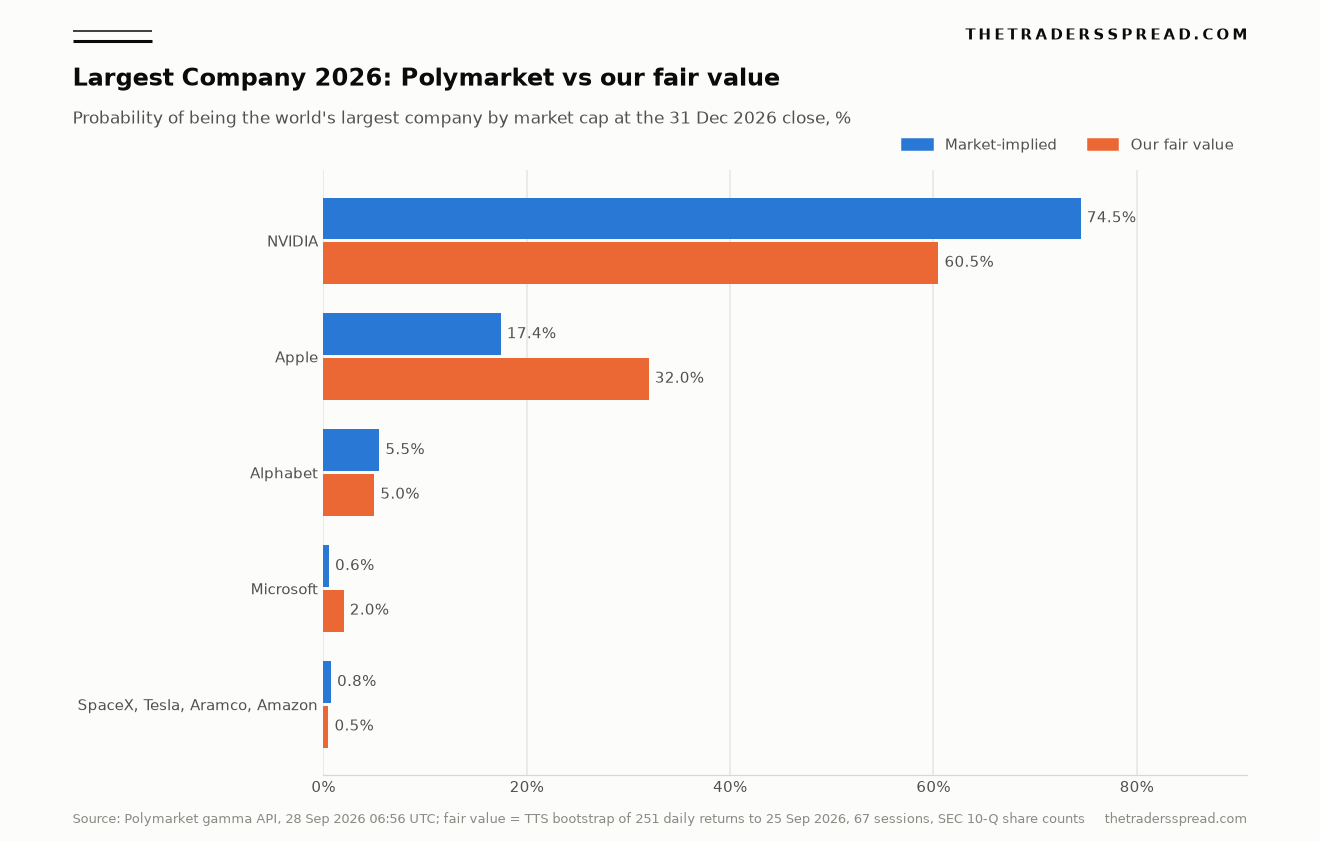
| Leg | Polymarket YES | Volume | Our fair value | Market minus fair |
|---|---|---|---|---|
| NVIDIA | 74.5% | $1.29m | 60.5% | +14.0 pts |
| Apple | 17.45% | $0.95m | 32.0% | -14.55 pts |
| Alphabet | 5.5% | $0.74m | 5.0% | +0.5 pts |
| Microsoft | 0.55% | $0.98m | 2.0% | -1.45 pts |
| SpaceX, Tesla, Aramco, Amazon | 0.75% combined | $3.58m combined | 0.5% | +0.25 pts |
You can run the same arithmetic backwards to see what the crowd is assuming. A 74.5% probability corresponds to a z-score of 0.659, which on 22.2 points of noise requires an expected log gap of 14.6 points at year end. The gap today is 8.6. The difference, about six points of Nvidia outperformance in 67 sessions, is roughly 23 points a year. In the 12 months to Friday, Nvidia's share price rose 26.7% and Apple's rose 32.8%.
The eight open legs with money on them sum to 98.75% at the midpoint, a 1.25% underround. That does not mean there is free money in owning the whole board: at the best asks the same eight legs add up to 100.1%. The twenty "Company B" to "Other" placeholders carry zero volume and zero liquidity, and none of them is a price. The live board is on Polymarket's Largest Company end of December 2026 page. Links to Polymarket are affiliate links, from which The Traders Spread may earn a commission at no cost to you.
The July flip the price has already forgotten
Using each day's closing prices and the current share counts, Apple was larger than Nvidia at four consecutive closes, 27 to 30 July 2026. The low came on 29 July, when Nvidia closed at $190.01 and Apple at $338.19, a ratio of 0.928. Redo the sum with the share counts each company reported in the spring and the ratio is 0.926; the flip does not depend on which filing you pick.
Polymarket's own daily history for the Nvidia token, pulled from its CLOB price series, shows the leg at 57.5% on 27 July, 51% on 28 July and 48.5% on 29 and 30 July. Apple, then the bigger company with five months to run, traded between 35.3% and 35.9%. The crowd never made the front-runner the favourite. Then Apple reported, the stock fell 7.4% on 31 July, and the ratio snapped back to 1.07 in a day.
Apple's results were not the problem. "Today, Apple is proud to report our strongest June quarter ever, with double-digit revenue growth across iPhone, Mac and Services, and in every geographic segment," Tim Cook, Chief Executive Officer at Apple, said in the company's third-quarter release on 30 July. Revenue rose 16% to $109.4 billion. The same release disclosed that about two percentage points of the 50.1% gross margin came from tariff refunds, and the market sold what it read as a one-off.
Nvidia's catalyst came four weeks later. "The AI infrastructure buildout is at full steam," Jensen Huang, founder and Chief Executive Officer at Nvidia, said in the second-quarter fiscal 2027 release on 26 August, which reported revenue of $96.2 billion, up 106% from a year earlier, and guided the next quarter to $108.0 billion, plus or minus 2%. Nvidia closed 8.7% higher on 27 August, and the Nvidia leg printed its high of 80.5% on 28 August. Our stocks desk covered that guidance reaction at the time.
The ratio then was 1.197. It is 1.090 now. Nvidia has given back more than half of its post-earnings margin in a month, yet the leg has only slipped from 80.5% to 74.5%. The price follows Nvidia headlines; the contract pays on a ratio that has swung between 0.93 and 1.34 in 12 months.
Anyone checking our history can compare the board against the live Nvidia and Apple legs on Polymarket, where the chart tab shows the same July dip we pulled from the API.
Rules that say less than they seem to
The contract resolves "to the largest company in the world by market cap on December 31, 2026, as of market close," and its resolution source is "a consensus of credible reporting." No index provider is named. No share-count date is named. Nothing says how to treat share classes that do not trade.
That matters in three places. Nvidia's own filing rounds to 24.1 billion shares, so if the two companies finish within about 0.3% of each other, different outlets could report different winners and the board would be settled by whichever tables the resolvers weigh. Alphabet's 835 million Class B shares add about $287 billion at Friday's prices, and a site that leaves them out shows Alphabet at $3.90 trillion. SpaceX is the sharpest case. Its first 10-Q as a listed company reports 7,696,293,669 Class A and 5,485,486,276 Class B shares as of 28 July; counting both gives $1.96 trillion, counting only the listed Class A gives $1.14 trillion. The stock has been volatile since its June listing, as our coverage of its lock-up releases showed, but even the generous count leaves it 177% short.
SpaceX is listed on Nasdaq under SPCX and files with the SEC, so the edge case is share classes, not private status. None of this decides the board unless the finish is within about a percent.
What the model does not know
Three things sit outside a volatility model, and it is fair to ask whether they justify the market's premium on Nvidia.
The first is earnings. On their usual calendars all four front-runners report once more before 31 December, Nvidia against its $108.0 billion guide. Our sample year holds four reporting cycles per company, so the model already expects one earnings-sized jump per name; it cannot know the direction. The two largest daily ratio moves in our sample came on 31 July and 27 August, the sessions straight after Apple's and Nvidia's reports.
The second is buybacks. Nvidia said it returned about $26.0 billion to shareholders in its second quarter and had about $99.0 billion left under its repurchase authorisation. Apple's share count fell 1.2% between October 2025 and July 2026, Nvidia's by about 0.8% on its rounded figures. Buybacks move market cap far less than per-share numbers, and over three months the relative effect is well under a point.
The third is commitments that could change how Nvidia's risk is priced. An 8-K filed on 17 August describes residual value guaranties on about 4.25 gigawatts of data-centre leases in Ohio, with Nvidia's payment obligation capped at $105 billion for the initial commitment. A second 8-K on 2 September agreed an acquisition of Hugging Face for about $11.9 billion, expected to close in the first half of 2027. Neither is a share issue, and neither changes the count before December.
What would move us towards the market? Evidence that the Nvidia-Apple ratio has become less volatile, or a positive drift for Nvidia we could defend with something better than momentum. The last three months of data point the other way: the ratio's volatility rose to 52.7% annualised, and the ratio itself has fallen from 1.197 to 1.090 since 27 August.
Our call: the Nvidia leg is priced about 14 points rich
We analyse the NVIDIA leg. Our fair value is 60.5% against a market price of 74.5%, so the market sits above our number, and our call on that leg is NO at the current price. The mirror image is Apple at 17.45% against our 32%.
Related2026 Balance of Power: Democrats Sweep at 62.5 Cents
Base case, 55% weight: the ratio random-walks with the volatility it has shown all year and ends between 0.95 and 1.25. Nvidia stays on top in most of those paths, which is why our fair value is still well above 50%. The board converges towards our number only slowly, because the crowd reprices on Nvidia news rather than on the ratio.
Bull case for the Nvidia leg, 25% weight: the late-November report beats the $108.0 billion guide, the ratio returns to the 1.20 to 1.30 range seen in April and late August, and the leg trades above 85% into December. A result like that would validate the market's premium after the fact, though not on the evidence available today.
Bear case, 20% weight: Apple's holiday-quarter demand or an AI-spending scare narrows the gap, and a repeat of July's four-session flip lands in the last week of December rather than midsummer. In that world the Nvidia leg collapses towards zero on a single print.
What would change my mind: a sustained drop in the realised volatility of the ratio below 30% a year, which would lift our fair value into the high 60s; or a structural event that changes one side's share count, such as a large stock-funded deal. What resolves it is simple. At the 31 December close, divide Nvidia's market cap by Apple's, check that Alphabet has not passed both, and see which side of 1.0 the ratio sits on. Given how the rules are worded, a finish within about 0.3% could be decided by whichever share counts the reporting consensus uses.
Prices on the Largest Company 2026 board move every session US equities trade, so recheck the gap before reading anything into the odds.
Frequently asked questions
How does the Largest Company 2026 market resolve?
It pays YES on the company that is the largest in the world by market capitalisation at the market close on 31 December 2026. The rules name "a consensus of credible reporting" as the source, with no specific data vendor. That leaves share-class treatment and share-count dates to the reporting outlets, which only matters if the top two finish within about a percent of each other.
Why is our fair value for Nvidia lower than the market's?
Because a 9.0% margin is small relative to how much the Nvidia-Apple ratio moves. It has had 43% annualised volatility over the past year, which puts 22.2% of noise on the ratio over the 67 sessions to resolution. Resampling a year of daily returns for all four contenders gives Nvidia about 61%, not 74.5%. The market price implies Nvidia outperforms Apple by about six points by year end.
Has Apple actually been bigger than Nvidia recently?
Yes. On closing prices and filing share counts, Apple was the larger company at four closes from 27 to 30 July 2026, with the ratio bottoming at 0.928 on 29 July. Apple then fell 7.4% after its quarterly report on 31 July, and Nvidia rose 8.7% after its own report on 27 August, which pushed the ratio to 1.197.
Do SpaceX, Tesla, Saudi Aramco or Amazon have a realistic chance?
Not on current numbers. Amazon needs to roughly double relative to Nvidia, SpaceX needs a 177% relative rise even when both share classes are counted, and Tesla and Aramco need more than a tripling. Polymarket prices the four together at 0.75%. Our model gives them about 0.5% combined.
Can I buy every leg and lock in a profit from the underround?
No. The open legs sum to 98.75% at the midpoint, but at the best asks the same eight legs add up to 100.1%, so there is no risk-free spread after crossing the book. The twenty placeholder legs show 0% prices with no volume or liquidity, and they are not tradable odds.
What is the main risk to this analysis?
Direction on earnings day. Each of the leading companies reports once more before 31 December, and in the last year the biggest ratio moves came on or around results. A strong beat from Nvidia in November would push the ratio back towards the 1.20 to 1.30 range and make the market's price look right in hindsight.
This article is analysis and information, not financial or investment advice. Prediction-market contracts and equities can lose value quickly and you can lose all of the capital you commit. Probabilities and fair values are estimates based on historical volatility and will change as prices move. Market caps are calculated by The Traders Spread from closing prices on 25 September 2026 and share counts on SEC filings; Saudi Aramco figures are secondary-sourced.