

$7,645 million. That is the components line inside Apple's inventory on 27 June 2026, up from $2,124 million when the fiscal year opened nine months earlier, according to Note 5 of the Q3 FY2026 Form 10-Q filed with the SEC on 31 July 2026. Apple's raw-component stockpile grew 3.6 times in three quarters. For a company that spent two decades treating inventory as a defect to be engineered away, that is not a rounding error. It is a decision. And it sits directly beneath the number everyone actually looked at that week: a 50.1% company gross margin, the headline of Apple's strongest June quarter on record.
The two numbers are connected, and the connection runs the wrong way for the margin. Apple has bought a very large quantity of components at what is almost certainly the highest memory pricing in the industry's history, and parked the cost on the balance sheet. Inventory is not an expense. It becomes one only when the product ships. So the 40.1% Products gross margin the market saw on 30 July was earned largely on components purchased before the spike, while the components purchased during the spike are still sitting in a warehouse, waiting to become cost of sales. Apple's own 10-Q flags it in a single clause: Products margin rose "partially offset by higher costs, including memory." That clause is the whole bear case, and it has barely started.
Key facts
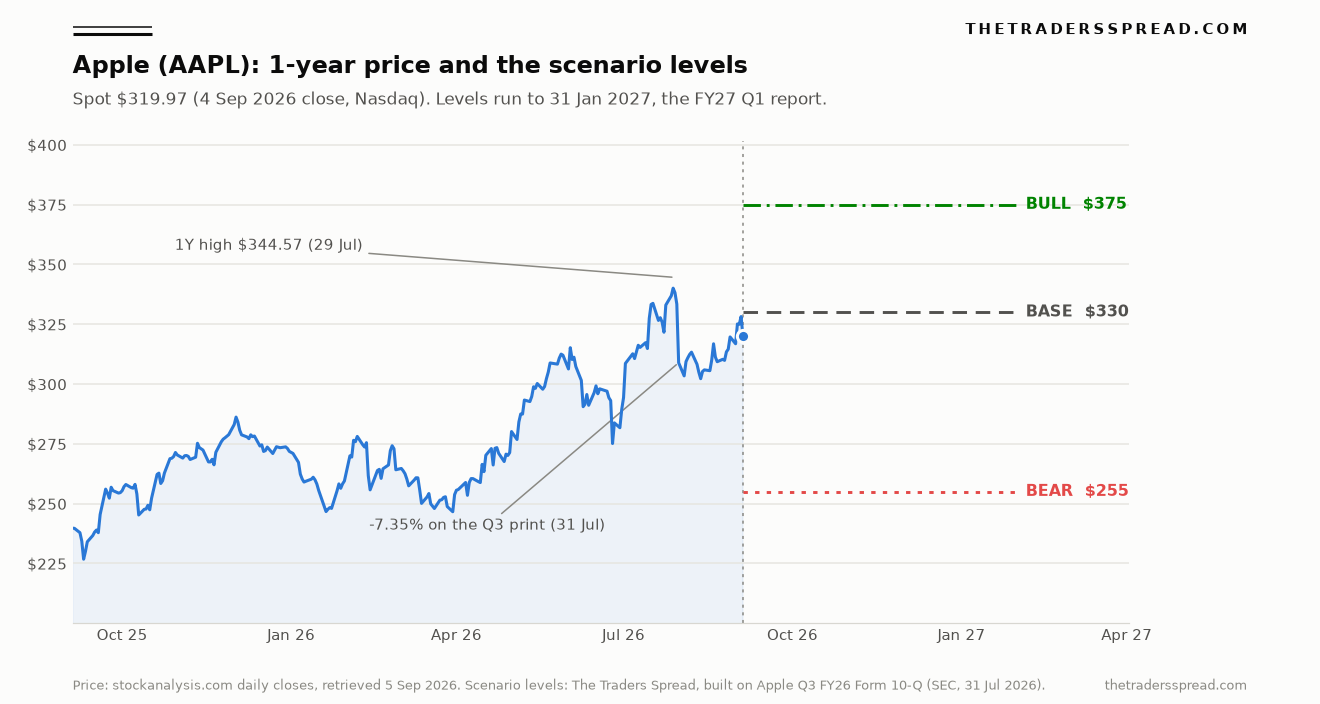
- AAPL closed at $319.97 on 4 September 2026 (Nasdaq, 4:00pm ET), 7.1% below its 1-year high of $344.57 set on 29 July 2026 — stockanalysis.com, retrieved 5 September 2026
- Q3 FY26 revenue $109.4bn, up 16%; diluted EPS $2.02, up 29%, of which $0.11 came from tariff refunds — Apple Form 8-K Exhibit 99.1, 30 July 2026
- Company gross margin 50.1%, including approximately 2 percentage points from tariff refunds; Products margin 40.1% vs 34.5% a year earlier — Apple Q3 FY26 earnings release, 30 July 2026
- Services gross margin percentage was flat at 75.6% year over year; Services revenue grew 12%, slower than iPhone's 22% — Apple Q3 FY26 Form 10-Q, 31 July 2026
- Micron's DRAM average selling prices rose in the "low-260% range" year over year in its quarter ended 28 May 2026; NAND ASPs rose "mid-310%" — Micron Form 10-Q, 25 June 2026
- Micron's Mobile and Client business unit gross margin went from 24% to 87% in twelve months on revenue of $11.5bn — Micron Q3 FY26 earnings release, 24 June 2026
- Apple repurchased $25.8bn of stock in the June quarter and $62.1bn across nine months; share count fell 1.1% to 14.61 billion — Apple Q3 FY26 Form 10-Q, 31 July 2026
What $7.6 billion of components actually buys
Memory is the input Apple cannot design around. Every iPhone, iPad and Mac carries DRAM and NAND sourced from a supplier base of three, and in the twelve months to mid-2026 that supplier base repriced its product more violently than at any point in the industry's recorded history.
The scale is easiest to see in Micron's own filings rather than in commentary about them. In the quarter ended 28 May 2026, Micron reported DRAM average selling prices up in the "low-260% range" against the same quarter a year earlier, and NAND ASPs up "mid-310%", per its Form 10-Q filed 25 June 2026. Bit shipments barely moved. The revenue came almost entirely from price.
The line item that matters to Apple shareholders is narrower still. Micron's Mobile and Client business unit, the one that supplies handset and PC makers, posted revenue of $11,521 million at an 87% gross margin in that quarter, against $3,255 million at a 24% gross margin a year earlier. A 63-point gross margin expansion at a component supplier is money transferred out of its customers' income statements. Apple is the largest of those customers.
Then there is the part that makes this durable rather than cyclical. Micron disclosed in the same filing that it has entered into multi-year "Strategic Customer Agreements" structured as take-or-pay contracts with binding volume commitments, and that "the largest agreements generally have a ceiling price for existing products that approximates the market price in the second calendar quarter of 2026, and a floor price through the term of the agreement." Read that carefully. The ceiling is set at peak-cycle pricing. The floor runs for the life of the contract. Micron expects gross margins from those agreements, even at floor pricing, to "yield gross margins well above our peak quarterly margins in any past cycle."
Apple does not name its memory suppliers or its contract terms. What it does disclose is a manufacturing purchase obligation of $57.0 billion as of 27 June 2026, with $56.2 billion payable inside twelve months, plus $29.3 billion of other purchase obligations covering supplier arrangements and licensed intellectual property. Those are not new disclosures in kind. The question is what price sits inside them now.
The $7.6 billion components pile is the visible edge of the answer. Apple pre-bought. Pre-buying is the correct operational response to a supply squeeze and it protects the September product cycle. It does not make the memory cheaper. It moves the moment of recognition.
The two percentage points Apple told you about
Give Apple credit for candour here, because the disclosure was voluntary and specific. The earnings release of 30 July 2026 states that the 50.1% company gross margin included "a favorable impact of approximately 2 percentage points from tariff refunds", and that the $2.02 diluted EPS included "a favorable impact of $0.11 from tariff refunds."
Strip it out and the quarter reads differently. Gross margin ex-refund lands near 48.1%. EPS ex-refund lands at $1.91, which is growth of roughly 22% rather than the reported 29%. Both are still excellent. Neither is the 50.1% print that framed the coverage.
Tariff refunds are, by construction, non-recurring. They arise from duties paid and subsequently returned. Nothing in the 10-Q suggests a mechanism by which they repeat at that magnitude, and Apple's risk disclosure on trade measures is written in the language of continuing uncertainty rather than continuing benefit: the ultimate impact "remains uncertain and will depend on several factors, including whether additional or incremental U.S. tariffs or other measures are announced or imposed."
So the Products gross margin of 40.1% carries a temporary tailwind on top and a deferred cost underneath. Neither observation requires a view on Apple's products. Both come out of the filing.
The market appears to have worked at least part of this out in real time. AAPL fell 7.35% on 31 July 2026, the session after the release, closing at $308.91 having set a 1-year high of $344.57 two days earlier. Five weeks on, at $319.97, it has not recovered the level. A stock that drops 7% on a record quarter is telling you the record was not the point.
Services stopped being the margin story
The standard Apple bull argument for the last five years has been mix: hardware is the installed base, Services is the profit engine, and every incremental Services dollar arrives at a 70-plus per cent gross margin that drags the company average upward. It is a good argument. In this quarter it stopped working.
Services gross margin percentage was 75.6% in Q3 FY26 and 75.6% in Q3 FY25. Apple states it plainly: "Services gross margin percentage was flat during the third quarter of 2026 compared to the third quarter of 2025." Services revenue grew 12% to $30.7bn, the second-slowest of the five reported categories, ahead of only iPad, which shrank 6%. iPhone grew 22%. Mac grew 29%.
Every basis point of the company's 360-point gross margin expansion therefore came from Products, and Products is the segment carrying the memory bill and the refund. The mix argument has inverted. Hardware is now flattering Services, not the reverse.
There is a regulatory overhang on the Services line as well, and it is not priced as a tail risk anywhere obvious. Apple's 10-Q discloses a €500 million fine imposed by the European Commission on 23 April 2025 under Article 5(4) of the Digital Markets Act, under appeal, plus preliminary findings in a separate Article 6(4) investigation where a final adverse determination "may impose fines up to 10% of the Company's annual worldwide net sales." Separately, Apple's search licensing revenue from Google sits inside a remedies process the DC District Court ordered on 2 September 2025 and which both the DOJ and Google have appealed. That revenue is close to pure margin.
Where the cash actually went
None of the above is a solvency question. Apple generated $117.0 billion of operating cash flow in nine months, up 43% year over year, and finished the June quarter with $146.5 billion of cash and marketable securities against $84.3 billion of debt and commercial paper. Net cash is roughly $62 billion.
The capital return machine ran at full speed. Apple repurchased $25.8 billion of stock in the June quarter alone and $62.1 billion across the nine months, taking shares issued and outstanding from 14.77 billion to 14.61 billion, and to 14.59 billion by 17 July 2026. Retained earnings crossed back into positive territory at $11.3 billion, from an accumulated deficit of $14.3 billion at the fiscal year open, an artefact of how aggressively the buyback has been run against book equity. The quarterly dividend is $0.27, paid 13 August 2026.
Two spending lines deserve more attention than they get. Research and development rose 32% to $11.7 billion in the quarter and now runs at 11% of sales against 9% a year ago, with Apple attributing the rise to "higher infrastructure-related costs, including investments in artificial intelligence." Capital expenditure went the other way: $6.8 billion across nine months, down from $9.5 billion. Apple is expensing its AI build rather than capitalising it, which is the opposite of the hyperscaler treatment and means its AI spend hits reported earnings immediately instead of amortising over years. Anyone comparing Apple's margins to a company that capitalises data-centre capacity is comparing two different accounting choices. The same tension runs through the chip suppliers we looked at in Nvidia's Q3 guidance and, from the cost side, in AMD's stalled margin guidance.
One more balance-sheet item has no public explanation. Gross intangible assets rose from $24,950 million to $38,220 million in nine months, with net intangibles going from $13.3 billion to $25.4 billion. Accumulated amortisation moved only $1.2 billion over the same period. Apple added roughly $13 billion of intangible assets and has amortised almost none of it yet. The 10-Q does not attribute the increase, and no acquisition of that size was announced. Whatever it is, the amortisation charge attached to it is a future cost that has not yet reached the income statement.
The market data
AAPL closed at $319.97 on 4 September 2026, with an after-hours print of $320.01. The stock is up 33.4% over twelve months and 18.1% year to date, against a 52-week range of $225.95 to $344.57. The 50-day moving average sits at $315.15 and the 200-day at $283.87. Realised annualised volatility over the past year is 25.1%.
On earnings, the arithmetic runs as follows. Apple reported FY2025 diluted EPS of $7.46 and nine-month FY2025 EPS of $5.62, which puts the September 2025 quarter at $1.84. Adding the $6.88 reported for the first nine months of FY2026 gives a trailing twelve-month figure of $8.72. At $319.97 that is a trailing multiple of 36.7 times.
| Metric | Value | Source |
|---|---|---|
| Spot (4 Sep 2026 close) | $319.97 | stockanalysis.com |
| 52-week range | $225.95 – $344.57 | stockanalysis.com |
| 200-day moving average | $283.87 | Calculated, 1Y daily closes |
| TTM diluted EPS | $8.72 | Derived, SEC filings |
| Trailing P/E | 36.7x | Calculated |
| Q3 FY26 gross margin | 50.1% (48.1% ex-refund) | Apple 8-K, 30 Jul 2026 |
| Components inventory | $7,645m (from $2,124m) | Apple 10-Q, 31 Jul 2026 |
| Net cash | ~$62bn | Apple 10-Q, 31 Jul 2026 |
The call
Our horizon runs to the FY2027 first-quarter report in late January 2027, which is the first print that will contain a full holiday quarter of memory bought at 2026 prices.
RelatedSalesforce (CRM) Rises 2.09% After BofA's Double Upgrade
Base case: $330, probability 45%. Apple grows revenue in the low double digits, Products gross margin gives back one to two points as the pre-bought components clear and the refund does not repeat, and Services margin stays flat. On our arithmetic that is FY2026 EPS near $9.13, extending the nine-month growth rate through the September quarter. At $330 the stock is carrying roughly 36.1 times that number, which is close to where it trades today. The stock marks time while earnings catch up to the multiple.
Bull case: $375, probability 30%. This needs no re-rating at all, which is what makes it credible. Hold the current 36.7 times multiple and grow earnings about 12% into FY2027, to roughly $10.20, and the price is $375. Getting there requires the memory pass-through to be absorbed by pricing rather than margin, Greater China to keep the momentum it showed in the June quarter (up 22% in the quarter, up 30% across nine months), and the Siri AI cycle Tim Cook introduced at WWDC26 to lift replacement rates rather than merely refresh the software. The buyback does part of the work by itself: at the current pace the share count falls another 1.5% or so over the horizon.
Bear case: $255, probability 25%. Two things have to happen together, and they are correlated. Products gross margin retreats toward the mid-30s as the $7.6 billion component pile flows into cost of sales and the intangible amortisation starts, holding FY2027 EPS near $9.10. At the same time the multiple compresses roughly 25% to 27.7 times, which is what tends to happen when a stock rated as a compounder posts a quarter of flat-to-down margins. That combination puts the price at $255, still well above the 52-week low of $225.95.
What would change our mind. On the bearish side of the ledger, a fiscal Q4 report in late October that shows components inventory falling back toward $4 billion without a gross margin hit would mean Apple has passed the memory cost through to customers more effectively than we assume, and the mechanism dies. On the bullish side, a Services gross margin percentage that declines year over year in the December quarter, or an adverse final determination in the European Commission's Article 6(4) investigation, would remove the offset the base case relies on. The technical marker we watch is the 200-day moving average at $283.87. The base case does not survive weekly closes beneath it.
For readers tracking the same scenario framework across the desk, our Amazon bull and bear case and our Okta forecast use the same construction, and definitions for the terms used here are in the trading glossary.
FAQ
Why did Apple stock fall after a record quarter?
AAPL dropped 7.35% on 31 July 2026, the session after Apple reported June-quarter revenue of $109.4 billion and a 50.1% gross margin. Apple itself disclosed that roughly 2 percentage points of that margin and $0.11 of the $2.02 diluted EPS came from non-recurring tariff refunds. Strip those out and the quarter was strong but not a record margin, which is a reasonable explanation for the reaction.
How much is memory pricing costing Apple?
Apple does not break out component costs. The indirect evidence is stark: Micron's Mobile and Client business unit, which supplies handset makers, expanded gross margin from 24% to 87% in the twelve months to 28 May 2026, on DRAM average selling prices up in the low-260% range. Apple's 10-Q attributes part of its cost increase to "higher costs, including memory."
What does the components inventory build tell us?
Apple's components inventory rose from $2,124 million on 27 September 2025 to $7,645 million on 27 June 2026. Inventory is capitalised until the product sells, so components bought at peak memory pricing have not yet passed through cost of sales. The margin effect is deferred rather than avoided, which is why the December and March quarters matter more than the June one did.
Is Apple's Services business still expanding its margin?
Not in the most recent quarter. Services gross margin percentage was 75.6% in Q3 FY2026 and 75.6% in Q3 FY2025, flat year over year on Apple's own disclosure. Services revenue grew 12%, slower than iPhone at 22% and Mac at 29%. The entire company gross margin expansion in the quarter came from the Products segment.
What are the levels in this Apple forecast?
Spot is $319.97 as of the 4 September 2026 Nasdaq close. The base case is $330 at 45% probability, the bull case $375 at 30%, and the bear case $255 at 25%, on a horizon running to the FY2027 first-quarter report in late January 2027. The 200-day moving average at $283.87 is the level that separates the base path from the bear path.
How large is Apple's buyback and does it move the stock?
Apple repurchased $25.8 billion of stock in the June 2026 quarter and $62.1 billion across the first nine months of FY2026. Shares issued and outstanding fell from 14.77 billion to 14.59 billion by 17 July 2026, a reduction of about 1.2%. That mechanically adds roughly a point of EPS growth per year at the current pace, which is meaningful but not large enough to offset a two-point gross margin swing.
Disclaimer
This article is analysis and information only. It is not investment advice, a recommendation, or an offer to transact in any security. The scenarios, probabilities and price levels are the author's own estimates derived from public filings and market data retrieved on 5 September 2026, and they may be wrong. Past performance does not indicate future results. Trading and investing carry risk, including the risk of losing your entire capital. Do your own research and consider taking advice from a regulated professional before making any financial decision.