

September CPI is the line on the Bureau of Labor Statistics calendar that the screens have been parked on: Wednesday 14 October 2026, 8:30 a.m. Eastern, the monthly Consumer Price Index report. The October schedule marks the 12th as Columbus Day, so the number arrives in a three-session week, with real earnings for September stamped for the same minute. The price-index office on the Bureau's contact block is not the headquarters sign at 200 Constitution Avenue NW. It is the Suitland Federal Center, floor 7, 4600 Silver Hill Road. What that office publishes at 8:30 is a set of indexes. The annual contract does not pay on the seasonally adjusted monthly change that leads the press release. It pays on the 12-month change in the CPI-U before seasonal adjustment, taken to a single decimal, the same way the August report printed 3.4 percent. Twelve buckets sit under the event. Two of them hold most of the money.
The ladder's probability-weighted mean, taking each bucket label as the point and the yes price from the Gamma feed on 11 October, is 3.65 percent. The yes prices sum to 0.995, and the mean uses that sum as the weight. The Cleveland Fed's year-over-year CPI nowcast for September, on the table updated 9 October, is 3.60 percent. A twentieth of a point sounds like agreement. It is the gap between the middle of the 3.6 bin and the line where a 3.7 print begins. The book has the 3.7 percent bucket at 41.5 percent and the 3.6 percent bucket at 39.0 percent, so the crowd's median sits in the higher bin while the nowcast's point sits in the lower one. Run 156 final-week misses through that 3.60 point and the 3.7 percent bucket comes out at 21.8 percent, not 41.5. The September inflation annual market is the board those prices are taken from. Links to Polymarket are affiliate links, from which The Traders Spread may earn a commission at no cost to you.
Key facts
- September CPI is scheduled for Wednesday 14 October 2026 at 8:30 a.m. Eastern, with real earnings at the same time — BLS October 2026 release schedule, retrieved 11 October 2026.
- The CPI-U rose 0.4 percent in August, seasonally adjusted, and 3.4 percent over the 12 months before seasonal adjustment — BLS news release USDL-26-1496, 11 September 2026.
- The Cleveland Fed year-over-year CPI nowcast for September 2026 is 3.60 percent, with core CPI at 2.39 percent — Inflation Nowcasting table, updated 9 October 2026, page retrieved 11 October 2026.
- The 3.7 percent bucket is marked at 41.5 percent yes, on about $23,860 of volume and $5,473 of liquidity, bid 41 cents and ask 42 — Polymarket Gamma, 11 October 2026.
- The 3.6 percent bucket is marked at 39.0 percent yes, on about $32,879 of volume and $8,148 of liquidity — Polymarket Gamma, 11 October 2026.
- U.S. regular gasoline was $4.465 a gallon in the week of 28 September and $4.354 in the week of 5 October — U.S. Energy Information Administration, retrieved 11 October 2026.
Where 3.60 sits on the index
Resolution is the 12-month change in the CPI for the period ending September 2026, before seasonal adjustment, as the monthly Bureau of Labor Statistics report states it, to one decimal. A print of 3.6 percent is any unrounded change from 3.55 percent up to, but not including, 3.65. A print of 3.7 starts at 3.65 and runs to 3.75. The August release is the worked example: the unrounded change on the not-seasonally-adjusted CPI-U was 3.397 percent, and the Bureau reported 3.4.
The base index is already printed. September 2025 CPI-U, not seasonally adjusted, series CUUR0000SA0, stands at 324.800. August 2026 stands at 334.980. Both are from the Bureau's public series, retrieved 11 October 2026. A 3.60 percent year-over-year change puts the September 2026 index at 336.493. The door into a 3.7 print, an unrounded 3.65 percent, puts it at 336.655. The gap is 0.162 index points. From August that is a not-seasonally-adjusted rise of 0.45 percent versus 0.50 percent. Half a percent on the month is what separates the two prints. Eleven twelfths of the ratio are known. On about $147,187 of volume, the open question is that one change.
The same Cleveland Fed page reports September numbers that do not answer this contract. The year-over-year cell is 3.60 percent, from not-seasonally-adjusted CPI. The month-over-month cell is 0.53 percent and is seasonally adjusted, so it cannot be added to the August index and treated as the print. Third-quarter CPI on that page is 1.57 percent, seasonally adjusted and annualized, a quarter-on-quarter rate pulled down by a high May. The seasonally adjusted index, series CUSR0000SA0, was 333.979 in May and 332.568 in June. Reading 1.57 as the inflation rate is reading a different object.
One data hole does not replace the base. The Bureau did not publish an October 2025 CPI report. The Cleveland Fed's December 2025 note says the model filled that month's change with its estimate as of 17 December 2025, then implied a November change from levels the Bureau did publish on 18 December. Those patched changes sit in the model's history. They do not replace the September 2025 index of 324.800, the denominator of this 12-month ratio. If the September report is late, the contract can wait until the next scheduled release and then use the latest published month. That is a delay clause, not a new definition.
Book versus the miss record
Fair value here is not a second point forecast. The point is the Cleveland Fed's: 3.60 percent year over year on the table dated 9 October. In the chart file with that same vintage, the daily path is 3.601 from 1 October through 7 October. It had stopped moving before this weekend. What we add is how far that final pre-release nowcast has been from the actual year-over-year change.
The sample is every month from August 2013 through August 2026 in that file with a last nowcast posted before the actual. That is 156 months. October 2025 has no actual in the file. September 2026 is still open. For each month the error is the actual minus the last nowcast. Add the error to 3.601, round half-up to one decimal, and count the bucket. The 3.7 percent bucket comes up 34 times out of 156, which is 21.8 percent. The 3.6 percent bucket comes up 63 times, 40.4 percent. The 3.5 percent bucket comes up 22 times, 14.1 percent.
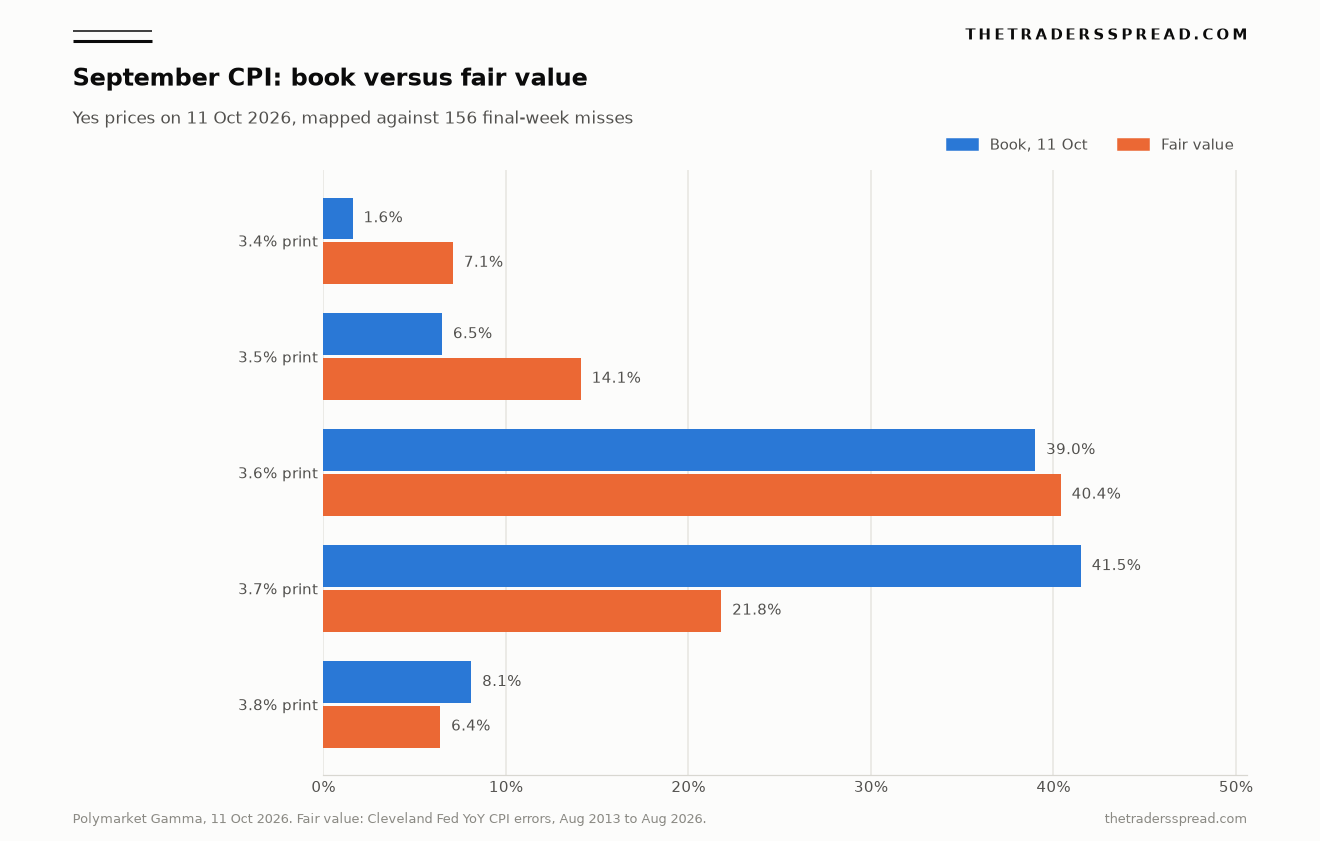
The bars are the yes price on 11 October against that count. The 3.6 percent bucket is where the book and the record nearly meet: 39.0 percent in the market, 40.4 percent on the error map. The 3.7 percent bucket is the break. Gamma marks it at 41.5 percent, with a bid at 41 cents and an ask at 42. The one-cent spread is not the discrepancy. About twenty cents is. Volume on that leg is about $23,860, with $5,473 of liquidity. The 3.6 percent leg has had more trade, about $32,879 of volume and $8,148 of liquidity, quoted 38 cents bid and 40 cents ask around a 39 cent outcome price.
| September CPI bucket | Yes price, 11 Oct | Fair value | Gap |
|---|---|---|---|
| 3.4% | 1.6% | 7.1% | Fair higher |
| 3.5% | 6.5% | 14.1% | Fair higher |
| 3.6% | 39.0% | 40.4% | In line |
| 3.7% | 41.5% | 21.8% | Book higher |
| 3.8% | 8.1% | 6.4% | Near |
| 3.9% | 0.8% | 0.6% | Near |
The 3.9 percent yes price on the feed is 0.75 percent, shown as 0.8 in the table. Below 3.4 percent the five buckets from 2.9 or less through 3.3 add up to 1.45 cents of yes price. The error map is fatter in that left tail than the book is. The ladder is confident the print lands in a two-tenth band. The record is less so. Same-bucket hits across the 156 months are 55, a 35 percent rate. A 40 percent fair value on 3.6 means "most likely," not "settled."
A shorter window does not rescue the price. From January 2024 through August 2026, 31 months, the same count puts 16.1 percent in the 3.7 bucket and 48.4 percent in the 3.6 bucket. The 21.8 percent figure keeps the 2021 and 2022 misses. Even that harder test leaves the book near twice fair value. The 3.7 percent leg is the contract this reading applies to.
A four-tenth miss, already on the tape
Fair value is 22 percent, not 5, because the nowcast has already been wrong by several tenths in this calendar year.
For June 2026 the last year-over-year CPI nowcast in the file, posted 9 July, was 3.921 percent. The actual, posted 10 July, was 3.531 percent. The miss was 0.39 points. The Bureau's index matches the actual: June 2026 CPI-U, not seasonally adjusted, was 333.952, and June 2025 was 322.561. The ratio is 3.53 percent, which rounds to a 3.5 print. The nowcast had been sitting on a 3.9. One day before the release, model and print were four buckets apart.
April was the other large miss. The last nowcast, on 6 May, was 3.565 percent. The actual, on 7 May, was 3.811 percent: a 3.6 bin against a 3.8 bin. July and August then landed on the tenth. The July nowcast on 7 August was 3.419 against an actual of 3.365, and the August nowcast on 8 September was 3.376 against an actual of 3.397. Both round to 3.4, the tenth the 11 September release printed for August and for July. Two quiet months do not retire a 0.39 miss.
August shows where a quiet nowcast can still break. The CPI-U rose 0.4 percent on the month, seasonally adjusted, after 0.1 percent in July. Gasoline rose 3.9 percent and accounted for more than a third of that increase. Energy rose 16.3 percent over the year. Core rose 0.3 percent on the month and 2.4 percent over the year. The 12-month headline rate stayed at 3.4 while the monthly rate picked up, and the pickup was concentrated in energy.
Retail gasoline through the September survey window did not roll over. U.S. regular was $4.478 a gallon in the week of 21 September, $4.465 in the week of 28 September, and $4.354 in the week of 5 October, down 11.1 cents on that last week. The drop is an October price. Collection for September was already over. Our note on the rise to $4.478 covers the late-September jump. It does not put the first week of October into the September index. The CPI gasoline index and the EIA pump price are different series. August's 3.9 percent is the Bureau's component, not a gallon price.
The 3.7 that is not this 3.7
Someone paying 41 or 42 cents for the higher bucket has a story. It points at a different number.
On 16 September the Federal Open Market Committee voted 12 to 0 to raise the target range for the federal funds rate by a quarter point, to 3-3/4 to 4 percent. The statement said inflation remains elevated. At the press conference that afternoon, Chair Warsh, chairman of the Federal Reserve, was plainer. "The plain fact is that inflation is too high and has been for too long," he said. He then gave the figure a desk might paste onto this ladder: "Based on the most recent CPI and PPI data, the 12-month change in total PCE prices likely was around 3.6 percent in August. Core PCE and CPI prices are running at about 3.2 and 2.4 percent, respectively." Both lines are from his 16 September press conference.
Read them against the release. The 2.4 percent matches core CPI for the year through August. The 3.6 percent is his estimate of total PCE, for August, not a September CPI print. Headline CPI that month was 3.4 percent, published five days earlier. PCE and CPI do not share a tenth, and an August PCE estimate is not this bucket.
The Summary of Economic Projections makes the mix-up easier. The median has total PCE at 3.7 percent for 2026 and 2.3 percent for 2027, core PCE at 3.4 percent, unemployment at 4.1 percent, and the funds rate at 4.1 percent at the end of this year and the end of next. Warsh said he had not filed a projection of his own. A 3.7 on that page is a full-year PCE figure. The 3.7 on the ladder is one month of CPI, rounded to a tenth. The September decision note is where the hike itself is discussed.
The next policy meeting is 27 and 28 October, on the Board's calendar, thirteen days after this release. It is not a projections meeting. The next one of those is 8 and 9 December. September CPI will be public before the October meeting, which is why the print is on every rates screen. It does not turn this ladder into a shadow contract on the funds rate. The October decision market has its own resolution, and this piece does not reprice it.
What the 41.5 cent price is worth
The leg priced here is the 3.7 percent yes. On the Gamma outcome price of 11 October the book shows 41.5 cents, with the quote at 41 to 42. Fair value is the share of 156 final-week Cleveland Fed misses that land in that bucket once they are added to the 3.60 nowcast and rounded the way the release rounds. That share is 21.8 percent. The market price sits above it. The stored reading on this piece follows that comparison. It is not an instruction.
RelatedWill the US Invade Iran Odds: Book Trades at 15.5%
The 3.6 percent yes, at 39.0 cents against a 40.4 percent fair value, reads in line. It contains the nowcast only if 3.60 is exactly right, which the record will not grant. The same record puts about half as much weight on the 3.7 bin as the book does. A ladder mean of 3.65 percent flips which tenth holds the median. It does not justify 41.5 cents.
What would change the figure before Wednesday is a move in the Cleveland Fed cell, which has sat on 3.60 since 1 October. At 3.65 or higher, the point is inside the 3.7 bin and 21.8 percent is stale. September's pump prices are already in the 9 October nowcast. The 11 cent drop in the week of 5 October belongs to October. A June-sized miss, four tenths, can still land the print in 3.7 or 3.8. That risk is why fair value is 22 percent rather than a token, and it is already in the count.
Drop 2021 and 2022 and the gap gets wider, not narrower: the later window puts the 3.7 fair value near 16 percent. A yes price around 22 cents is what it would take for this reading to move from above fair value to in line. Until the nowcast moves, or the price does, the 3.7 percent bucket is the rich leg. The 3.6 percent leg is where the book and the record agree.
Questions the ladder keeps drawing
When is the September CPI released?
The Bureau of Labor Statistics lists the September 2026 Consumer Price Index for Wednesday 14 October 2026 at 8:30 a.m. Eastern. Real earnings for September carry the same time. Monday 12 October is Columbus Day, so the print falls in a three-session week. The annual Polymarket event is set to end at 03:59 UTC on 15 October 2026.
What does the contract actually settle on?
It settles on the 12-month CPI change for the period ending September 2026, before seasonal adjustment, as the monthly BLS release states it, to one decimal. A seasonally adjusted monthly change is not the resolution figure. Nor is core CPI, PCE, or the quarterly rate on the Cleveland Fed page. If the report is late, the rules let the market wait for the next CPI date and then use the latest published month.
Why is a 3.60 nowcast not a 60 percent chance of a 3.6 print?
The release rounds to a tenth. The nowcast is a point inside one of those tenths, not a probability. A 3.60 point is the center of the bin that prints as 3.6, from 3.55 up to 3.65. How often the actual lands there depends on past misses. On 156 final-week misses, that share is about 40 percent. The 3.7 bin takes about 22 percent of the same record.
Does the missing October 2025 CPI report void this market?
No. The Bureau skipped the October 2025 release during the federal service suspension, and the Cleveland Fed patched that month inside its model. The denominator of the September 2026 change is the September 2025 index, 324.800, which was published. The patch can affect the model's monthly path. It does not replace the official base this contract divides by.
Is this the same 3.7 percent as the Fed's 2026 projection?
No. The September Summary of Economic Projections has a median of 3.7 percent for total PCE inflation in 2026, a full-year PCE figure from the 15-16 September meeting. This contract is one month of CPI, not seasonally adjusted, rounded to a tenth and due on 14 October. Chair Warsh's remark that August PCE was likely around 3.6 percent is an August estimate. Headline CPI for August was 3.4 percent.
What would make 41.5 cents look reasonable?
A Cleveland Fed year-over-year CPI nowcast for September at 3.65 percent or higher, posted before the release, would put the point inside the 3.7 bin and retire the 21.8 percent figure. The cell has not moved off 3.60 since 1 October. A miss as large as June's, nowcast 3.92 against an unrounded 3.53, can also land the print in 3.7 after the fact. That possibility is already in the historical count.
Disclaimer. This is analysis, not a recommendation and not an offer to transact. Nowcasts miss, contract prices move, and money staked on a prediction market can be lost. Nothing here instructs a reader to take either side of a contract. Links to Polymarket are affiliate links, as noted above.