

The Nasdaq 100 as it stood on 30 June is laid out line by line in a holdings schedule that Invesco QQQ Trust filed with the SEC on 28 August. Nvidia sits on top at 7.60% of the fund and Apple second at 6.67%. Third, ahead of Microsoft, is Micron Technology, a memory-chip maker, at 5.64%. A few lines further down are Applied Materials, Lam Research and KLA, three makers of chip-production equipment, and each of them closed on 30 June at its highest price of the past twelve months. Add up every chip, memory and storage company on the schedule and you get 17 names holding 38.5% of the fund. Eleven weeks later, at Monday's close on 14 September, the index stood at 29,127.16. That was 0.82% lower on the day, 3.8% below its end-of-June level and 5.0% under the record close of 30,660.60 set on 2 June, according to Nasdaq's own index history.
Where did the 1,149 points go? We took the fund's 40 largest weights on 30 June and multiplied each by that stock's price change to Monday's close. Those 40 holdings cover 83% of the fund and account for all but about 63 points of the fall. The 17 chip names removed roughly 2,115 index points. Alphabet, Amazon, Apple, Meta and Microsoft added about 952 between them, and Microsoft alone contributed 467 after a 35.5% rise. The three equipment makers did the most damage for their size: 6.5% of the fund cost the index about 800 points. Over the same stretch the Nasdaq-100 Equal Weighted Index fell 3.5%, close to the headline index's 3.8%, so this was never a few giants propping up a collapsing crowd. One industry fell hard while five platform companies climbed. The next leg for the index depends on which of those two trades gives way first.
Key facts
- The Nasdaq 100 closed at 29,127.16 on Monday, down 241.28 points or 0.82%, and 5.00% below its 2 June record close of 30,660.60 — Nasdaq.com NDX historical data, cross-checked with CNBC .NDX, 14 Sep 2026
- The index is up 15.36% in 2026 and 26.9% above its 30 March closing low of 22,953.38 — Nasdaq.com NDX historical data, 14 Sep 2026
- Seventeen semiconductor, memory and storage stocks made up 38.5% of Invesco QQQ Trust on 30 June, led by Nvidia at 7.60% and Micron at 5.64% — SEC Form N-PORT for period ended 30 Jun 2026, filed 28 Aug 2026
- The 10-year Treasury par yield closed at 4.97% on 14 September, its highest close of 2026; its last close at or above 5% was 5.04% on 19 July 2007 — US Treasury daily par yield curve, 14 Sep 2026
- The Fed's target range is 3.50% to 3.75%, and Polymarket priced a 25bp increase at 87.5% ahead of Wednesday's decision — federalreserve.gov and Polymarket, 06:46 UTC 15 Sep 2026
- October WTI crude settled at $101.39 on Monday, 10.8% above its 4 September settlement of $91.48 — CNBC CLV26 daily bars, 14 Sep 2026
Where 1,149 points went after 30 June
The method is simple and it has limits, so here they are. QQQ holds the index's members in close to index weights, which makes its N-PORT schedule a workable stand-in for Nasdaq's own weight file, which is not published free. Holding those weights fixed from 30 June assumes membership and share counts did not change before Monday. Nasdaq's September rebalance takes effect on 21 September, after that window, so the assumption holds up. Prices are stockanalysis.com daily closes, and we checked the 30 June and 14 September closes for the eight stocks that matter most against CNBC's daily bars. They matched to the cent.
| Stock | QQQ weight, 30 Jun | Price change, 30 Jun to 14 Sep | Est. index points |
|---|---|---|---|
| Microsoft | 4.35% | +35.5% | +467 |
| Apple | 6.67% | +15.1% | +305 |
| Palantir | 1.16% | +48.5% | +171 |
| Meta Platforms | 2.62% | +18.2% | +144 |
| Nvidia | 7.60% | +5.4% | +125 |
| AMD | 4.10% | −15.1% | −187 |
| KLA | 1.71% | −44.0% | −227 |
| Lam Research | 2.35% | −36.9% | −262 |
| Intel | 3.04% | −30.4% | −280 |
| Applied Materials | 2.49% | −41.3% | −311 |
| Micron Technology | 5.64% | −19.9% | −341 |
Source: Invesco QQQ Trust N-PORT (30 Jun 2026), stockanalysis.com and CNBC closing prices to 14 Sep 2026. Points are The Traders Spread estimates: 30 June weight × price change × the 30 June index close of 30,276.35.
Two things stand out. The first is the size of the equipment reversal. Applied Materials fell from $723.00 to $424.21, Lam Research from $433.33 to $273.49 and KLA from $301.71 to $169.09, and all three had peaked on the very day the filing captured. Micron, the memory name that had climbed above Microsoft in the weights, gave back a fifth of its value.
The second is Nvidia. Sixteen of the 17 chip names fell. The largest holding in the index rose 5.4% and added 125 points, and on our estimate it now carries about 8.3% of the index, up from 7.6%.
Monday repeated the pattern in miniature. Lam Research fell 8.29%, Applied Materials 7.07%, KLA 6.39%, Micron 5.25% and Nvidia 3.36%, while Alphabet's class A shares rose 3.22%, Meta 2.71% and Microsoft 1.97%, on CNBC closing data. Those five chip stocks alone took roughly 250 points off a day on which the whole index lost 241. We covered AMD's gross-margin guidance in our earlier piece on the stock, and the bull and bear levels for the period's biggest gainer are in our Microsoft forecast. The same chip-heavy build is dragging on Tokyo too, as our Nikkei 225 forecast set out on Monday.
A 4.97% Treasury yield and a hike priced at 87.5%
The chip reversal happened while the price of money went up. The US Treasury's par yield curve put the 10-year note at 4.97% on 14 September, its highest close of 2026 and 53 basis points above where it ended June. It has not closed at or above 5% since 19 July 2007, when it finished at 5.04%, and the October 2023 peak stopped at 4.98%. Before dawn in New York on Tuesday, CNBC's real-time quote showed the note at 5.022%.
Wednesday's Federal Reserve decision is the next test. The target range for the federal funds rate has been 3.50% to 3.75% since December 2025, per the Fed's open market table. At the last meeting on 29 July the Committee held by a 9 to 3 vote. All three dissenters, Beth Hammack, Neel Kashkari and Lorie Logan, preferred a quarter-point increase, according to the July statement, which attributed part of elevated inflation to supply shocks in sectors including energy. Polymarket's September decision market priced a 25bp rise at 87.5% and no change at 11.5% at 06:46 UTC on Tuesday, with $33.8 million traded on the hike outcome alone. It resolves on the statement from the 15 to 16 September meeting, which also brings a fresh set of economic projections. Our prediction markets desk tracked how those hike odds built up.
Oil is the part of the inflation picture the July statement singled out, and it has jumped again. The October WTI contract settled at $101.39 on Monday, up 10.8% in a week, and traded at $103.30 early on Tuesday, per CNBC. The supply side of that move is in our Brent crude forecast.
Does the Nasdaq 100 care about yields? For most of the past year, barely. We compared the index's daily percentage moves with daily changes in CNBC's 10-year yield series. From September 2025 to early March the correlation was +0.13, which is noise. During the rebound from the 30 March low to the 2 June record it was −0.70, so the index's best days tended to be the days yields fell. Since the record it has loosened to −0.25, with the index losing about 1% for every 10 basis points the yield added in a session. That is a loose relationship rather than a rule, but it points one way, and the yield has added 51 basis points since 2 June.
Our S&P 500 forecast dealt with how thin the gap between equity earnings yields and the 10-year has become. The Nasdaq 100's problem is different. Its largest industry is the one falling, and a Fed raising rates into an oil shock offers a cyclical industry little help.
The chart: a June record, then a lower high in August
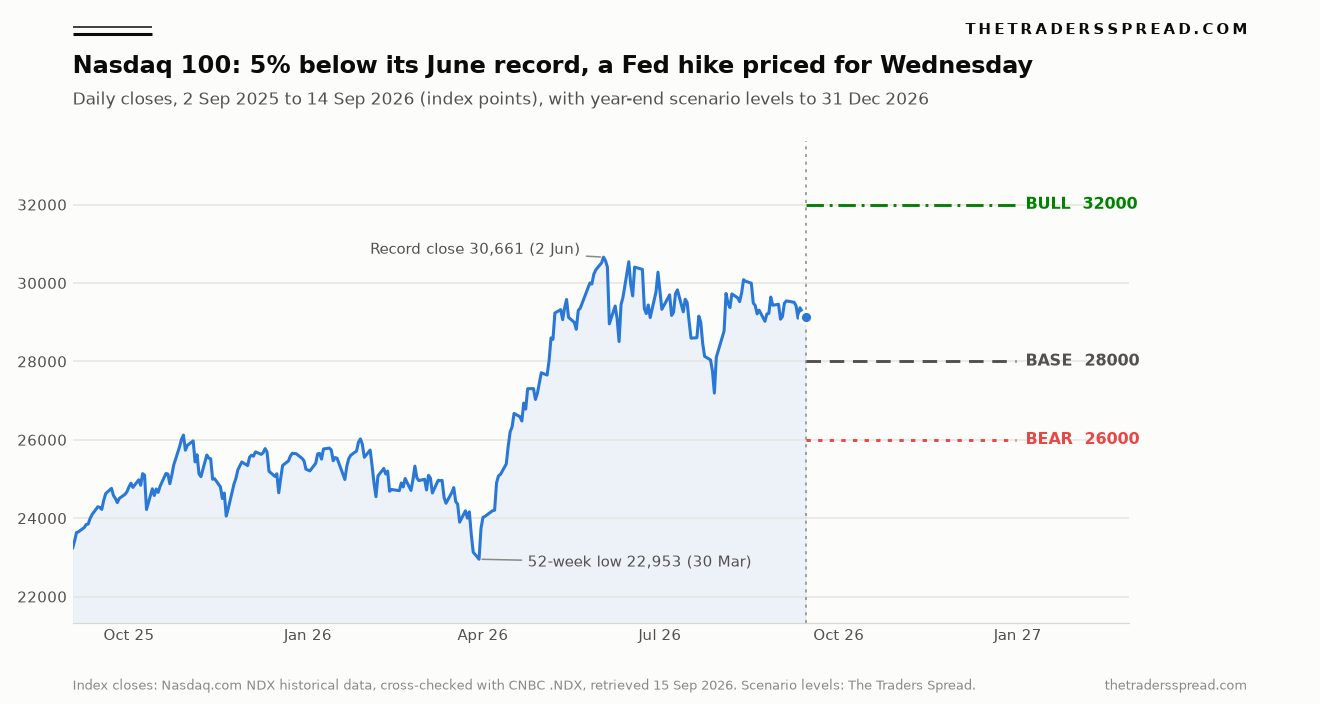
The line shows the rally the index is still living off. From the 30 March close of 22,953.38 it climbed 33.6% in nine weeks to the June record. Since then it has traded between 27,192.31, the 29 July close, and 30,571.24 on 3 June. The August rebound stalled at 30,084.50 on 13 August.
The table puts the headline index beside its equal-weight version, the S&P 500 and the 10-year yield over the same windows. Read the bottom row carefully. Over the past month the equal-weight index has fallen faster than the headline one, which means the weakness has spread beyond the chip names into the index's smaller members. The equal-weight index made its highest close of the past year on 13 August, the same day the S&P 500 set its record and ten weeks after the Nasdaq 100 set its own.
| Window to 14 Sep | Nasdaq 100 | Nasdaq-100 Equal Weighted | S&P 500 | 10-year yield |
|---|---|---|---|---|
| 2026 to date (from 31 Dec) | +15.36% | +15.21% | +11.31% | +79bp |
| From 30 Mar low | +26.90% | +22.69% | +20.12% | +62bp |
| From 2 Jun record | −5.00% | −3.14% | +0.13% | +51bp |
| From 30 Jun (filing date) | −3.80% | −3.46% | +1.61% | +53bp |
| From 13 Aug | −3.18% | −5.47% | −2.30% | +34bp |
Source: Nasdaq.com and CNBC daily index closes, US Treasury daily par yield curve (10-year), retrieved 15 Sep 2026.
Nasdaq's rulebook sets two dates before year-end
Nasdaq's index methodology fixes two dates that matter before the end of 2026. The September quarterly rebalance uses share counts and market values from the last trading day of August and takes effect at the open on the first trading day after the third Friday of September, which makes it Monday 21 September. The annual reconstitution, when all 100 places are re-ranked by full market capitalisation, uses data from the last trading day of November. It takes effect at the open after the third Friday of December, 18 December, so the new line-up is live from Monday 21 December.
Each rebalance can cut the heaviest weights, but only when concentration crosses set lines. If any company's weight exceeds 24%, it is cut to 20%. If the companies weighing more than 4.5% add up to 48% or more, that group is scaled back to 40%. On our estimate, carrying the 30 June weights forward to Monday's prices, five companies sit above 4.5%: Nvidia at about 8.3%, Apple 8.0%, Alphabet 6.4% across its two share classes, Microsoft 6.1% and Micron 4.7%. Amazon is just below the line at about 4.45%. The group totals about 33.5%, well below the 48% trigger, so the caps should not bind in September and the index goes into the Fed decision with its current mix intact.
For anyone following the index through a contract for difference, one practical point. The cash index is calculated only during US trading hours, so an overnight US Tech 100 quote reflects futures. December Nasdaq 100 futures were 0.29% lower at 02:41 New York time on Tuesday, on CNBC's delayed feed. The live level sits on our Nasdaq 100 page.
The case against a bearish lean
The strongest argument on the other side is the one in the first table. Apple, Microsoft, Alphabet, Amazon and Meta together make up about 28% of the index on our estimate, and four of the five are higher since 30 June. As long as that block keeps rising, the chip names have to fall a long way to pull the index much lower. They have already fallen a long way. Applied Materials, KLA and Lam Research are down 37% to 44% in eleven weeks, and a further 40% from here is a much harder case than the first one was.
The rate story cuts both ways too. A quarter-point hike priced at 87.5% is close to fully expected, so the statement and the projections matter more than the move itself. The index is still up 15.4% this year, the S&P 500 is only 2.3% below its record, and the 29 July low of 27,192.31 sits within 50 points of the 200-day average, now 27,151.
A clean retest of that area would be a normal correction inside a rising year, not a break.
The call: 28,000 base, 32,000 bull, 26,000 bear by 31 December
We lean modestly bearish on the Nasdaq 100 into year-end, with low conviction. Three-month realised volatility is 21.9% annualised, which puts a one-standard-deviation range to 31 December at roughly 25,900 to 32,800. Our bull and bear levels sit near its edges.
RelatedGBP/NOK Price Prediction: 13.20 Bull Case vs 12.10 Bear
Base case, 50%: 28,000 (−3.9% from 29,127.16). The Fed moves as priced, the 10-year holds near 5% and oil stays above $95. Chip stocks stay under pressure while the five platform companies hold their ground. The index drifts toward the 200-day average and the 38.2% retracement of the March-to-June rally at 27,716, and settles around 28,000 as the December reconstitution approaches.
Bull case, 20%: 32,000 (+9.9%). This needs a record close above 30,660.60 first. The route would be a chip rebound led by the equipment names, a 10-year back below 4.6% and WTI below $90, with Microsoft and Apple still rising. It is possible, but it needs several of those things to happen together.
Bear case, 30%: 26,000 (−10.7%). The 10-year closes above 5% for the first time since 2007 and stays there. The Fed's projections point to more than one increase, WTI moves above $110, and the chip decline spreads to Nvidia, now the heaviest weight at about 8.3%. That takes the index to the 61.8% retracement at 25,898.
What would change my mind. A daily close above 30,700, which would be a new record, invalidates the bearish lean. So would the equal-weight index regaining its 13 August high of 10,542.80, since that would mean the weakness among the smaller members had reversed. A 10-year close below 4.60% would make us move the base case up.
FAQ
What is the Nasdaq 100 forecast for the end of 2026?
Our base case is 28,000 by 31 December, 3.9% below Monday's close of 29,127.16, with a 50% probability. The bull case is 32,000 (20%), which needs a new record close above 30,660.60. The bear case is 26,000 (30%), close to the 61.8% retracement of the March-to-June rally. These are scenario estimates, not certainties.
Why did the Nasdaq 100 fall while Microsoft and Apple rose?
Chip stocks are a far bigger share of the index. Using QQQ's 30 June holdings, 17 semiconductor, memory and storage names made up 38.5% of the fund and cost about 2,115 index points to 14 September. Alphabet, Amazon, Apple, Meta and Microsoft added about 952, so the index still fell 1,149 points.
How does a Fed rate hike affect the Nasdaq 100?
There is no fixed rule. Since the 2 June record the index has fallen about 1% for every 10 basis points the 10-year yield rose in a session, a loose relationship with a correlation of −0.25. Before March there was no measurable link. A hike priced at 87.5% is largely expected, so the Fed's projections may matter more.
When is the next Nasdaq 100 rebalance?
The quarterly rebalance takes effect at the market open on Monday 21 September, based on data from the last trading day of August. The annual reconstitution re-ranks all members using data from the last trading day of November and takes effect at the open on Monday 21 December, after the third Friday of December.
Is the US Tech 100 CFD the same as the Nasdaq 100?
It tracks the Nasdaq 100, but it is a derivative contract with your broker, not the index itself. Outside US cash hours the quote follows Nasdaq 100 futures, which can differ from the last cash close. Your broker's contract specification names the reference market, the financing charges and the margin required.
Disclaimer
This article is analysis and commentary, not investment advice or a recommendation to trade any instrument. Index CFDs are leveraged products and carry a high risk of losing money rapidly, and your capital is at risk. Scenario levels, probabilities and index-point attributions are the author's estimates and can be wrong. Prices quoted are closing or delayed and may differ from the level available to you.