

Twenty-eight basis points is all the S&P 500 paid over a 10-year US Treasury note at Friday's close on 11 September. FactSet puts the index on a forward price-to-earnings ratio of 19.1, which works out to a forward earnings yield of 5.24%, and the Treasury's par yield curve had the 10-year note at 4.96%, its highest close of 2026. The index finished the week at 7,656.98, up 0.86% on the day and 1.8% below its 13 August record close of 7,798.99. It rose on a Friday when bond investors pushed the benchmark note to a new high for the year and Polymarket traders made a Federal Reserve rate hike the heavy favourite for Wednesday. A cushion of 0.28 percentage points is thin. It is also the number that decides whether the index ends 2026 nearer 8,400 or 6,700, because at this multiple it can rise only as fast as its earnings do.
Here is what the headline multiple hides. A forward P/E of 19.1 looks unremarkable, a hair above FactSet's 10-year average of 19.0. Over the decade behind that average, though, the 10-year Treasury yielded 2.88%, on a simple mean of FRED's daily DGS10 series. Same multiple, a risk-free rate more than two points higher. The sharper shift came this summer. On 30 June the forward P/E stood at 20.4 with the index at 7,499.36; by 10 September the multiple had fallen to 19.1 while the index sat 1.2% higher, so the forward earnings estimate beneath it climbed roughly 8% in ten weeks. Earnings carried the benchmark through the summer and valuation went the other way, as the 10-year yield rose 52 basis points. That trade-off is what the rest of this forecast turns on.
Key facts
- The S&P 500 closed at 7,656.98 on Friday 11 September, up 65.28 points or 0.86%, and 1.82% below the 13 August record close of 7,798.99 — CNBC delayed index quote and FRED series SP500, retrieved 13 September 2026.
- The forward 12-month P/E is 19.1, against a 5-year average of 19.8, a 10-year average of 19.0 and a reading of 20.4 on 30 June — FactSet Earnings Insight, 11 September 2026.
- The 10-year Treasury par yield closed at 4.96% on 11 September, the highest of 2026 and up from 3.97% on 27 February — US Treasury daily par yield curve, 11 September 2026.
- Analysts expect Q3 2026 earnings growth of 28.7% and CY 2026 growth of 31.6%, slowing to 15.1% in CY 2027 — FactSet Earnings Insight, 11 September 2026.
- Polymarket prices a 77.5% chance of a 25 basis-point hike at the 15–16 September FOMC meeting and 21.5% on no change, on $142.9m of event volume — Polymarket gamma API, 13 September 2026, 13:41 UTC.
- The Fed held the target range at 3.50%–3.75% on 29 July on a 9–3 vote, with three dissenters preferring a quarter-point increase — FOMC statement, 29 July 2026.
- The five largest holdings of the SPDR S&P 500 ETF Trust make up 27.75% of the fund and the ten largest 38.15% — State Street SPY holdings file, dated 10 September 2026.
Earnings did the lifting after June, and the multiple gave ground
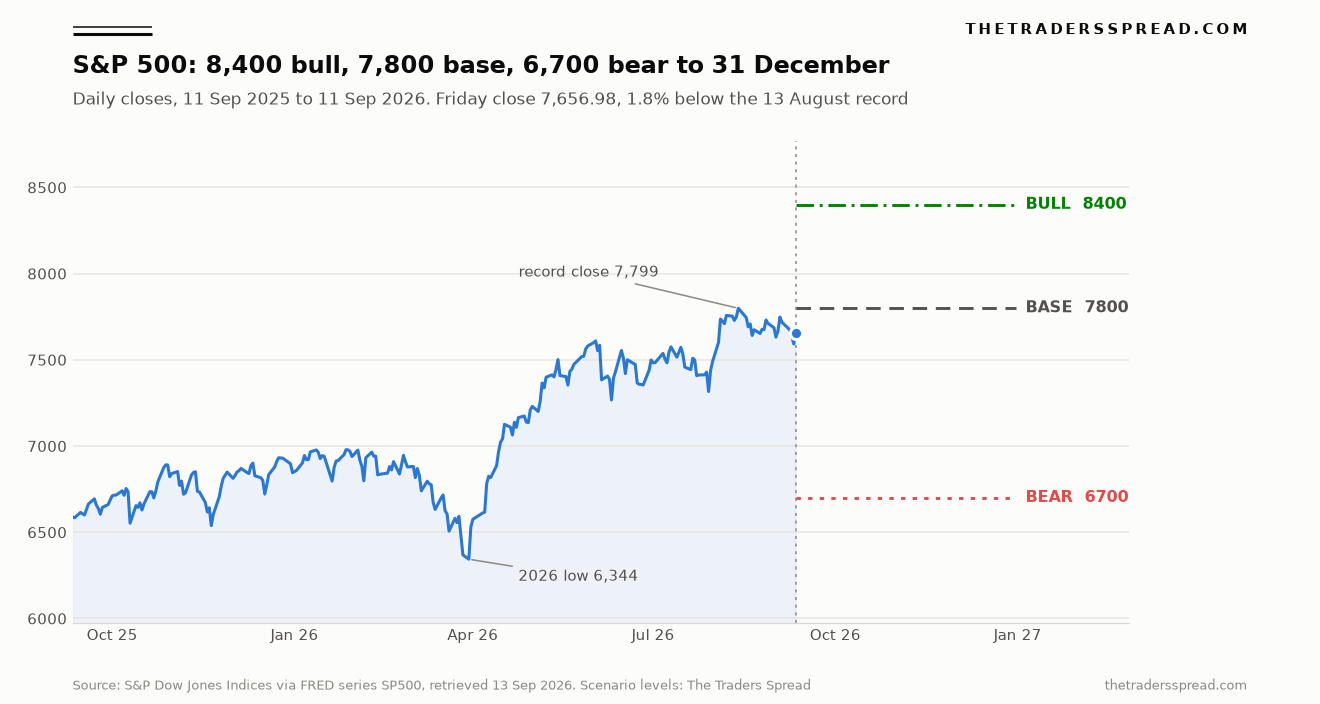
The chart covers a full year of daily closes. The index started at 6,587.47 on 11 September 2025, peaked at 6,978.60 in late January and slid 9.1% into a 2026 low of 6,343.72 on 30 March, stopping just short of a formal correction. From there it rallied 22.9% to the August record. It has since given back 1.8%, drifting for 20 sessions without a new high.
The table sets the three numbers that matter side by side. The ten-year column is approximate: FactSet's average multiple and the mean of FRED's daily yield cover nearly identical windows, and inverting an average P/E is not quite the same as averaging earnings yields. The gap is too wide for that nuance to close.
| Measure | 10-year average | 30 June 2026 | 11 September 2026 |
|---|---|---|---|
| S&P 500 close | n/a | 7,499.36 | 7,656.98 |
| Forward 12-month P/E | 19.0 | 20.4 | 19.1 (10 Sep) |
| Forward earnings yield (1 ÷ P/E) | about 5.26% | 4.90% | 5.24% |
| 10-year Treasury yield | 2.88% | 4.44% | 4.96% |
| Earnings yield minus Treasury yield | about 2.4 points | 0.46 points | 0.28 points |
| Implied forward EPS (close ÷ P/E) | n/a | about $368 | about $397 (10 Sep) |
| Polymarket odds of a September hike | n/a | 28.0% | 80.5% |
Sources: FRED SP500 and DGS10 (12 September 2016 to 10 September 2026), FactSet Earnings Insight of 11 September 2026 (which also reports the 30 June multiple), US Treasury par yields, and Polymarket's CLOB price history at the 00:00 UTC snapshots of 1 July and 12 September. The EPS and yield-gap rows are my own arithmetic.
Read the bottom rows together. In ten weeks the forward earnings figure rose by about $30 while the multiple applied to it fell by 1.3 turns. Had the P/E held at 20.4, the index would be trading near 8,100 today. It is not, because the 10-year yield rose 52 basis points and the market's hike odds nearly tripled over the same stretch.
So far, earnings are winning that race by a nose.
What a 77.5% hike price means for the index
The Federal Open Market Committee meets on 15 and 16 September, and the Fed's meeting calendar marks it as a projections meeting, so a fresh dot plot arrives with the statement. The upper bound of the target range has been 3.75% since December 2025. At the July meeting the Committee held there on a 9–3 vote, and the statement records that Beth M. Hammack, Neel Kashkari and Lorie K. Logan dissented because they preferred to raise the range by a quarter point.
Polymarket's Fed Decision in September market now treats a hike as the likeliest outcome by a wide margin. At 13:41 UTC on Sunday the 25 basis-point hike leg traded at 77.5% and the no-change leg at 21.5%, with the event's five legs carrying $142.9m of volume between them. Links to Polymarket are affiliate links, from which The Traders Spread may earn a commission at no cost to you. The contract resolves on the change in the upper bound as printed in the FOMC statement. Our prediction-markets desk has already covered how the hike leg repriced after the Jackson Hole keynote and why a cut in 2026 is priced at almost nothing, so neither argument needs repeating here. For the index, the timing of the last leg of the repricing matters more.
Polymarket's hourly price history shows the hike leg at 57.5% at 12:00 UTC on Friday and at 79.5% an hour later, half an hour before the New York cash open. Twenty-two points in sixty minutes. The S&P 500 then opened at 7,636.75, reached 7,677.02 and closed up 0.86%, while the Cboe Volatility Index fell 11.2% to 15.84. On the standard playbook, a market that has just made tightening its base case does not rally on the day. This one did, and Kevin Warsh supplied the reason a fortnight earlier.
In his Jackson Hole keynote on 28 August, Kevin Warsh, Chairman of the Federal Reserve Board, told the symposium: "For firms in the S&P 500, profits have grown by more than 20 percent over the past year. Profit margins are quite elevated, relative to history. Overall equity market volatility is low." He went on: "Expectations for growth in both cap-ex and corporate earnings are running quite high. I will continue to watch the change in their growth rates, the second derivative." A chair who cites index profits as evidence the economy can bear a hike is also telling equity holders the hike comes from strength. Friday's tape heard that half of the message.
The bond market heard the other half. Headline CPI ran at 3.40% year on year in August and core CPI at 2.45%, on the Bureau of Labor Statistics' unadjusted series, while the Fed's preferred core PCE gauge was 3.34% in July, according to FRED. None of those numbers argues for patience. The danger for the index is not one quarter-point move, which is priced. It is a dot plot showing two or three more, a 10-year yield pushed through 5%, and a 0.28-point cushion squeezed to nothing.
Five holdings, 27.75% of the benchmark
Concentration changes what a rate shock does. State Street's daily holdings file for SPY, dated 10 September, puts Nvidia at 8.08% of the fund, Apple at 7.33%, Microsoft at 5.59%, Amazon at 3.77% and Alphabet's Class A shares at 2.98%, with the Class C line adding another 2.39%. The five largest lines sum to 27.75% and the ten largest to 38.15%. SPY replicates the index, so its weights are a close proxy rather than an official S&P Dow Jones Indices figure.
Those same companies supply most of the earnings momentum. FactSet expects the Information Technology sector to grow Q3 earnings by 63.0% year on year, and the Semiconductors & Semiconductor Equipment industry by 125%. Strip the chipmakers out and the sector's growth rate falls to 24.0%. The race against the 10-year yield is being run largely by a few chip designers, and our coverage of Nvidia's $108 billion Q3 guidance sets out the scale of the biggest contributor.
Breadth tells a more mixed story than the concentration headline suggests. On dividend-adjusted closes from stockanalysis.com, the Invesco S&P 500 Equal Weight ETF (RSP) has returned 13.08% so far in 2026, slightly ahead of SPY's 12.68%, so the average member has kept pace over the year. The trouble is the shape of the last six months. From the 30 March low, SPY returned 21.25% against 14.69% for RSP. Since the 13 August record, SPY has lost 1.75% and RSP 3.53%. The pullback is hitting the typical constituent twice as hard as the cap-weighted benchmark, which is what rising yields do to companies without a chip-driven earnings cushion.
How deep the last five corrections ran
Every decline of 10% or more in FRED's ten-year run of daily closes, measured close to close, with the 10-year yield from FRED's DGS10 series and the policy backdrop from the Fed's target-rate history:
| Peak to trough | Decline | 10-year yield, peak to trough | Fed backdrop |
|---|---|---|---|
| 26 Jan 2018 to 8 Feb 2018 | −10.2% | 2.66% to 2.85% | Hiking cycle under way, upper bound 1.50% |
| 20 Sep 2018 to 24 Dec 2018 | −19.8% | 3.07% to 2.74% | Hikes in September and December 2018 |
| 19 Feb 2020 to 23 Mar 2020 | −33.9% | 1.56% to 0.76% | Pandemic shock |
| 3 Jan 2022 to 12 Oct 2022 | −25.4% | 1.63% to 3.91% | Five increases, upper bound 0.25% to 3.25% |
| 19 Feb 2025 to 8 Apr 2025 | −18.9% | 4.53% to 4.26% | On hold at 4.50% during the tariff shock |
Two of the five, late 2018 and 2022, came while the Fed was raising rates into an economy it judged strong, and they averaged a 22.6% fall. The 2022 episode is the closer analogy for valuation, since the 10-year rose 2.28 points and the index lost a quarter of its value. The 2018 one is the closer analogy for policy: a Committee that kept going after equities had signalled discomfort.
My bear case at 6,700 is shallower than either, a 14.1% fall from the record or 12.5% from Friday, and it sits 5.6% above the March low where demand last showed up. The median of the five declines, 19.8%, would put the index near 6,255, beneath that low. I treat that as the tail beyond the bear case rather than the bear case itself. The Fed is tightening from a 3.75% upper bound, not from zero as in 2022, and earnings are growing at close to 29%.
The 9,252 target and the discount rate it leaves out
Bottom-up analysts are far more optimistic. FactSet's bottom-up target price, which aggregates individual stock targets, is 9,251.61, or 21.9% above the 10 September close of 7,591.70. That figure is earnings optimism translated into index points at something close to today's multiple. It assumes the multiple survives, and the same report shows it has already lost 1.3 turns since June. Nothing in a sum of single-stock targets prices the 10-year yield.
For readers running the same question across markets, our DAX forecast and FTSE 100 forecast use the same 31 December horizon, so the three calls can be read side by side. The S&P 500 market page collects this forecast with the site's other index coverage.
The call: 8,400 bull, 7,800 base, 6,700 bear by 31 December
The arithmetic starts with forward earnings. If the forward 12-month estimate keeps rising at the 15.1% annual pace implied by FactSet's CY 2027 consensus, it grows about 4.4% between 10 September and 31 December, from roughly $397 to about $415. Each scenario is a multiple on that figure, and each multiple implies a yield gap over Treasuries.
RelatedEUR/NZD Bull Case at 2.06 Sits Above a 1.89 Bear Case
Base case, 7,800 (+1.9% from Friday's 7,656.98), probability 50%. The Fed lifts the range to 3.75%–4.00% on 16 September and the dots show at most one further move. The forward P/E drifts to about 18.8, an earnings yield of 5.32%, and the index finishes the year roughly back at its August record.
Bull case, 8,400 (+9.7%), probability 20%. The hike arrives with language that reads as one and done, the 10-year eases back toward the 4.44% it held at the end of June, and the multiple recovers to about 20.2, close to its 30 June level. Third-quarter results land near FactSet's 28.7% growth estimate.
Bear case, 6,700 (−12.5%), probability 30%. The dot plot signals two or more further increases, the 10-year closes above 5.25%, and investors demand a cushion of roughly 1.2 points over Treasuries again. At 16.1 times $415 the index sits at 6,700, 14.1% below its record and still above the March low.
What would change my mind? A 10-year yield back below 4.50% before the end of October would move me toward the bull case, because it reopens the cushion without needing faster earnings. A wave of cuts to Q3 guidance would push the other way, and so would a 10-year close above 5.25%, the point at which the index's earnings yield on today's multiple drops below the risk-free rate. I would treat that crossover as the invalidation of the base case. Weighted across the three scenarios, the expected level is about 7,590, close enough to Friday's close that the bias stays neutral, with conviction at 3 of 5.
FAQ
What is the S&P 500 forecast for the end of 2026?
Our base case is 7,800 by 31 December, 1.9% above Friday's close of 7,656.98, with a 20% probability on 8,400 and 30% on 6,700. The levels come from applying forward P/E ratios of 20.2, 18.8 and 16.1 to about $415 of forward 12-month earnings by year-end, derived from FactSet's consensus growth estimates.
Will a Fed rate hike push the S&P 500 lower?
Not necessarily on the day. Polymarket's hike odds jumped 22 points in an hour on Friday and the index still closed up 0.86%. The bigger risk is the path after the decision. A dot plot showing further increases would lift the 10-year yield, which at 4.96% already leaves the index's forward earnings yield only 0.28 points ahead.
Is the S&P 500 expensive at 19.1 times forward earnings?
Against its own history, no. FactSet puts the 10-year average at 19.0 and the 5-year average at 19.8. Against bonds, yes. Over the past decade the 10-year Treasury averaged 2.88%, and it closed Friday at 4.96%, so the same multiple now buys far less extra return over a risk-free asset than it used to.
How concentrated is the S&P 500?
Using SPY's 10 September holdings as a proxy, the five largest lines make up 27.75% of the index and the ten largest 38.15%, with Nvidia alone at 8.08%. Semiconductors are also FactSet's biggest single source of expected Q3 earnings growth in the technology sector, so the concentration runs through profits as well as prices.
Does an S&P 500 CFD track the index or SPY?
Index CFDs labelled US 500 or similar are quoted in index points and reference the index or its futures, so the levels in this article map onto them directly, while SPY trades at roughly one-tenth of the index level. A contract for difference is leveraged and carries overnight financing, so check the broker's contract specification for the exact underlying.
Disclaimer
This article is analysis and commentary, not investment advice or a recommendation to trade any instrument. Index CFDs and other leveraged products carry a high risk of losing money rapidly, and your capital is at risk. Scenario probabilities are the author's judgement and can be wrong. Past performance is not a reliable indicator of future results. Figures are sourced and dated in the text; check current prices before making any decision.