

USD/NOK is not Brent crude with a currency label stuck on the front. That story is comfortable, and it is the wrong description of this year. In June, Europe Brent spot fell from $98.29 a barrel on 1 June to $70.46 on 30 June, a drop of 28 percent, while the ECB reference rate for USD/NOK rose from 9.2524 on 29 May to 9.9267 on 30 June, a gain of 7.3 percent. In September the barrel went the other way, from $89.75 on 28 August to $113.96 on 29 September, up 27 percent, and USD/NOK rose again, from 9.3412 on 31 August to 9.6006 on 30 September, up 2.8 percent. Oil down, the pair up. Oil up, the pair up. A cross that was "just Brent" cannot print the same currency sign against both moves.
The control is the euro. On the same ECB rates, EUR/NOK went from 10.832 on 31 August to 10.9015 on 30 September, a rise of 0.6 percent. Strip the dollar out and the krone barely moved in the month everyone wants to call an oil month. The reference date for the spot anchor in this piece is 30 September 2026, and the figure is 9.6006 kroner per dollar.
USD/SEK makes the residue smaller. It rose from 9.5809 to 9.9789 between 31 August and 30 September, up 4.2 percent, on the same ECB rates. Sweden's krona is inside the dollar index. Norway's is not. The oil-sensitive currency weakened less than the one that helps define the dollar, and it still weakened. That gap, about a point and a half, is the oil bid's fingerprint. It is not a reason to treat USD/NOK as a crude contract. Norges Bank's I-44 index agrees: 110.49 on 31 August, 111.62 on 30 September, up 1.0 percent. A higher reading is a weaker krone.
- USD/NOK 9.6006 on 30 September 2026, from 9.3412 on 31 August. Source: ECB reference rate, via Norges Bank and frankfurter.dev.
- EUR/NOK 10.832 to 10.9015 from 31 August to 30 September, up 0.6%. Same ECB reference rates.
- USD/SEK 9.5809 to 9.9789, up 4.2%. Source: ECB reference rates, 31 August and 30 September.
- I-44 index 110.49 on 31 August to 111.62 on 30 September. Source: Norges Bank. Higher means a weaker krone.
- Europe Brent spot $89.75 on 28 August, $113.96 on 29 September. Source: EIA release dated 30 September 2026.
- Policy rate 4.50%, from 4.25%, decided 23 September. Source: Norges Bank, 24 September 2026.
- Fed funds target 3.75 to 4 percent after a quarter-point rise. Source: Federal Reserve, 16 September 2026.
Two crosses, one wedge
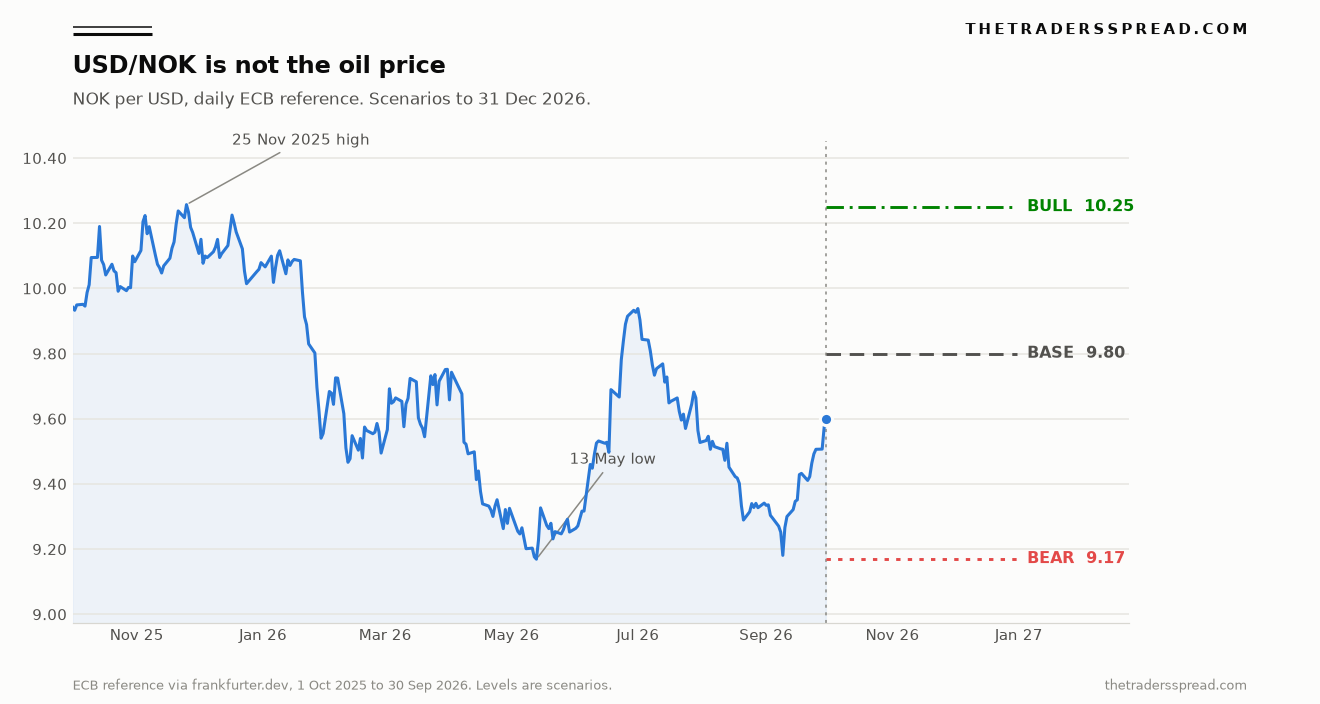
The chart below is the dollar leg on its own, daily, from 1 October 2025 to the 30 September reference. The bull line at 10.25, the base line at 9.80 and the bear line at 9.17 are scenarios drawn out to 31 December 2026. They are not market prices, and they are not orders.
| Leg | Earlier print | Later print | Change |
|---|---|---|---|
| USD/NOK | 9.3412 (31 Aug) | 9.6006 (30 Sep) | +2.8% |
| EUR/NOK | 10.832 (31 Aug) | 10.9015 (30 Sep) | +0.6% |
| USD/SEK | 9.5809 (31 Aug) | 9.9789 (30 Sep) | +4.2% |
| I-44 | 110.49 (31 Aug) | 111.62 (30 Sep) | +1.0% |
| Dollar basket, ECB rates | 99.55 (31 Aug) | 101.24 (30 Sep) | +1.7% |
| Brent spot, EIA | $89.75 (28 Aug) | $113.96 (29 Sep) | +27% |
| Brent spot, June | $98.29 (1 Jun) | $70.46 (30 Jun) | -28% |
| USD/NOK, June | 9.2524 (29 May) | 9.9267 (30 Jun) | +7.3% |
Read the last two rows before the September rows. June is the cleaner rejection of the cartoon. Brent fell by more than a quarter and USD/NOK had its largest month-end gain of 2026. If the krone simply tracked the barrel, June should have been a collapse in the dollar's price in kroner. It was a spike.
September is the subtler failure. The barrel rose, and the krone did not collect the move. USD/NOK rose by less than USD/SEK. That gap is the only oil fingerprint in the reference rates, and it was not large enough to flip the sign.
On the year the cartoon looks more alive, which is why it lasts. From 2 January to 30 September, USD/NOK fell from 10.0661 to 9.6006, down 4.6 percent, and EUR/NOK fell from 11.7985 to 10.9015, down 7.6 percent. I-44 fell from 119.59 to 111.62, a stronger krone. Brent rose from $63.00 on 5 January to $113.96 on 29 September, up 81 percent, on the EIA Europe Brent spot series. A huge oil rally and a firmer krone can share a year. They still do not make the daily cross a barrel. In both windows the dollar is the wedge: over the year USD/NOK fell less than EUR/NOK, and in September it rose more.
The EUR/NOK forecast published on 19 September is the euro leg of this story. This page does not rerun it. The question here is what the dollar did to the same krone.
March and June were larger dollar months
A line that made the rounds into month-end had the dollar posting its best month since March. I could not pull an ICE settlement history in this session, so I did not adopt a headline close. I rebuilt the basket from the ECB reference rates themselves, which are the rates that price USD/NOK.
The weights are the ones ICE uses for the US Dollar Index: euro 57.6 percent, yen 13.6, sterling 11.9, Canadian dollar 9.1, Swedish krona 4.2, Swiss franc 3.6, with the index's standard scaling constant of 50.14348112. On that reconstruction the index finished 30 September at 101.24, up 1.7 percent from 99.55 on 31 August. A cash index quoted near 101.5 can differ by a few tenths, because a futures settlement is not a 14:15 CET reference. The ranking of the months is the part that changes the story, and the ranking is measurable on one set of rates.
Month-end to month-end, the same basket in 2026: January down 1.7 percent, February up 1.2, March up 2.6, April down 1.8, May up 0.7, June up 2.3, July down 1.0, August down 0.8, September up 1.7. September was third. March was larger.
June was larger.
The euro is 57.6 percent of that basket, so the dollar's month is mostly an EUR/USD month. The EUR/USD forecast is the place for that call. NOK is outside the basket. SEK is inside it, which is why a firm dollar and a soft Swedish krona lifted USD/SEK by more than the basket in September. The USD/SEK forecast covers that cross. USD/NOK inherited the dollar's rise and a smaller slip in the krone.
Repeat the basket's September gain, and nothing else, and USD/NOK does not reach 10 from 9.6006. The pair's own September gain was 2.8 percent, larger than the basket's 1.7 percent, only because the krone slipped too. Stack those again and you are in the high 9s, not through the January highs. That is why the base case is 9.80, and why 10.25 is the tail rather than the centre.
A hike that did not turn the pair
On 23 September the Monetary Policy and Financial Stability Committee raised the policy rate from 4.25 percent to 4.50 percent. Norges Bank published the decision the next morning. The reference rate that day, 24 September, was 9.492. A week later it was 9.6006. The hike did not turn USD/NOK.
"Inflation has been above target for several years. By raising the policy rate, we are helping to reduce inflation. It will likely be necessary to keep the policy rate elevated for a time, and the Committee is prepared to raise the policy rate further if needed to bring inflation down to the 2% target within a reasonable time horizon."
That is Ida Wolden Bache, governor of Norges Bank, in the 24 September press release. The next decision is 5 November. The forecast keeps the rate near 4.50 percent for a while, then lower, with inflation down to 2 percent in 2029.
The prices she cited are Statistics Norway's. From August 2025 to August 2026 the consumer price index rose 3.3 percent, and CPI-ATE rose 3.0 percent, published on 10 September. In the press-conference statement the same morning she said registered unemployment was 2.1 percent of the labour force in August, and that the krone "has appreciated so far this year and is now stronger than assumed in the June projections."
She is right on the year, and since June. I-44 was 115.75 on 30 June and 111.62 on 30 September, down 3.6 percent, a stronger krone. USD/NOK went from 9.9267 to 9.6006, down 3.3 percent. September gave back a slice of the summer. It did not erase it.
The Federal Reserve hiked the same month. On 16 September the committee raised the target range by a quarter of a percentage point, to 3.75 to 4 percent, by a 12-0 vote. The statement says the move is meant to support a timelier return to the 2 percent goal. Do the arithmetic on the gap. Before the two decisions, Norway's policy rate was 4.25 percent and the top of the Fed's range was 3.75 percent, a gap of half a point. After both hikes the gap is 4.50 against 4.00. Still half a point.
The gap did not widen.
A Norges Bank hike that is matched, basis point for basis point, by the Fed does not hand the krone a new carry advantage against the dollar. It keeps the old one. Bache also said that US and euro-area policy rates had been raised in recent weeks and that further rises were expected in the US. Higher rates abroad, she argued, pull Norwegian rates up with them, partly through the krone.
"I'm not going to prejudge any future decisions we make."
Kevin Warsh, chairman of the Federal Reserve, at the 16 September press conference. The Summary of Economic Projections puts the median funds rate at 4.1 percent at the end of 2026 and again at the end of 2027, with 2026 median real GDP at 2.3 percent, unemployment at 4.1 percent, PCE inflation at 3.7 percent and core PCE at 3.4 percent. A 4.1 percent median sits above the new range. Whether October is the next step is a separate question, taken up in the October decision note. For this cross, the dollar's policy rate is no longer a one-way drag.
The barrel was loud. The krone was not.
Oil is not irrelevant to Norway. September is a bad month in which to learn that. On the EIA series the spot price was $63.00 on 5 January, $126.69 on 31 March, $70.46 on 30 June and $113.96 on 29 September. The premium arrived, bled out, and was bid again. USD/NOK did not trace it. The kroner rates themselves are the ECB concertation fixes Norges Bank republishes.
On the 182 sessions from 5 January through 25 September 2026 when both an ECB USD/NOK reference and an EIA Brent print exist, the correlation of daily percent changes is about -0.07. That number is my calculation from the two files, not a statistic either agency publishes. A pair that was the barrel in disguise would not produce a correlation you can round to zero.
The cumulative picture is what fools people. Brent's 81 percent rise from early January did coincide with a stronger krone on I-44. The response is small, and June and September both went the wrong way for anyone using the sign of the oil change as the model. Bache's account allows both facts: since June, oil and gas prices have risen, and a krone stronger than the June forecast pulls the other way on inflation. Neither fact turns USD/NOK into Brent.
The test, if the oil link comes back before year-end, is EUR/NOK rather than USD/NOK. The euro cross bottomed at 10.6975 on 9 September and was 10.9015 on the reference date. If Brent holds above $110 and EUR/NOK breaks under that September low, the krone is finally collecting the barrel in the cross that does not contain the dollar. One headline, on its own, is not that evidence.
Where 9.6006 can go by 31 December
Three levels, one horizon, weights that are mine. They are not option-implied odds and not a price from a futures market. The anchor is the 30 September reference at 9.6006. The horizon is 31 December 2026.
RelatedUSD/DKK Forecast: 6.85 Bull Case vs 6.40 Bear Case
The base case is 9.80, about 2.1 percent above the reference and a bit less than September's 2.8 percent gain. It assumes the dollar stays firm without repeating March or June, and that the krone's oil cushion keeps USD/NOK rising by less than USD/SEK. Weight: 45 percent. December sits in the high 9s, above the reference and below the round number that has not traded since January.
The bull case is 10.25, a retest of the 25 November 2025 high at 10.2571. The last reference at or above 10 was 10.0847 on 19 January. It needs another strong dollar month or a krone slip that matches SEK, with the policy gap stuck at half a point. Weight: 30 percent. The directional lean, not the central path.
The bear case is 9.17. That is through the 9 September low of 9.1808 and onto the 13 May low of 9.169. It needs the oil beta in EUR/NOK, a dollar basket that hands back September, or a 5 November hike in Oslo that the Fed does not match. Weight: 25 percent.
Weight those three, 45, 30 and 25, and the average is about 9.78. The level that kills the lean is 9.17. A reference back through the May low means the September dollar story was a completed move, and 10.25 is the wrong map.
What would change the weights is concrete. Brent above $110 with EUR/NOK under 10.6975 would raise the bear weight. A dollar basket back through 99.55 would cut the bull weight, as would a 5 November hike in Oslo, unmatched by the Fed, if USD/NOK then failed to hold 9.60. A basket that holds 101, with the krone still lagging SEK, is how 10.25 stops being a tail.
None of these levels is an instruction to transact. They are the map I would throw away if the conditions above print.
Questions the desk keeps getting
Is USD/NOK just an oil pair?
No. In June 2026 Brent fell 28 percent and USD/NOK rose 7.3 percent from the May month-end reference to 30 June. In September Brent rose 27 percent and USD/NOK rose 2.8 percent. Daily percent changes in the two series correlated at about -0.07 across 182 overlapping sessions from January to 25 September. The krone can firm in a year of expensive oil, as it has in 2026, without the cross becoming the barrel.
What rate and date is the spot anchor?
9.6006 kroner per dollar on 30 September 2026. That is the ECB reference rate at the 14:15 CET concertation, the figure Norges Bank republishes and the figure frankfurter.dev returned for that date. It is not a live interbank quote from 1 October, and it is not a futures price. Bull levels in this piece sit above 9.6006. The bear level sits below it.
Why did the September hike not strengthen the krone against the dollar?
Because the Fed hiked too. Norway went from 4.25 to 4.50 percent. The Fed's target range went to 3.75 to 4 percent. The gap between Norway's policy rate and the top of the Fed range stayed at half a percentage point. The USD/NOK reference was 9.492 on 24 September, the morning of the Norwegian announcement, and 9.6006 on 30 September.
What is the difference between this and the EUR/NOK page?
EUR/NOK rose 0.6 percent from 31 August to 30 September. USD/NOK rose 2.8 percent. The gap is the dollar. The 19 September EUR/NOK piece is about the euro against the krone, including oil's role in that cross. This one asks what happened when you put the dollar on the other side, and the answer is that the dollar, not Brent, set the month.
What invalidates the bull case?
A move through 9.17, which is the 13 May low and a break of the 9 September low at 9.1808. The fundamental version of that break is an oil bid that finally appears in EUR/NOK, under 10.6975, or a dollar basket that falls back through its 31 August level of 99.55. Either one, and 10.25 is the wrong destination for 31 December.
When is the next Norges Bank decision?
5 November 2026. The committee has said it is prepared to raise the policy rate further if inflation requires it, and that the rate is likely to stay elevated for a time. Bache also said she would not treat the outlook as fixed. The Fed's median projection, separately, is a 4.1 percent funds rate at the end of 2026. Both dates sit inside this forecast's horizon.
This is analysis, not a recommendation to take a position. The bull, base and bear figures are scenarios around the 30 September 2026 reference rate. Foreign exchange moves, and you can lose money.