

Microsoft reported net income of $133.7 billion for the fiscal year to 30 June 2026, the largest annual profit in its history and 31% above the prior year. Over those same twelve months, the cash it had left after paying for infrastructure fell 17%. Both figures sit in the same document, the Form 10-K filed on 29 July 2026, and neither is contested.
The market answered the next session. MSFT closed at $390.54 on the day of the release and $451.10 the day after, a 15.5% single-session gain. The stock changed hands at $491.65 on 9 September 2026, 25.0% above where it sat the day before those results, and still 11.2% below the 52-week intraday high of $553.72 set in October 2025. Hold it for a full year and you are down 1.4%.
What actually changed in fiscal 2026 is neither the profit nor the capital expenditure line that every headline quotes. It is a crossing. Operating cash flow came in at $182.9 billion. Additions to property and equipment consumed $115.9 billion of it, and a further $24.6 billion of datacentre capacity arrived as finance leases, which never touch the investing section of the cash flow statement at all. That leaves $42.4 billion. Microsoft paid out $48.7 billion in dividends and buybacks. For the first time in at least three fiscal years, the company handed shareholders more cash than it generated after fully funding its own build-out. The ratio was 63% in FY2024, 83% in FY2025 and 115% in FY2026.
Key facts
- FY2026 revenue $331.8 billion, up 18%; operating income $155.2 billion, up 21% — Microsoft Q4 FY26 earnings release, 29 July 2026
- Additions to property and equipment $115.9 billion, up 79.6% from $64.6 billion; finance-lease right-of-use assets obtained $24.6 billion — FY2026 Form 10-K, 29 July 2026
- Commercial remaining performance obligation $678 billion, up 84%, weighted average duration approximately 2.3 years, with roughly 30% expected to convert within twelve months — FY2026 Form 10-K
- Contractual obligations due in fiscal 2027 total $241.9 billion against FY2026 operating cash flow of $182.9 billion — FY2026 Form 10-K, contractual obligations table
- Azure revenue reached $101.9 billion in FY2026 on restated definitions, growing 40% for the year — Microsoft FY27 Segments and Investor Metrics, 2 September 2026
- Guided fiscal Q1 2027 capital expenditure of "over $50 billion including the impact of the useful life update" — outlook given 29 July 2026, restated 2 September 2026
- Spot $491.65, market capitalisation approximately $3.65 trillion on 7,427 million shares outstanding — stockanalysis.com close, 9 September 2026
The cash spine, three years deep
Profit and cash have been diverging at Microsoft for three consecutive years, and the gap widens each time.
| $ millions, fiscal year to 30 June | FY2024 | FY2025 | FY2026 |
|---|---|---|---|
| Net cash from operations | 118,548 | 136,162 | 182,935 |
| Additions to property and equipment | (44,477) | (64,551) | (115,948) |
| Finance-lease assets obtained | (11,633) | (20,511) | (24,608) |
| Cash after all infrastructure | 62,438 | 51,100 | 42,379 |
| Buybacks and dividends paid | (39,025) | (42,502) | (48,716) |
| Payout as a share of that cash | 63% | 83% | 115% |
Source: Microsoft FY2026 Form 10-K, cash flow statements and Note 13 (Leases), filed 29 July 2026.
Two details in that table repay attention. The finance-lease row is the one most models drop. Microsoft's own supplemental lease disclosure shows $24.6 billion of right-of-use assets obtained in exchange for finance-lease obligations during FY2026, and finance-lease cost of $7.95 billion for the year against $4.83 billion the year before. Gross property and equipment held under finance leases stands at $82.7 billion, up from $53.9 billion. That capacity is real, it is being depreciated, and the cash for it leaves through the financing section, not the investing one.
The second detail is the buyback arithmetic. Microsoft spent $16.7 billion under its repurchase programme in FY2026 and retired 36 million shares while issuing 29 million. The share count went from 7,434 million to 7,427 million: a reduction of 0.09%. Stock-based compensation ran at $12.4 billion. Anyone modelling buybacks as a per-share tailwind at this company is modelling something that is not happening.
Cash and short-term investments fell to $76.8 billion from $94.6 billion. There is no distress in that, but there is direction.
The backlog is the bull case, and it is enormous
Set the cash statement aside for a moment, because the balance of evidence on the other side is genuinely powerful. Commercial remaining performance obligation ended the year at $678 billion, up 84%. Total company RPO was $684 billion. Microsoft states a weighted average duration of approximately 2.3 years and expects to recognise about 30% of it within twelve months, which is roughly $203 billion of contracted commercial revenue already sitting under fiscal 2027.
That is contracted, not forecast. It is the single strongest number in the filing.
"This year, Azure revenue surpassed $100 billion for the first time, and Microsoft 365 Copilot reached over 30 million paid seats, reflecting the confidence customers are placing in us to power their AI transformation," said Satya Nadella, chairman and chief executive officer of Microsoft, in the fourth-quarter earnings release. Amy Hood, executive vice president and chief financial officer, put the quarter's cloud figure at "$59.3 billion, up 27% year-over-year" in the same document.
Guidance for the September quarter, issued on 29 July and mechanically restated on 2 September, calls for revenue of $89.85 billion to $90.95 billion, cost of revenue of $29.6 billion to $29.8 billion and operating expenses of $16.8 billion to $16.9 billion. At the midpoint that implies operating income of about $43.9 billion and a margin of 48.5%, against 48.9% in the year-ago quarter. Azure is guided to grow 44% to 45% in constant currency. Revenue growth at the midpoint runs at 16.4%.
A company decelerating from 18% to 16% while its backlog grows 84% is not a company running out of demand.
Where the money is already committed
The contractual obligations table is where the FY2026 filing stops being comfortable. Microsoft discloses $743.8 billion of total contractual obligations at 30 June 2026. Long-term debt principal accounts for $46.1 billion of that. Operating and finance leases, including imputed interest, account for $443.5 billion. Purchase commitments, which Microsoft says relate primarily to datacentres, account for $194.1 billion. Construction commitments add $34.6 billion.
Of that total, $241.9 billion falls due in fiscal 2027 alone — $169.0 billion of it purchase commitments. Fiscal 2026 operating cash flow was $182.9 billion.
The gap is not a solvency question. Microsoft has an AAA-grade balance sheet, $442.4 billion of equity and trivial net debt, and purchase commitments convert into cost of revenue rather than arriving as a single bill. It is a flexibility question. A firm with $241.9 billion of contracted outflows in the coming year and a guided capital budget of over $50 billion for the first quarter has pre-committed most of its optionality, and the September dividend declaration is the visible test of that. Microsoft raised the quarterly rate to $0.91 on 15 September 2025 and to $0.83 on 16 September 2024. The FY2027 declaration is due within days of publication.
Microsoft names the risk itself in the FY2026 10-K: "Overestimation of demand or misalignment of capacity investments may result in underutilization of infrastructure and may lead to impairment of assets on our balance sheet."
One year of price, and what the multiple assumes
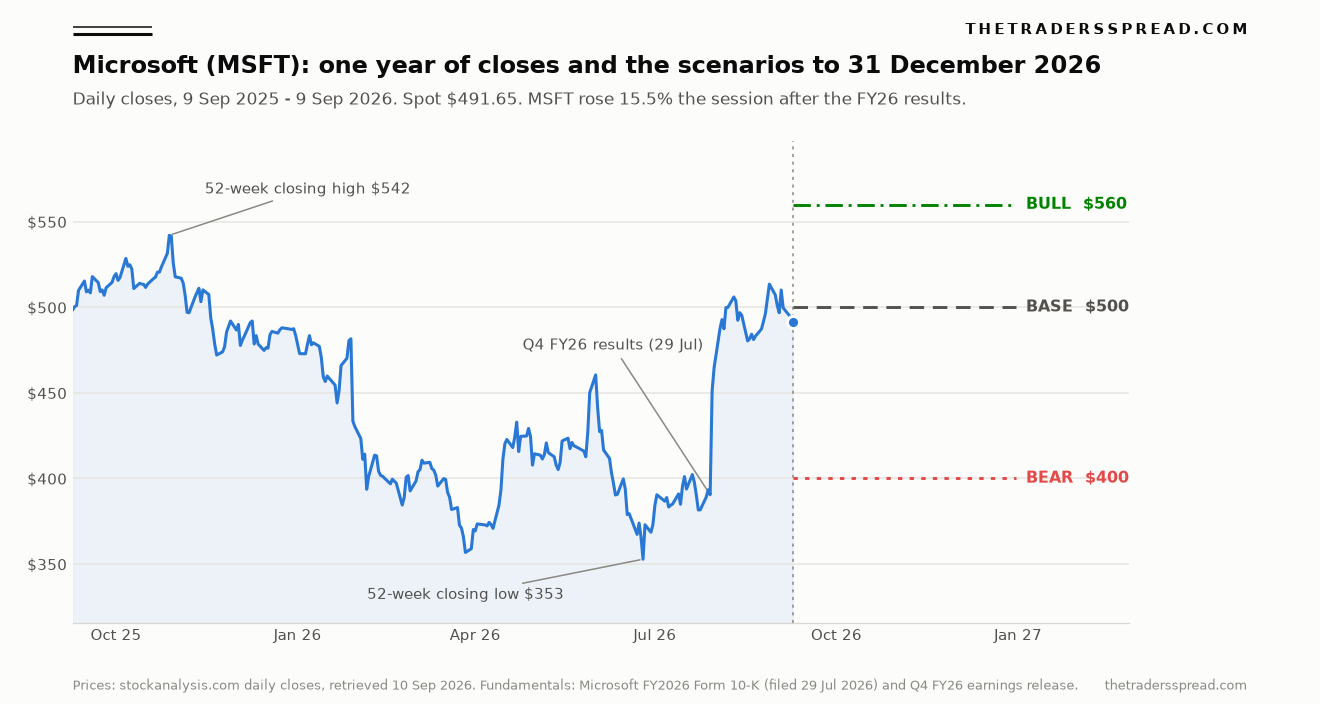
The shape of that year matters more than the endpoints. MSFT closed at $542.07 on 28 October 2025, its highest close of the period, then ground down to $352.83 on 25 June 2026, a fall of 34.9%. From that low it has recovered 39.3%. The 3-month return is +23.7% measured from the $397.36 close on 10 June 2026; the 6-month return is +21.4% from $404.88 on 11 March 2026; year-to-date the stock is up 1.66% from the $483.62 close on 31 December 2025. Every one of those windows is anchored to a stated trading date because the story changes completely depending on which one you pick.
Against peers, the capital intensity picture is not what the "Microsoft is overspending" framing suggests.
| Company | Period | Operating cash flow ($m) | Capital expenditure ($m) | Capex / OCF |
|---|---|---|---|---|
| Microsoft | FY to 30 Jun 2026 | 182,935 | 115,948 | 63.4% |
| Microsoft, incl. finance leases | FY to 30 Jun 2026 | 182,935 | 140,556 | 76.8% |
| Alphabet | 6m to 30 Jun 2026 | 84,859 | 80,598 | 95.0% |
| Amazon | 6m to 30 Jun 2026 | 71,419 | 98,411 | 137.8% |
| Meta Platforms | 6m to 30 Jun 2026 | 64,088 | 49,113 | 76.6% |
Sources: Microsoft FY2026 Form 10-K; Alphabet Form 10-Q filed 23 July 2026; Amazon Form 10-Q filed 31 July 2026; Meta Form 10-Q filed 30 July 2026. XBRL company-concept data retrieved 10 September 2026.
Microsoft is the least capital-hungry of the four relative to the cash it makes, even once finance leases are added back. It is also the only one of the four returning more cash to shareholders than it generates after infrastructure. That combination is the actual position, and it is a different argument from the one usually made about Redmond. Our Alphabet forecast published on 8 September set $395 and $285 against a $338.46 spot, and our Amazon forecast of 4 September set $325 and $198 against $258.90; the Apple piece of 5 September works the same problem from the opposite end, at a company that barely builds anything.
On trailing numbers, $491.65 is 27.4 times FY2026 GAAP earnings of $17.95 and 28.5 times the $17.28 excluding OpenAI marks. Microsoft's investment in OpenAI carried a value of $6.0 billion at 30 June 2026, against $13.0 billion of committed funding of which $11.9 billion has been paid, and contributed $6.5 billion of pre-tax gains in FY2026 largely from the dilution recognised on the October 2025 recapitalisation. That is a real earnings input which nobody should extrapolate.
What the segment reset does to the FY2027 model
On 2 September 2026 Microsoft filed an 8-K announcing that from fiscal 2027 it moves from three reportable segments to two: Agents and Infra, and Devices and Consumer. Nadella's letter in the accompanying deck frames it as transparency. The mechanics are more consequential than the framing.
Azure is redefined. GitHub cloud, other developer cloud services and Security Copilot move out of Azure into Microsoft 365 commercial cloud; Healthcare and Life Sciences cloud moves into a new Industry solutions metric. LinkedIn ceases to exist as a reported line and is split across two different metrics, with Talent and Sales Solutions going to Industry solutions cloud and Marketing Solutions and Premium Subscriptions going to Search and advertising. On the restated basis, Azure grew 40% in FY2026 rather than the 41% reported, and Microsoft 365 commercial cloud grew 18% rather than 17%.
RelatedQualcomm (QCOM) Forecast: $210 Bull Case vs $145 Bear Case
Restated history is provided back through FY2025 only. Agents and Infra carried $268.1 billion of FY2026 revenue at a 50.9% operating margin; Devices and Consumer carried $63.7 billion at 29.6%. Anyone whose model runs off a longer Azure series has a comparability break arriving with the October quarter, and the market has historically mispriced companies for a quarter or two around exactly this kind of reset.
The call
Spot is $491.65 as at the 9 September 2026 close. Realised volatility over the last 90 sessions annualises at 39.0%, which over the 78 trading days to 31 December 2026 gives a one-standard-deviation move of roughly 21.7%. All three cases below run off a FY2027 earnings build, not a chart pattern.
Base, $500 (+1.7%). Revenue grows 15% to about $382 billion, operating margin slips to 46.3% from 46.8% as depreciation on $313 billion of net property and equipment catches up, tax runs at the guided 20% and diluted share count barely moves. That gives roughly $18.95 of FY2027 earnings per share, and $500 is 26.4 times it. Probability of finishing between $400 and $500: 36.0%.
Bull, $560 (+13.9%). Azure holds above 40% growth through the year, the Copilot seat base compounds off 30 million, revenue grows 18% and margin recovers to 47.3% as the useful-life update flatters depreciation. That is about $19.90 in FY2027 earnings, and $560 is 28.1 times it, a modest re-rating rather than a heroic one. Probability of closing above $560 on 31 December: 27.4%. Probability of touching $560 at any point: 54.9%.
Bear, $400 (-18.6%). Revenue growth decelerates to 12%, margin compresses to 43.8% as the FY2027 capital budget of over $200 billion annualised begins depreciating, and the multiple contracts to 22.9 times a reduced $17.44. Probability of closing below $400: 17.1%. Probability of trading down to $400 at some point before year-end: 34.2%. The 25 June low of $352.83 is 28.2% below spot and carries a 12.6% touch probability.
What would change my mind: a fiscal Q1 print on or near 29 October showing Azure below 40% constant-currency growth would break the bull case outright, since the whole re-rating since July rests on that line. In the other direction, a September dividend declaration above $1.00 per quarter, a raise of 10% or more, would signal that management does not view the FY2027 capital budget as a constraint on returns, and would push the base case toward the bull. A commercial RPO print below $650 billion in the October filing would matter more than any single quarter's revenue.
FAQ
Why does Microsoft's free cash flow fall when profit rises?
Because net income is calculated after depreciation on assets already built, while capital expenditure is cash going out for assets not yet earning. Microsoft spent $115.9 billion on property and equipment in FY2026 plus $24.6 billion via finance leases, against $38.5 billion of depreciation and amortisation. The build is running roughly 3.6 times the run-off rate, so cash falls while accounting profit climbs.
What is remaining performance obligation and why is $678 billion significant?
RPO is contracted revenue not yet recognised, covering both deferred amounts and sums that will be invoiced later. Microsoft's commercial RPO grew 84% to $678 billion at 30 June 2026, with a weighted average duration of about 2.3 years and roughly 30% expected to convert within twelve months. It is the closest thing in the filing to a forward order book.
Are Microsoft buybacks reducing the share count?
Barely. In FY2026 the company repurchased 36 million shares under its programme and issued 29 million, leaving shares outstanding at 7,427 million against 7,434 million a year earlier, a 0.09% reduction. Stock-based compensation of $12.4 billion largely offsets the $16.7 billion spent under the programme. Of the $60 billion authorisation approved in September 2024, $40.6 billion remained at 30 June 2026.
How does the FY2027 segment change affect comparisons?
Microsoft moves to two reportable segments from the September 2026 quarter, and Azure, Microsoft 365 commercial cloud and LinkedIn are all redefined in the process. Restated quarterly history is supplied for FY2025 and FY2026 only. Series that run further back will not reconcile, which creates a genuine risk of misread growth rates in the first two quarters of the new structure.
What are the biggest risks to the bull case?
Azure deceleration below 40% is the direct one. Behind it sits the risk Microsoft flags itself: overestimating demand and ending up with underutilised infrastructure that requires impairment. Power availability is a further constraint the 10-K devotes considerable space to, citing capacity limits on electricity generation, transmission and distribution in several regions where Microsoft wants to build.
Disclaimer
This article is analysis and information, not investment advice. The levels, probabilities and earnings estimates above are the author's own work from primary filings and live market data, and they can be wrong. Capital is at risk and past performance does not indicate future results. Anyone acting on this material does so on their own judgement and should consider taking advice from a regulated professional. A fuller picture of the company sits on our Microsoft market page.