

Having lined up every European Central Bank reference fix for CHF/JPY since September 2025 against Tokyo's intervention ledger, I keep landing on the same awkward result: the cross's worst days belong to Japan, but its trend belongs to Switzerland. Friday's close, the ECB fix dated 25 September 2026, put the franc at 190.26 yen. The Swiss National Bank's own reference on its homepage, 0.5241 francs per 100 yen for the same day, works out to roughly 190.80. Both sit 6.7% below the 204.03 peak of 21 April. Most readers will assume the yen did that. The Bank of Japan has now raised rates twice in just over three months, and the Ministry of Finance has spent more than ¥27 trillion defending its currency since the end of April. The yen is the obvious suspect. It is mostly innocent.
Split the move into its two dollar legs and the answer is lopsided. From 21 April to 25 September, USD/JPY slipped just 0.91%, while USD/CHF rose 6.26%. Roughly nine-tenths of the fall in CHF/JPY came from a weaker franc, not a stronger yen. That matters for anyone building a year-end view, because the two legs are governed by opposite reflexes. Tokyo has shown, with its own money, that it will lean against yen weakness around 160 per dollar. Berne has said in writing that it is comfortable with franc weakness and stands ready to intervene only in the other direction. One leg has a floor under it; the other has a ceiling over it. CHF/JPY is the rare yen cross where the carry now runs against the franc, too: the BoJ's 1.25% call-rate target beats the SNB's 0% by a full 125 basis points.
Key facts
- CHF/JPY closed Friday at 190.26 on the ECB reference fix, dated 25 September 2026 — frankfurter.dev, ECB data
- The one-year range runs from 184.16 (1 October 2025) to 204.03 (21 April 2026); the cross is 1.77% higher over twelve months and 6.75% below the peak — ECB reference series, computed from daily fixes
- The Bank of Japan raised its call-rate target from 1.0% to 1.25% on 18 September by a 7-2 vote, effective 24 September — BoJ statement, 18 September 2026
- The SNB held its policy rate at 0% on 24 September; Swiss CPI inflation was 0.8% in August — SNB press release, 24 September 2026
- Japan's Ministry of Finance intervened for ¥11,734.9 billion in April to June 2026 and ¥15,399.3 billion between 30 July and 26 August — MoF intervention record
- The franc fell by around 3% on a trade-weighted basis between the June and September SNB assessments — SNB introductory remarks, 24 September 2026
- One-year realised volatility of the cross, from daily log returns, is 7.0% annualised — ECB reference series, computed 27 September 2026
A yen cross where the yen pays more
For most of the past two decades, the franc and the yen were the two cheapest currencies on earth to borrow. Traders funded positions in both, and when risk appetite collapsed both were bought back together. That shared role is why CHF/JPY used to trade like a sleepy, low-beta cross: two havens priced against each other.
The rate structure no longer looks like that. The Bank of Japan's 16 June decision took the uncollateralised overnight call rate target to around 1.0%. The 18 September decision took it to 1.25%, effective 24 September, and the statement said the Bank "will continue to raise the policy interest rate and adjust the degree of monetary accommodation." Two board members, Asada Toichiro and Sato Ayano, dissented in favour of holding.
In Berne and Zurich the SNB did nothing, and said so plainly. Its policy rate stays at 0%, sight deposits above a threshold are still remunerated at a 0.25 percentage point discount, and the conditional inflation forecast assumes 0% over the whole horizon to 2028. The SNB homepage showed SARON, the Swiss overnight benchmark, at minus 0.04% on 24 September.
Put those next to each other and the familiar carry logic inverts. Holding francs funded in yen now costs something like 1.25 to 1.3 percentage points a year in short-rate terms. Over a three-month horizon that is about 0.3%, which is small beside a cross that moves 7% a year on realised volatility. Carry is not what drives this pair. It does, however, remove one of the old supports for the franc side: nobody is paid to wait.
Where the 6.7% actually came from
Because CHF/JPY is simply USD/JPY divided by USD/CHF, each move can be attributed. The table uses ECB reference fixes for all three rates on the same dates, which avoids mixing timestamps.
| Window (ECB fixes) | CHF/JPY | USD/JPY | USD/CHF | Main driver |
|---|---|---|---|---|
| 25 Sep 2025 to 25 Sep 2026 | +1.77% | +5.89% | +4.06% | Both weaker against USD, yen more so |
| 21 Apr 2026 (peak) to 25 Sep 2026 | -6.75% | -0.91% | +6.26% | Franc weakness |
| 25 Jun 2026 to 25 Sep 2026 | -4.41% | -2.63% | +1.86% | Split, yen slightly larger |
| 1 Sep 2026 to 17 Sep 2026 | -4.44% | -2.79% | +1.72% | Yen rally plus franc slide |
A rising USD/CHF means a weaker franc, which pushes CHF/JPY down. Each leg has its own forecast on this desk: see our USD/JPY forecast for the yen side and our USD/CHF forecast for the franc side. Source: ECB reference rates via frankfurter.dev, pulled 27 September 2026. The ECB fixes at 14:15 CET and publishes nothing on weekends or TARGET holidays, so 1 May is missing from every series.
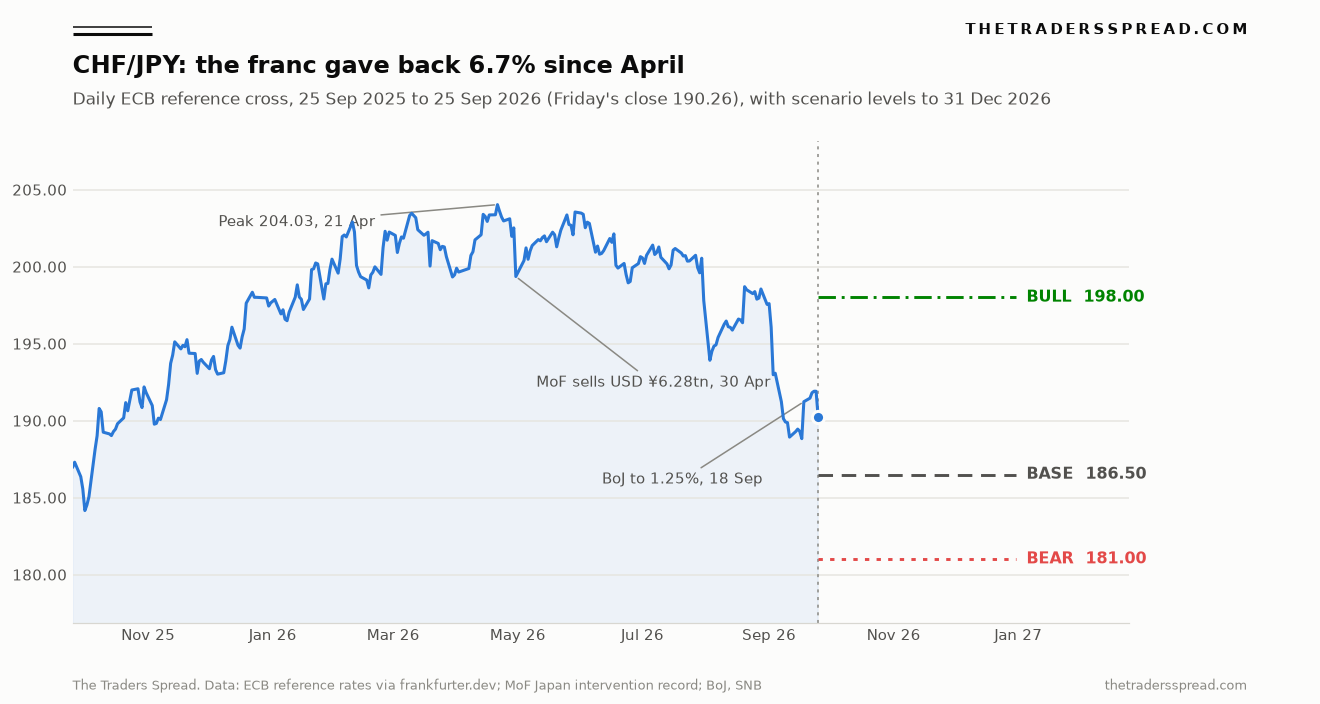
The chart shows the shape. A steady climb from the 184.16 low of 1 October 2025 carried the franc through 200 yen in late January. It spent April to July in a 199 to 204 band, then broke down in two steps, one in early August and one in early September.
The daily ranking tells you who does the damage on the day. Over the past year the four largest one-day falls in the cross were:
- 3 August 2026: -1.96%, inside the 30 July to 26 August window in which the MoF reports ¥15,399.3 billion of intervention
- 3 September 2026: -1.58%, as USD/JPY fell 2.25% on the fix; no intervention figure for this date has been published yet
- 30 April 2026: -1.56%, the day the MoF sold dollars for yen to the tune of ¥6,278.7 billion
- 31 July 2026: -1.37%, again inside the July to August intervention window
Only 30 April is a confirmed intervention day. The monthly release of 28 August gives a total, not a daily split. The daily split for July to September arrives with the quarterly release in November, and whatever happened on 3 September falls into the next monthly figure. Still, the pattern is hard to miss. The sharpest drops cluster where Tokyo was active, while the persistent grind lower between them came from the other leg. The largest one-day gain in the past eleven months was the day of the BoJ hike itself, 18 September, when the cross rose 1.27% as USD/JPY jumped 1.41%.
Tokyo guards one leg, Berne leaves the other open
The MoF's second-quarter release lists three operations: ¥6,278.7 billion on 30 April, ¥780.2 billion on 4 May and ¥4,675.9 billion on 6 May, all dollars sold for yen. Add the ¥15,399.3 billion from 30 July to 26 August and the government has put roughly ¥27.1 trillion into the market since April. USD/JPY fixed at 163.91 on 28 July, just before the second wave began, and has not fixed above 160.24 since 31 July. That is not a peg. It is a demonstrated reaction function, and it matters for CHF/JPY because it caps how far yen weakness can carry the cross higher.
The franc side has the opposite asymmetry. At the 24 September news conference, Martin Schlegel, Chairman of the Governing Board at the Swiss National Bank, described the recent slide without a trace of alarm: "Since our last assessment, the Swiss franc has depreciated by around 3% on a trade-weighted basis. This depreciation was in line with the widening of interest rate differentials between the major currency areas and Switzerland." He added that Swiss longer-term rates "have not increased as strongly as in the major currency areas." The same remarks note that key rates were raised in both the euro area and the US.
Petra Tschudin, Member of the Governing Board at the Swiss National Bank, went further on the growth side in the same session, saying that "our monetary policy and the recent depreciation of the Swiss franc are having a supportive effect." A central bank that calls the weakness of its own currency supportive is not about to fight it. The SNB's standing line, that it is "willing to intervene in the foreign exchange market as necessary," has historically meant selling francs when the currency is too strong. With inflation at 0.8% and a forecast of 0.8% for 2027 and 2028, well inside the 0% to 2% band it equates with price stability, there is no domestic reason to lean against a softer franc. Our EUR/CHF forecast looks at how far that tolerance stretches against the euro.
So the structure looks like this. A weaker yen pushes CHF/JPY up, and that path has a government willing to spend tens of trillions to block it. A weaker franc pushes CHF/JPY down, and that path has a central bank publicly describing it as helpful. Neither guarantees direction. Together they tilt the distribution.
What the consensus misses about the BoJ hike
If the BoJ is hiking and the SNB is not, the simple read is that the yen should strengthen across the board. The market did not trade it that way on the day. The cross rose on 18 September, and USD/JPY climbed from 155.69 to 157.89 on consecutive fixes. The 7-2 vote, with both dissenters arguing that CPI was still below 2% and that nothing had accelerated, read as a signal that the next move would not come quickly.
That is where CHF/JPY differs from dollar-yen. The rate gap between Tokyo and Washington remains wide even after two hikes, so USD/JPY is still dominated by the US side and by the MoF. Against the franc, every 25 basis points from the BoJ widens a differential that already favours the yen. The next BoJ meeting runs on 29 and 30 October, with a fresh Outlook Report, and the Summary of Opinions from the September meeting is scheduled for Monday 28 September. A third hike in the last quarter of the year is not the base case in this piece, but the forward language leaves the door open.
There is also a precedent the board itself keeps citing. Takata Hajime, Member of the Policy Board at the Bank of Japan, told an audience in Sapporo on 2 September: "Although the Bank of Japan raised its interest rate in July 2024, this was immediately followed by market adjustments, driven particularly by the yen's significant appreciation reflecting a slowdown in the pace of employment growth in the United States." In that episode the yen gained against almost everything, the franc included, because both were being bought back as funding currencies. It is a reminder that a sudden global deleveraging can hit CHF/JPY from the yen side even when the franc is also bid.
Where this lean breaks
Three things would push me off the bear side.
First, a Middle East escalation severe enough to trigger a haven scramble. The SNB's own baseline names the region as the main risk and warns that energy prices "could turn out to be significantly higher than expected." An oil shock of that size would hit Japan's import bill and terms of trade harder than Switzerland's, whose inflation starts from 0.8%. My reading is that such a scenario lifts CHF/JPY rather than sinking it, although the July 2024 episode shows the yen can also be bid hard when funding trades unwind.
Second, a policy turn in Berne. If the SNB moved its policy rate off zero, or if Swiss inflation rose fast enough to make the franc's slide unwelcome, the asymmetry described above would disappear. The September forecast shows no sign of that, but the SNB also revised its short-term inflation path higher because of oil.
Third, the MoF stepping back. Tokyo has intervened in two separate waves this year. If USD/JPY pushed through 160 and the government chose not to act, yen weakness would resume without a ceiling, and CHF/JPY would follow it upward. The monthly figure due at the end of September, covering 27 August onward, is the first place to check whether the 3 September drop was an operation.
A fourth, smaller risk: carry trades are cumulative. If the BoJ pauses until 2027 and global yields keep rising, the yen could weaken on differentials alone. That is closer to the path the pair took from October 2025 to April 2026, when the cross gained almost 11%.
The call: CHF/JPY to 31 December 2026
Reference spot is 190.26, the ECB fix dated Friday 25 September 2026. Horizon is 31 December 2026. At 7.0% annualised realised volatility, a one-standard-deviation move over the roughly 66 trading days to year-end is about 3.6%, so the levels below sit at or slightly beyond one sigma on either side.
RelatedAUD/CHF Forecast: 0.6120 Bull Case vs 0.5480 Bear Case
| Scenario | Level | Distance from 190.26 | Side of spot | Probability |
|---|---|---|---|---|
| Bull | 198.00 | +4.07% | Above | 20% |
| Base | 186.50 | -1.98% | Below | 50% |
| Bear | 181.00 | -4.87% | Below | 30% |
| Invalidation of the lean | 196.00 | +3.02% | Above | n/a |
Base case, 186.50. The franc keeps drifting with rate differentials, as Schlegel described, while the yen holds roughly where it is against the dollar because the MoF caps weakness and the BoJ does not hike again before December. The cross grinds back toward the 1 October 2025 low of 184.16 without reaching it.
Bear case, 181.00. A third BoJ hike on 30 October or in December, or another confirmed wave of MoF selling, coincides with continued franc softness. That puts the cross through its one-year low and back to levels last seen in the late summer of 2025.
Bull case, 198.00. A haven bid for the franc from a Middle East shock, or Tokyo standing aside as USD/JPY breaks 160, takes the cross back into the late-August range. The 28 August fix was 198.55.
Bias is bearish with conviction 2 of 5. The asymmetry between the two central banks is real and documented, but the cross has only 7% volatility and one confirmed driver, the MoF, publishes with a lag.
What would change my mind: a daily fix above 196.00, which would mean the August breakdown has been retraced by more than half, or any SNB language treating franc weakness as a problem.
CHF/JPY forecast: frequently asked questions
What was the CHF/JPY rate at Friday's close?
The ECB reference fix dated 25 September 2026 put CHF/JPY at 190.26. The Swiss National Bank's own reference for the same day, 0.5241 francs per 100 yen, implies about 190.80. FX markets were closed over the weekend of 26 and 27 September, so no newer reference rate exists. Dealer quotes will move from the Asian open on Monday.
Why did CHF/JPY fall from its April peak?
Mostly because the franc weakened. From 21 April to 25 September, USD/CHF rose 6.26% while USD/JPY fell only 0.91%, based on ECB fixes. The SNB attributes the franc's slide to wider interest rate differentials with the major economies. Japan's interventions produced the sharpest single-day drops, but not most of the total move.
Is CHF/JPY still a carry trade?
Not in the traditional direction. The Bank of Japan's target is 1.25% from 24 September and the SNB's is 0%, so the yen now carries the higher short rate. Holding francs against yen costs roughly 1.25 to 1.3 percentage points a year in short-rate terms. That is small next to the cross's 7% annual volatility.
When are the next events that could move CHF/JPY?
The BoJ releases its Summary of Opinions from the September meeting on Monday 28 September. The MoF publishes its next monthly intervention total at the end of September. The BoJ's next policy meeting, with a new Outlook Report, runs on 29 and 30 October, and the SNB's next quarterly assessment falls in December.
Could the SNB intervene to stop the franc weakening?
Nothing in the 24 September communication suggests it wants to. The SNB says it is willing to be active in the FX market "as necessary," but its board described the recent depreciation as supportive for growth. With inflation at 0.8%, inside its 0% to 2% range, there is no stated reason to defend the franc against weakness.
Disclaimer
This article is analysis and opinion, not investment advice or a recommendation to trade any instrument. Forecast levels and probabilities are the author's scenarios and can be wrong. Foreign exchange and CFD trading carries a high risk of loss, and leveraged products can lose more than the initial deposit. Your capital is at risk. For the euro side of the yen story, see our EUR/JPY forecast.