

"Even though this week's consumer price index and producer price index reports were softer than expected, they still imply that the price index we target rose 3.7 percent in the 12 months through June," Lisa D. Cook, a governor of the Board of Governors of the Federal Reserve System, told the Exchequer Club in Washington on 15 July 2026. US PPI, the producer price index for final demand, is one reading. The price index the Federal Reserve targets is another. A prediction-market bucket is a third, and its rule stands apart from both.
The level of the index, a survey median for the next monthly change, and the tenth the contract pays on are three separate objects. Treating the headline monthly print as the settlement rule misreads the book. On 28 October 2026 the live ladder is the October PPI year-over-year event on Polymarket. Links to Polymarket are affiliate links, from which The Traders Spread may earn a commission at no cost to you. Volume was $29,296 and liquidity $9,776, on a gamma record stamped 06:26 UTC.
Updated 28 October 2026
Key facts
- The unadjusted final-demand index, BLS series WPUFD4, was 159.613 in September 2026, against 150.100 in September 2025, a 6.3 percent rise over twelve months (BLS public API, 28 October 2026).
- The seasonally adjusted index, series WPSFD4, moved from 157.662 in August 2026 to 159.780 in September, a 1.3 percent rise. The unadjusted index moved from 157.855 to 159.613, a 1.1 percent rise (BLS public API, 28 October 2026).
- The October contract pays on the unadjusted twelve-month change in final demand, to one decimal, from the Bureau release scheduled for 13 November 2026 at 8:30 Eastern time (Polymarket event rules via the gamma API, 28 October 2026).
- Ten outcome prices on that event summed to 112.5 cents. The 6.8 percent or higher leg was 51 cents, on $14,281 of volume (Polymarket gamma, 06:26 UTC, 28 October 2026).
- Eight of the last 32 unadjusted monthly changes, February 2024 through September 2026, would round into 6.8 percent or higher if repeated off the September index, a 25 percent share (BLS WPUFD4, read 28 October 2026).
- A flat October, a zero monthly change, rounds to 6.1 percent. The median monthly change in that 32-month set, 0.32 percent, lands on 6.4 percent (BLS WPUFD4, 28 October 2026).
What does a US PPI bucket pay on?
A bucket here is one contract inside a monthly ladder. The October ladder has ten legs. Nine of them name a single tenth, from 6.0 percent through 6.7 percent. The bottom leg pays if the published figure is 5.9 percent or lower. The top leg pays if it is 6.8 percent or higher. Only one leg can be right, because the Bureau prints one number.
The rules on the event name the inputs. Settlement uses the percentage change in final demand over the twelve months ending in October 2026, before seasonal adjustment, from the monthly Bureau report. The release is scheduled for 13 November 2026 at 8:30 Eastern time. The figure is taken to one decimal, the precision the news release uses for twelve-month changes. The rules settle on total final demand. The core line, which leaves out food and energy, is a different series in the same release.
That split is where readers lose the contract. PPI inflation, in the sense the ladder uses, is one unadjusted tenth on total final demand, taken before seasonal adjustment. A write-up that leads with the seasonally adjusted change from August to September is describing a different line of the same morning.
We pulled WPUFD4 and WPSFD4 from the Bureau's public API on 28 October 2026. September, August, July, and June of 2026 still carry the preliminary footnote, so those index levels can be revised for up to four months after first publication. October 2025, the base for an October 2026 twelve-month change, carries an empty footnote in that pull. On the adjusted index, September is 159.780 against August at 157.662, a 1.3 percent rise. On the unadjusted index, September is 159.613 against August at 157.855, a 1.1 percent rise, and against September 2025 at 150.100 the twelve-month change is 6.3 percent. The bucket uses that third percentage, after rounding to a tenth.
The Bureau's own account of that morning, posted by @BLS_gov on 15 October 2026, leads with the adjusted monthly rise. The post matters because it is the sentence most people will remember, and it is the sentence the contract sets aside.
PPI for final demand increases 1.3% in September; goods advance 2.6%, services rise 0.8% #BLSData https://t.co/mlxKsfD8uz
— BLS-Labor Statistics (@BLS_gov) October 15, 2026
Consumer prices settle on their own habits, which is why the US CPI settlement piece is a different page. A CPI bucket and a PPI bucket can share a calendar morning and still pay on different indexes and different tenths. Governor Cook folded the producer-price report into a judgment about the consumption index the Committee targets, then quoted a twelve-month change through June. The October ladder pays when the final-demand release prints one unadjusted tenth.
How wide is one tenth on the final-demand index?
The October twelve-month change divides the new index by the October 2025 level, 150.439 on WPUFD4. One tenth of a percent on that base is about 0.150 index points, which is the width of each interior leg from 6.0 percent through 6.7 percent. Round half up, so 6.15 becomes 6.2 and 6.14 stays in the 6.1 bucket. The upper edge of one row opens the next. A print on an edge rounds into the higher tenth.
| Bucket | October index | Month change from 159.613 | Outcome price | Share of 32 months |
|---|---|---|---|---|
| 5.9% or lower | below 159.390 | below −0.140% | 2.6 cents | 9.4% |
| 6.0% | 159.390 to 159.541 | −0.140% to −0.045% | 3.0 cents | 0.0% |
| 6.1% | 159.541 to 159.691 | −0.045% to +0.049% | 2.7 cents | 9.4% |
| 6.2% | 159.691 to 159.841 | +0.049% to +0.143% | 19.5 cents | 18.8% |
| 6.3% | 159.841 to 159.992 | +0.143% to +0.237% | 4.0 cents | 6.3% |
| 6.4% | 159.992 to 160.142 | +0.237% to +0.332% | 7.2 cents | 6.3% |
| 6.5% | 160.142 to 160.293 | +0.332% to +0.426% | 9.5 cents | 12.5% |
| 6.6% | 160.293 to 160.443 | +0.426% to +0.520% | 5.1 cents | 6.3% |
| 6.7% | 160.443 to 160.594 | +0.520% to +0.614% | 8.0 cents | 6.3% |
| 6.8% or higher | 160.594 and above | +0.614% and above | 51.0 cents | 25.0% |
The September unadjusted index is already 159.613. An October index that stays there, a zero change on the month, divides by 150.439 to give 6.098 percent, which rounds to 6.1. The 6.1 percent leg is the flat month. It was priced at 2.65 cents, shown as 2.7 cents in the table. Reaching 6.8 percent from that flat reading takes an unadjusted monthly rise of 0.614 percent or more, and an October index of 160.594 or higher.
October 2025 rose 0.226 percent, from 150.100 to 150.439. Repeat that pace and the October 2026 index is 159.973, a twelve-month rate of 6.338 percent, which rounds to 6.3, the same tenth as September. September's own unadjusted rise was 1.114 percent. Repeat that and the index is 161.391, the rate is 7.28 percent, and the rounded tenth is 7.3, inside the open top bucket. A 6.8, a 7.3, and an 8.0 all pay that one leg. An interior tenth pays only inside a window of about 0.15 points. The monthly unemployment-rate piece builds a ladder the same way, one published tenth at a time, on a rate rather than a price index.
Where does a forecast sit next to the bucket?
A consensus estimate, when a survey desk publishes one, is usually a median forecast for the seasonally adjusted change from the prior month, and sometimes a twelve-month rate as well. Either number can matter to a rates trader. The bucket is a further number, on a different line of the release. Seasonal adjustment moves mass between months so a typical January can be compared with a typical July. The contract wants the comparison before that reshuffle, over twelve months, at one decimal. A forecaster who nails the adjusted month can still miss the tenth, if the seasonal factor and the rounding fall the other way. Naming the twelve-month rate to one decimal names the winning leg, whatever the monthly headline was.
A named October survey median, with a count of respondents, was absent from the pages we reached on 28 October 2026, so the survey cell stays empty on purpose. The object still has a shape. It is a number published before the bell, aimed at the line a wire will lead with. The bucket is the unadjusted twelve-month change further down the release, after rounding. Governor Cook's July speech is the policy reading of that morning. She treated a softer producer-price report as one input to the consumption price index, and she quoted 3.7 percent through June. Core PCE buckets track that consumption gauge. The Core PCE bucket page is the place for it. Payrolls, counted in the establishment survey, are a different morning again, and the nonfarm payrolls bucket page goes through that count.
What is the October ladder worth against the last 32 months?
The fair value on the chart is a base rate with the October arithmetic bolted on. Take each unadjusted month-to-month change in WPUFD4 from February 2024 through September 2026, thirty-two changes. Apply that change to the September 2026 index of 159.613, divide by the October 2025 index of 150.439, round to one decimal, and count the winners. The share is the orange bar.
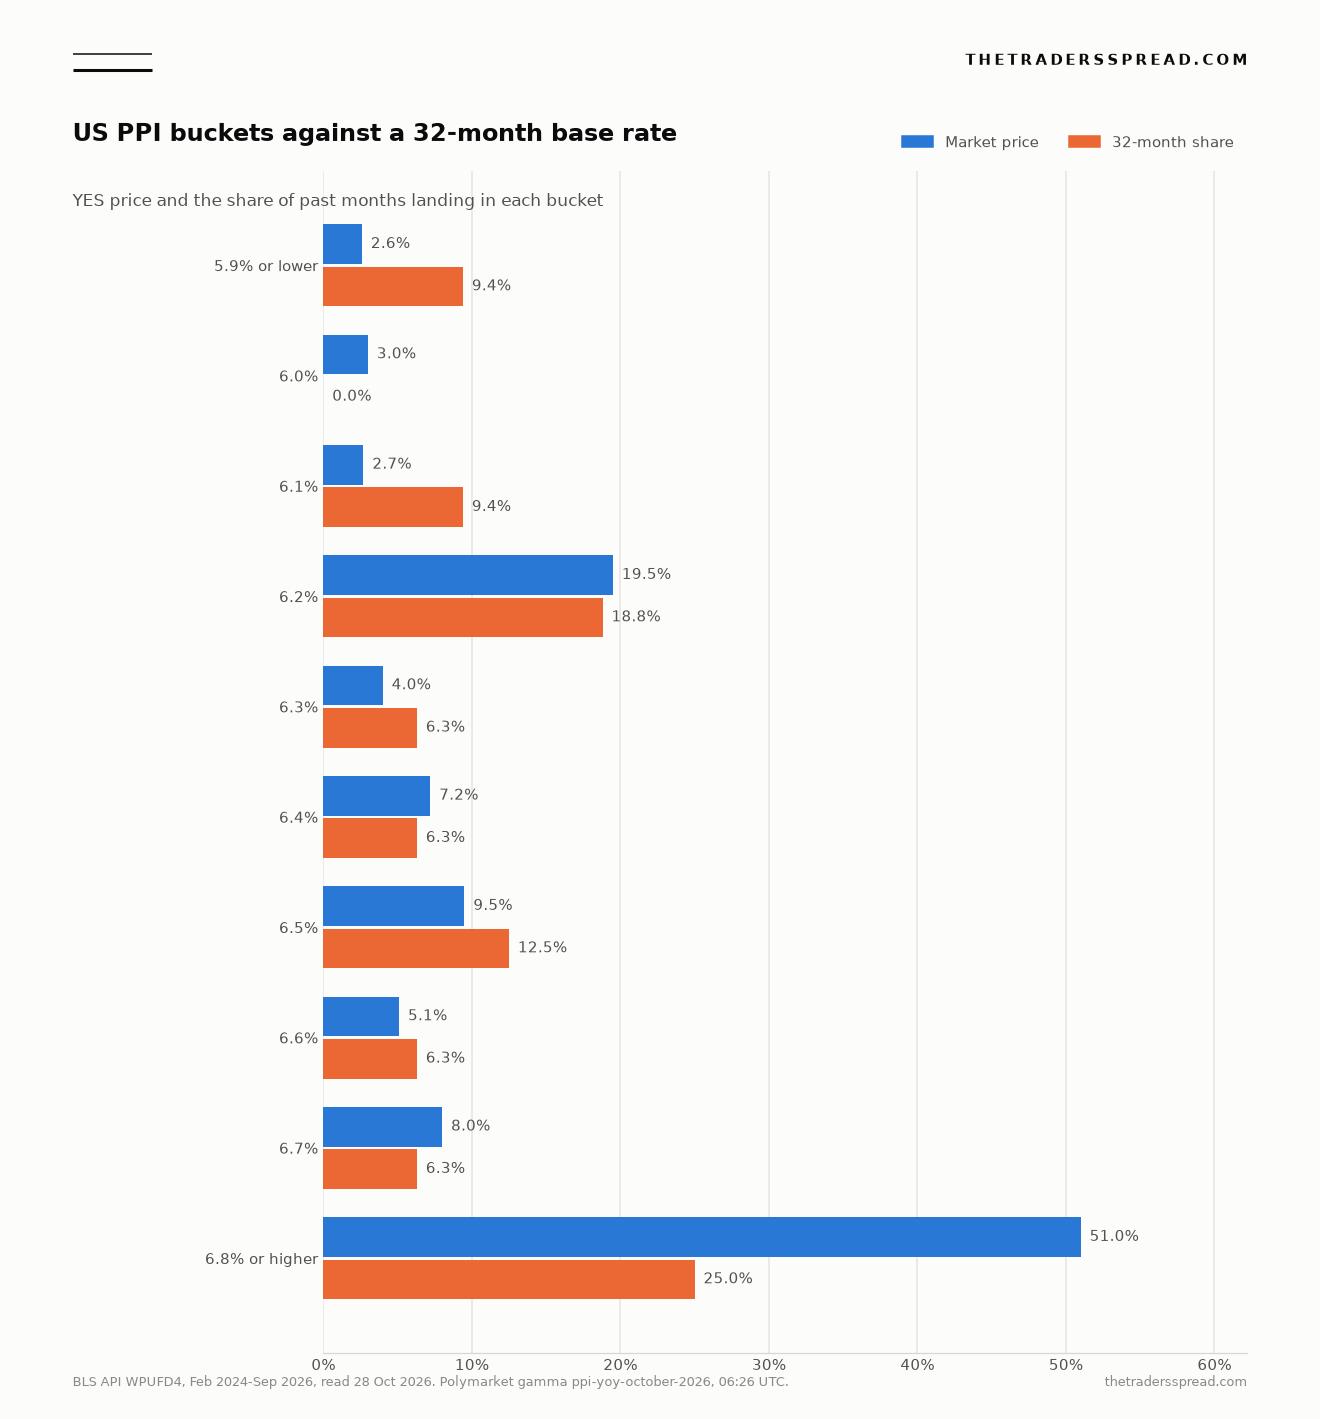
Three of the thirty-two months land on 5.9 percent or lower, a 9.4 percent share. The 6.0 percent bucket draws a count of zero. Three land on 6.1, six on 6.2, two on 6.3, two on 6.4, four on 6.5, two on 6.6, two on 6.7, and eight on 6.8 percent or higher. The median change, 0.32 percent, rounds to 6.4. The mean, 0.36 percent, rounds to 6.5.
RelatedWhat moves the price of US nonfarm payrolls buckets?
The screen on 28 October was a different shape at the top. The 6.8 percent or higher leg was 51 cents, bid 50 and offered at 52, last trade 46, on $14,281 of volume, about half the event. The 6.2 percent leg was 19.45 cents, bid 18.6 and offered at 20.3, close to its 18.8 percent share. The 6.5 percent leg was quoted 4 cents bid and 15 cents offered, outcome price 9.5 cents, against a 12.5 percent share. A wide quote is a thin book, and reading it as a sharp probability overstates the agreement.
Sum the ten prices and the total is 112.5 cents. A full set of outcome tokens on a one-winner ladder would cost about a dollar if the quotes were one distribution. The extra 12.5 cents is the gap between ten books and one distribution, and it is widest at the top, 51 cents against a 25 percent share. Of the nine monthly changes in 2026 alone, five would land in that top bucket, a 56 percent share, close to the 51 cent price. Nine months are a thin sample, since one quiet month moves the share by about 11 points. We keep the thirty-two-month count as the chart's fair value, and we state the 2026 count beside it so 25 percent has a neighbour.
The leg listed first is 5.9 percent or lower, at 2.6 cents, bid 0.2 and offered at 5. The 5.9 percent or lower bucket wins on three of the thirty-two months, a 9.4 percent share, and the price sits about seven points under it. Our fair value on that leg is 0.094. The contract panel reads the first leg returned for the event, so the stored fair value is the fair value of that bottom leg, with the market price under it.
The open top carries the volume. The 6.8 percent or higher bucket at 51 cents is the price furthest above its 32-month share. A reader who prefers the 2026 window will find that same price close to the share. Both readings use the same index arithmetic and a different slice of the past.
What happens when the index is revised or the release slips?
Preliminary indexes stay open to revision for up to four months after first publication. September 2026 is inside that window, along with August, July, and June. October 2025, the denominator, sits outside it in the pull we used. A September revision changes the month-change column in the table, which is measured from 159.613. The October index is built from October's prices, so the contract's ratio, October over October, takes its numerator from the new release and its denominator from the level already on file.
The rules settle on the one-decimal figure in the official monthly release. A revision in a later month arrives after that settlement. The tenth printed at 8:30 Eastern time on 13 November is the tenth the ladder uses, if the release arrives that day. Later database marks belong to the index, which is a different object from the settled bucket. If the Bureau skips 13 November, the market can stay open until the next PPI report on the Bureau's calendar. If the October figure is still missing then, settlement uses the most recent prior month that has a figure. On our calculation that prior twelve-month change rounds to 6.3 percent, and the 6.3 percent leg was 4.0 cents on 28 October against a 6.3 percent share. A skipped release would settle the book on that prior tenth, which is a different bet from a view on October's prices.
What is that price worth against the print?
The print the contract wants is the unadjusted twelve-month change in final demand, to a tenth. The index level under it, the adjusted monthly headline beside it, and any survey median before the bell are other numbers. Against the thirty-two-month count, 51 cents is a rich price for 6.8 percent or higher, and 2.6 cents is a cheap price for 5.9 percent or lower. Against the nine months of 2026 alone, the 51 cent leg sits close to the share. The 6.2 percent leg, at 19.5 cents against an 18.8 percent share, is where the longer count and the screen already agree. The price is worth the tenth it names, measured against which history you rerun, and it says little about the adjusted monthly headline the wires will lead with.
Figures here are reference data from the Bureau of Labor Statistics public API and a Polymarket book read on 28 October 2026. The 32-month share is a count of past monthly changes mapped through the latest index, and the page explains how a producer-price bucket is built. It is not a recommendation to trade any contract.