

I have sat with UK inflation buckets through enough releases to treat a 48.8% favourite with suspicion when the index has already moved.
The Consumer Prices Index rose by 3.6% in the 12 months to October, and the published index is 144.9. The Office for National Statistics put that bulletin out at 07:00 GMT on 18 November. At 07:35 UTC the 3.5% to 3.9% leg was still 48.8%, the same outcome price, bid, ask and last trade I had at 06:59 UTC and at 07:11 UTC, while the 4.0% to 4.4% outcome price had fallen from 25.05% to 13.35%.
The live book is the U.K. annual inflation event. Links to Polymarket are affiliate links, from which The Traders Spread may earn a commission at no cost to you. The two legs that carry the argument are the 3.5% to 3.9% contract and the 4.0% to 4.4% contract.
Key facts
- The Consumer Prices Index rose by 3.6% in the 12 months to October, and the index stood at 144.9 (2015=100), up from 3.5% and 144.1 in September. Source: ONS consumer price inflation bulletin, 18 November 2026.
- CPIH rose by 3.7% over the same 12 months, from 3.6%, while core CPI was 2.8% and little changed, goods CPI rose from 3.2% to 3.5%, and services CPI was 3.7% and little changed. Source: ONS, 18 November 2026.
- Petrol averaged 174.7 pence per litre, up 5.2 pence on the month, diesel averaged 199.5 pence, up 7.0 pence, and CPI transport rose from 6.6% to 7.5%. Source: ONS, 18 November 2026.
- The 3.5% to 3.9% leg showed an outcome price of 48.8%, bid 48.7 cents, ask 48.9 cents and last trade 48.9 cents, on $75,814 of volume and $1,746.74 of liquidity. Source: Polymarket gamma-api, 18 November 2026, 07:35 UTC.
- The event showed $170,971.58 of volume, $9,547.46 of liquidity and $2,144.82 of volume over the prior 24 hours, and the nine outcome prices summed to 88.10%. Source: Polymarket gamma-api, 18 November 2026, 07:35 UTC.
- Bank staff looked for headline CPI around 4.5% in the first quarter of 2027 and around 5% in the second, and the Committee raised Bank Rate to 4% by eight votes to one. Source: Bank of England minutes, 5 November 2026.
1. The favourite, after the bulletin
Nine legs are open on the December CPI 12-month rate, and each pays if the published one-decimal figure falls in that band. I am marking gamma at 07:35 UTC on 18 November. Event volume was $170,971.58, event liquidity was $9,547.46, and volume over the prior 24 hours was $2,144.82, up from $2,095.13 at 07:11.
The favourite earns the argument because the book around it is tight: 48.8% on $75,814 of volume, 48.7 cents bid and 48.9 offered. The 4.0% to 4.4% outcome price is 13.35% inside a 10.1 to 16.6 cent book, on $18,230 of volume. At 07:11 that leg was 25.05% and offered at 33.5 cents, on $18,180 of volume. A mid that drops almost 12 points while reported volume barely moves is a quote, while the favourite beside it is a settled price.
The legs at 2.9% and below are each priced at 1.60% or less. The 3.0% to 3.4% outcome price rose from 18.5% at 07:11 to 19.5%, with the last trade still at 20 cents. The nine outcome prices sum to 88.10%, against 98.95% at 07:11, and that gap opened in the two wide books rather than in the favourite.
| Band | Outcome price | Bid | Ask | Last | Volume | Liquidity | Paths of 49 |
|---|---|---|---|---|---|---|---|
| Below 1.0% | 0.75% | 0.2c | 1.3c | 1.2c | $3,278 | $1,043 | 0 |
| 1.0% to 1.4% | 0.90% | 0.4c | 1.4c | 3.2c | $2,658 | $1,292 | 0 |
| 1.5% to 1.9% | 1.60% | 0.4c | 2.8c | 5.1c | $4,110 | $738 | 0 |
| 2.0% to 2.4% | 1.10% | 0.3c | 1.9c | 0.7c | $20,050 | $1,667 | 0 |
| 2.5% to 2.9% | 1.10% | 0.8c | 1.4c | 1.5c | $24,606 | $733 | 0 |
| 3.0% to 3.4% | 19.5% | 17c | 22c | 20c | $11,854 | $1,250 | 0 |
| 3.5% to 3.9% | 48.8% | 48.7c | 48.9c | 48.9c | $75,814 | $1,747 | 12 |
| 4.0% to 4.4% | 13.35% | 10.1c | 16.6c | 16.6c | $18,230 | $560 | 33 |
| 4.5% or more | 1.0% | 0.9c | 1.1c | 0.9c | $10,421 | $751 | 4 |
2. What October did to the index
The contract pays on the December rate, so October is the last index point in hand. Every level below comes from the ONS consumer price inflation bulletin for October, and the same page dates the November bulletin at 16 December 2026.
CPI rose by 0.5% on the month, against 0.4% in October 2025, so the annual rate edged from 3.5% to 3.6%. Goods CPI rose from 3.2% to 3.5%, the highest goods rate since September 2023, and transport rose from 6.6% to 7.5%. Petrol rose 5.2 pence to 174.7 pence, the highest since August 2022, and diesel rose 7.0 pence to 199.5 pence, the highest since January 1996. Restaurants and hotels supplied the largest offsetting downward contribution.
The Office for National Statistics posted the annual rate at 07:00 GMT.
The Consumer Prices Index (CPI) rose by 3.6% in the 12 months to October 2026, up from 3.5% the previous month.
— Office for National Statistics (ONS) (@ONS) November 18, 2026
Read more➡️ https://t.co/qyuzLmsYat pic.twitter.com/lTPORmN0Dq
Three levels drive the December sum. October 2026 is 144.9, November 2025 is 139.5 after a change of minus 0.2%, and December 2025 is 140.1 after a change of plus 0.4%. The December 2026 rate is that month's index divided by 140.1, minus one, rounded half up to one decimal on the published one-decimal indices. A result on a tenth could move if the unrounded index differs in the second decimal. October's check, 144.9 divided by 139.8 minus one, is 3.65% and publishes as the 3.6% on the page.
| Month | CPI index | One-month change | 12-month rate |
|---|---|---|---|
| Nov 2025 | 139.5 | -0.2% | 3.2% |
| Dec 2025 | 140.1 | +0.4% | 3.4% |
| Jan 2026 | 139.5 | -0.5% | 3.0% |
| Feb 2026 | 140.1 | +0.4% | 3.0% |
| Mar 2026 | 141.0 | +0.7% | 3.3% |
| Apr 2026 | 142.1 | +0.7% | 2.8% |
| May 2026 | 142.4 | +0.2% | 2.8% |
| Jun 2026 | 142.5 | +0.1% | 2.6% |
| Jul 2026 | 142.9 | +0.3% | 2.9% |
| Aug 2026 | 143.6 | +0.5% | 3.1% |
| Sep 2026 | 144.1 | +0.4% | 3.5% |
| Oct 2026 | 144.9 | +0.5% | 3.6% |
3. From a monthly change to a December band
Hold 144.9, apply a monthly change for November and another for December, divide by 140.1, and round half up to one decimal. A published 3.9% stays inside the favourite, a published 4.0% falls in the next band, and a published 4.5% is the open top leg.
The weak November 2025 base does a lot of work before December arrives. A flat November, index still 144.9, is 144.9 divided by 139.5, minus one, which is 3.87% and publishes as 3.9%, and it requires prices to stop rising for a month. A November rise of 0.1%, June's change and the smallest positive month in the 2026 column, takes the November annual rate to 3.97% and publishes as 4.0%. A November rise of 0.3%, July's pace, publishes as 4.2% for November alone. December then clears a harder base, because December 2025 rose 0.4%. A soft December can walk a high November print back into the favourite, and a firm December can push a soft November out of it.
Staying at a published 3.9% or lower means a December index under about 145.63, because 140.1 times 1.0395 is the half-up line. From 144.9 that is a cumulative rise of about 0.51% across both months. October itself rose 0.5% in a single month, so the hurdle is a slowdown from the print just delivered, and the table shows which pairs clear it.
| November change | December change | Unrounded December rate | Published | Band |
|---|---|---|---|---|
| +0.1% | +0.1% | 3.63% | 3.6% | 3.5% to 3.9% |
| +0.2% | +0.1% | 3.74% | 3.7% | 3.5% to 3.9% |
| +0.2% | +0.2% | 3.84% | 3.8% | 3.5% to 3.9% |
| +0.1% | +0.4% | 3.94% | 3.9% | 3.5% to 3.9% |
| +0.3% | +0.3% | 4.05% | 4.0% | 4.0% to 4.4% |
| +0.4% | +0.4% | 4.26% | 4.3% | 4.0% to 4.4% |
| +0.4% | +0.5% | 4.36% | 4.4% | 4.0% to 4.4% |
| +0.5% | +0.5% | 4.46% | 4.5% | 4.5% or more |
These eight rows use the same formula as the 49-path count, and a pair such as 0.1% then 0.4% still publishes as 3.9%, so the favourite is reachable. The live question is how often those quiet pairs show up among the months already on the table.
4. Forty-nine paths, and where they land
I resample the published one-month CPI changes, with November and December drawn independently and with equal weight, from seven months: February +0.4%, May +0.2%, June +0.1%, July +0.3%, August +0.5%, September +0.4% and October +0.5%. That is 49 paths, each run through the index formula and rounded half up.
January, March and April stay out. January was minus 0.5%, the only decline in the 2026 column, a post-holiday drop from 140.1 to 139.5, and November and December sit before that drop. March and April were both plus 0.7%, while the annual rate went from 3.3% to 2.8% and then to 2.6% by June, a base-effect problem different from a November 2025 decline of 0.2% and a December 2025 rise of 0.4%. Section 7 puts the three months back.
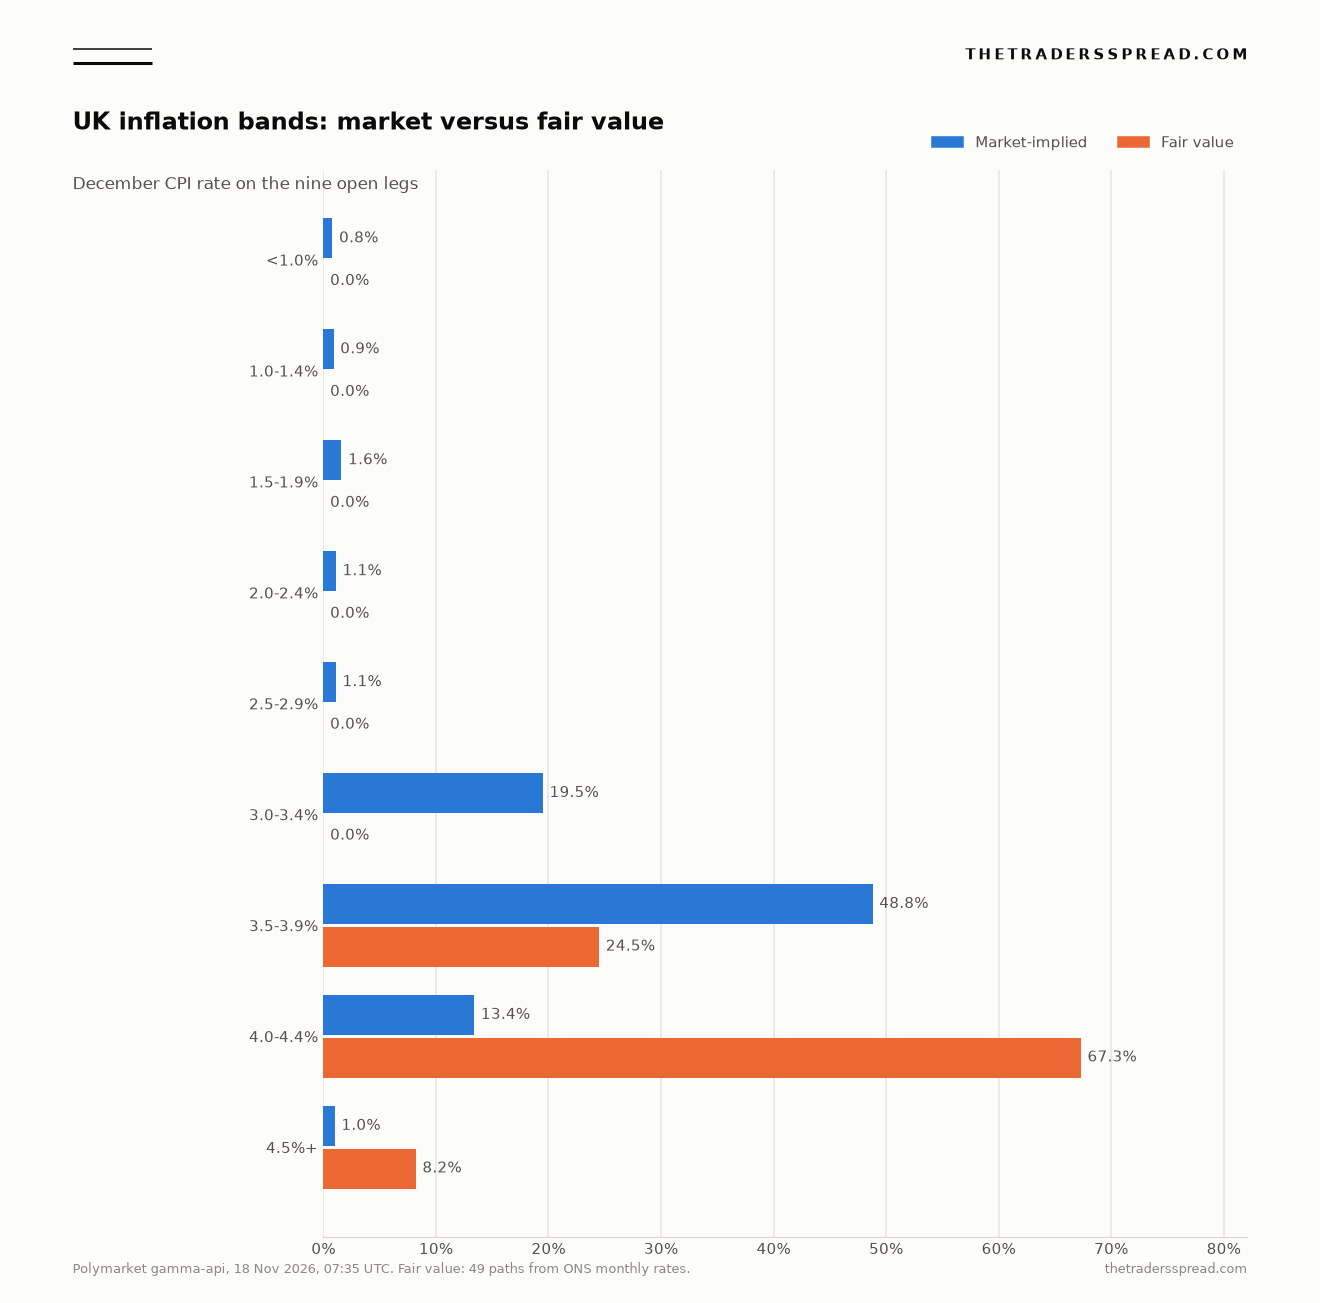
Twelve of the 49 paths publish inside 3.5% to 3.9%, which is 24.5% and the fair value under the favourite. Thirty-three publish inside 4.0% to 4.4%, which is 67.3%. Four publish at 4.5% or above, which is 8.2%, and each of those four pairs August's plus 0.5% with October's plus 0.5%. The unrounded rates on those paths average 4.14%. Bands at 3.4% and below draw zero paths, because 140.1 times 1.034 is already 144.9, and every month in the sample is a rise. Zero here means the sample misses the band. It leaves a repeat of January's decline to the ten-month check.
The chart sets those 49-path weights against the 07:35 outcome prices, rounded half up to one decimal, so 0.75% prints as 0.8% and 13.35% prints as 13.4%, and both 1.10% legs print as 1.1%.
5. The case against the favourite
The pace that keeps December inside the favourite is the slow tail of a sample whose seven changes average 0.34 points. Two months at that average land near 4.1%. The twelve paths inside 3.5% to 3.9% are combinations of 0.1%, 0.2% and, at the edge, 0.3% with a slow partner, so a 48.8% price treats that tail as about twice as common as the months on the page. A 0.1% November rise already publishes as a 4.0% November rate, and a flat November, the 3.9% print, is absent from those seven rises. Plus 0.2% then plus 0.1% still publishes as 3.7%, so the band is reachable. The contract price treats it as the modal outcome.
A tight quote can still be a bucket that only the quiet paths reach, which is the point in how a Core PCE bucket gets its price. The width has to be earned from the last index, and here that index is 144.9 against a December base of 140.1. If both coming months were 0.2%, the published rate would be 3.8% and 48.8% would look ordinary. July through October ran 0.3%, 0.5%, 0.4% and 0.5%. A slowdown to 0.2% is a cooler forecast than those months, and 48.8 cents against 24.5 cents of resampled history is the gap I am pushing back on.
6. The wide book on the next band
Thirty-three of the 49 paths land in 4.0% to 4.4%, so fair value there is 67.3%, against a 13.35% outcome price, a 10.1 cent bid, a 16.6 cent ask and a 16.6 cent last-trade field. Every one of those quotes sits under 67.3%, and so did the 07:11 ask at 33.5 cents. The open top leg is a smaller quarrel, four paths and 8.2% against a 1.0% price. Move those four into the middle band and the favourite's twelve stay put, so the case against 48.8% survives a reader who zeros the tail.
7. Put the excluded months back
The check uses all ten published monthly changes from January through October, drawn independently, which is 100 paths. Sixteen publish inside 3.5% to 3.9%. Fourteen publish inside 3.0% to 3.4%. Forty-one publish inside 4.0% to 4.4%. Twenty-eight publish at 4.5% or above. One path, January's minus 0.5% doubled, lands in 2.0% to 2.4%, and the bands under 2% stay empty.
Sixteen percent is the kinder reading of the favourite, and it sits further from 48.8%. The 3.0% to 3.4% band fills to 14% once January can repeat, against a live 19.5%, which is a smaller argument than the favourite. The cost of that sample is the tail, because March and April at plus 0.7% get to pair with everything, and I leave them out of the fair value for the reason in section 4. The call uses twelve divided by 49, which is 0.2449, quoted as 24.5%.
RelatedOpenAI's IPO Ladder Measures Only a First-Day Close
8. The Bank's horizon sits past this contract
The minutes of the meeting ending on 4 November are about a later peak than this book. Staff's projection, on energy prices over the 15 working days to 27 October, was for headline CPI around 4.5% in the first quarter of 2027 and around 5% in the second. Brent futures in that window averaged $108 a barrel and UK gas averaged 216 pence a therm, 38% and 81% above the July Report. Direct energy effects were about one percentage point of the September 3.5% outturn, mostly fuels. The Committee raised Bank Rate by a quarter point to 4%, eight votes to one, with Catherine L Mann preferring 4.25%.
A December mean of 4.14% sits under the staff figure of 4.5% for the following quarter. Mann's projection, 4.9% by the middle of 2027 and about 25 basis points higher absent the Budget measures, is that same later horizon. The Committee, briefed on the Budget of 28 October, judged the new measures would lower CPI by a quarter of a percentage point by the second quarter of 2027, after the bulletin this contract reads. The desk wrote the decision up while it was still a price, in the note on the 25 basis point hike. Mixing a 2027 peak with the arithmetic on 144.9 and 140.1 is how a 1% tail and a 49% favourite can both look sensible.
9. What the rules actually read
The gamma text resolves on the CPI 12-month rate for December, to one decimal, in the column labelled CPI 12-month rate. The release it schedules is 20 January 2027, and the payload ends at 04:59 UTC on 21 January 2027. If the December bulletin misses that window, the rules use the last month published by the time the following release is due. A revision after the resolving bulletin sits outside the wording I read. The one-decimal rule is why a true 3.94% and a true 3.96% become different contracts once they print as 3.9% and 4.0%.
That same first-print discipline is what US CPI markets have to follow when the first print is the print that counts. The nine legs are one ladder over a single number, and the 49 paths are one distribution over the same rungs, which is why a rich favourite and a cheap neighbour are one statement counted twice.
10. Where the price sits
The 3.5% to 3.9% contract is marked at 48.8%, inside a 48.7 to 48.9 cent book, against a fair value of 24.5%. The price sits above that fair value. The fair value is 12 of the 49 paths from the seven monthly changes above, run through the October index of 144.9 and the December 2025 index of 140.1.
The 16.6 cent ask on 4.0% to 4.4% also sits under a 67.3% fair value. The call hangs on the favourite, the tight book, and it survives the ten-month check. A November change of 0.1% or less on 16 December would leave more paths inside the favourite, and a change of 0.4% or more would do the opposite off the November 2025 index of 139.5. Until then, 48.8% is a high price on a table whose latest entry is plus 0.5%.
Frequently asked questions
Which figure settles the contract?
The contract reads the CPI 12-month rate for December, to one decimal, from the ONS consumer price inflation bulletin. The gamma text schedules that release for 20 January 2027, and the payload ends at 04:59 UTC the following day. October's 3.6% and the index of 144.9 are the starting point for the December sum. The resolving observation is the December rate. A later revision sits outside the wording I read.
Why argue with the 3.5% to 3.9% band?
It is the favourite, and the large leg with a two-tick book. At 07:35 UTC the outcome price was 48.8%, bid 48.7 cents and ask 48.9 cents, on $75,814 of volume. The neighbouring 4.0% to 4.4% mid fell from 25.05% to 13.35% inside twenty-four minutes. A stable two-tick price can carry a model. A mid that jumps that far is a quote range, so the call hangs on the favourite.
What pace keeps December inside the favourite?
Both months have to stay slow. Two rises of 0.2% produce a published December rate of 3.8%, and two rises of 0.3% produce 4.0%, the next band. From the October index of 144.9 the price level can rise about 0.51% in total before the published rate rounds up through 4.0%. The seven monthly changes in the sample average 0.34 points, and October itself was a 0.5% month.
What would move the 24.5% fair value?
The November bulletin, dated 16 December, replaces one of the two draws with a known monthly change. A rise of 0.1% or less leaves December more room inside 3.5% to 3.9%. A rise of 0.4% or more uses up the weak November 2025 base of 139.5 and pushes the remaining paths higher. The minutes also tie the staff path to Brent at $108 a barrel and UK gas at 216 pence a therm through 27 October.
This is analysis, not a recommendation. A prediction-market contract can settle at zero, and the stake can be lost.