

The US unemployment rate was 4.2 percent in September 2026, the seasonally adjusted U-3 figure the Bureau of Labor Statistics published at 8:30 a.m. ET on 2 October. U-3 divides people who were out of work, available, and searching during the four weeks up to the reference week by the civilian labor force. That reference week contains the 12th. For a monthly bucket, the published tenth is the score that matters.
A bucket is one contract that settles if the first print lands on a stated tenth, or inside an outer band such as 3.8 percent or lower. At 06:34 UTC on 27 October 2026 the 4.2 percent bucket was priced at 46 cents and the 4.1 percent bucket at 28.5 cents. July, August, and September average 4.13 percent, and that average rounds to 4.1 at the same one decimal the contract uses, while the latest month and the highest price both sit on 4.2. The unrounded rate, unemployed divided by the labor force, rose from 4.141 percent in August to 4.175 percent in September, a move of 0.034 point, and the published tenth still stepped by a full 0.1 because 4.141 rounds to 4.1 and 4.175 rounds to 4.2. Links to Polymarket are affiliate links, from which The Traders Spread may earn a commission at no cost to you. The live ladder is the October unemployment rate event.
FRED's seasonally adjusted levels put the civilian labor force at 169.777 million in August and 170.262 million in September, with unemployment at 7.031 million and then 7.109 million. Participation moved from 61.6 percent to 61.8 percent. The same Employment Situation said nonfarm payroll employment rose by 29,000. Payrolls count jobs, and U-3 counts people, which is why the nonfarm payrolls buckets are a separate page even though both figures leave the building on the same Friday.
Updated 27 October 2026
Key facts
- September 2026 U-3 was 4.2 percent, and unemployment was 7.1 million. Source: BLS Employment Situation, 2 October 2026.
- The unrounded rate moved from 4.141 percent to 4.175 percent, while the published tenth moved by 0.1. Source: FRED CLF16OV and UNEMPLOY, 27 October 2026.
- The 4.2 percent bucket was 46 cents and the 4.1 percent bucket was 28.5 cents, with about $25,318 of volume. Source: Polymarket, 27 October 2026, 06:34 UTC.
- Participation was 61.8 percent in September, up from 61.6 percent in August. Source: BLS Employment Situation, 2 October 2026, and FRED CIVPART.
- Of 55 one-month moves since January 2022, 17 were flat and 17 fell by 0.1 point. Source: FRED UNRATE, 27 October 2026.
- Continuing claims were 1,728,000 in the week ending 10 October 2026, and initial claims were 194,000 a week later. Source: FRED CCSA and ICSA, 27 October 2026.
- The October release is set for 8:30 a.m. ET on 6 November 2026, and the ladder uses the first print. Source: BLS Employment Situation, 2 October 2026.
1. The last tenth is the anchor
Monthly U-3 markets are a recurring family. Each event names one month, lists tenths around the recent range, and adds outer bands so the outcomes cover the print. The October event resolves on seasonally adjusted U-3 for October 2026, to one decimal, and the rules name the release for 8:30 a.m. ET on 6 November 2026. A later revision of that month leaves the settlement on the first print.
From March through September 2026 the rate stayed inside 4.1 to 4.3 percent, the range the Bureau's summary named. On 27 October the book was 28.5 cents on 4.1, 46 cents on 4.2, and 18 cents on 4.3. Yes prices across all nine legs add to 102.65 percent, because each leg has its own spread. Volume was heavier on 4.1 ($8,054) than on 4.2 ($7,748), and event liquidity was about $27,703.
The leg on the latest print is the 4.2 percent unemployment bucket. Its bid was 43 cents and its ask was 49 cents, around the 46 cent outcome price.
2. A tenth of a point reprices the whole book
U-3 is published to one decimal, so the gap between neighboring contracts is the whole payoff. August to September moved 0.034 point before rounding and 0.1 after it. A three-month average can sit at 4.13 while the modal price stays on 4.2, because the contract pays the single month.
Survey noise is wider than one tenth in the Bureau's own example. The technical note says that around a 6 percent unemployment rate, the 90 percent confidence interval on the monthly change is about 0.3 point either side. The example is tied to a 6 percent rate, so it is a scale guide, and a tenth-point bucket is narrower than it. A small drift can still cross a rounding line and move the payoff.
The household survey samples about 60,000 eligible households. Continuing claims, people already on unemployment insurance, were 1,728,000 in the week ending 10 October 2026 (FRED CCSA). Initial claims, the new filings, were 194,000 in the week ending 17 October 2026 (FRED ICSA). The technical note treats the household rate as independent of whether a benefit is paid. A weekly insurance market is the inflow. This ladder is the monthly rate.
3. Participation can move the rate by itself
U-3 is a ratio. Participation, the labor force as a percent of the population, was 61.8 percent in September, and the employment-population ratio was 59.2 percent. From August the labor force rose by 485,000 and unemployment by 78,000, so household employment rose by about 407,000. Rounding still turned a 0.034 point rise in the ratio into a published step of 0.1.
Someone who wants a job and skipped the search during the prior four weeks stays outside U-3. The September release put that group at 5.8 million. U-6, the broader underutilization rate, was 7.6 percent on FRED series U6RATE. The contract settles on U-3 alone, so a reshuffle among the side counts can leave the winning tenth where it stood.
4. Payrolls share the morning and answer a different question
The Employment Situation staples two surveys together. The household survey produces U-3. The establishment survey produces payrolls, from about 119,000 businesses and 622,000 worksites, on the pay period that includes the 12th. Households count a person once, including farm workers and the unincorporated self-employed. Establishments count each payroll job and skip those groups.
September payrolls rose by 29,000, against a prior-year average of 45,000, and the Bureau called both that gain and the 4.2 percent rate little changed. July was revised from plus 21,000 to minus 10,000, and August from plus 162,000 to plus 133,000, a combined 60,000. The U-3 contract locks to the first household print.
The Bureau of Labor Statistics posted the pair of headline figures the morning of the release. The post matters because it puts a payroll change and a U-3 tenth in one sentence, which is how the two surveys get collapsed into a single jobs story.
Both payroll employment (+29,000) and unemployment rate (4.2%) change little in September https://t.co/ZwrVfLviqL #JobsReport #BLSdata
— BLS-Labor Statistics (@BLS_gov) October 2, 2026
Core PCE buckets sit on a different release, the Bureau of Economic Analysis price index for consumption. They share a desk with this rate and use a different calendar and a different unit.
5. The first print is the print that settles
Resolution text is part of the price. This family uses the Employment Situation, seasonally adjusted U-3, to one decimal, and settlement can arrive as soon as the release is out. A later revision leaves the resolved bucket on the original tenth. If the October report is still absent when the following month is due, the rules point at the last month that did publish.
Seasonal factors in the household survey touch the current month, which is why one tenth compares with the prior one. The contract takes that adjusted tenth from the first release. The reference week is the calendar week containing the 12th. Temporary absence for illness, weather, or a dispute stays in employment, and a layoff with expected recall can count as unemployment after the search pauses. Either rule can move a tenth while payrolls stay quiet. US CPI markets show the same first-print habit on a price index.
6. The base rate of tenths sits under the modal price
The fair value used here is a count of adjacent months in FRED UNRATE from January 2022 through September 2026, kept only when the second month is truly the next one. The September-to-November 2025 gap drops out, because October 2025 is absent, leaving 55 steps. Three fell 0.2 point (5.5 percent), 17 fell 0.1 (30.9 percent), 17 were flat (30.9 percent), 11 rose 0.1 (20.0 percent), and 7 rose 0.2 (12.7 percent). The window contains zero moves of 0.3 point or larger.
From a 4.2 print, flat maps to the 4.2 bucket, a 0.1 decline to 4.1, and a 0.1 rise to 4.3. The 4.2 base rate is 30.9 percent, or 0.309. The 46 cent price sits above it, and so does the 43-to-49 cent bid-ask, so the gap is wider than the spread. The 4.1 price of 28.5 cents is close to that same 30.9 percent share. The 4.4 price of 4.1 cents sits under a 12.7 percent share.
| Bucket | Yes price | Volume |
|---|---|---|
| 3.8 percent or lower | 0.1 percent | $541 |
| 3.9 percent | 0.05 percent | $581 |
| 4.0 percent | 4.8 percent | $1,293 |
| 4.1 percent | 28.5 percent | $8,054 |
| 4.2 percent | 46 percent | $7,748 |
| 4.3 percent | 18 percent | $4,004 |
| 4.4 percent | 4.1 percent | $1,870 |
| 4.5 percent | 0.2 percent | $610 |
| 4.6 percent or higher | 0.9 percent | $615 |
Yes prices and volume on the October U-3 ladder, Polymarket, 27 October 2026, 06:34 UTC. The 3.9 percent leg is 0.05 percent and rounds to 0.1 on the chart.
| Move from a 4.2 print | Count | Share | Bucket |
|---|---|---|---|
| Down 0.2 point | 3 | 5.5 percent | 4.0 percent |
| Down 0.1 point | 17 | 30.9 percent | 4.1 percent |
| Flat | 17 | 30.9 percent | 4.2 percent |
| Up 0.1 point | 11 | 20.0 percent | 4.3 percent |
| Up 0.2 point | 7 | 12.7 percent | 4.4 percent |
| Larger than 0.2 point | 0 | 0 percent | Outer bands |
Exact one-month changes in FRED UNRATE, January 2022 through September 2026. Shares are the count divided by 55.
RelatedWhy US CPI Markets on Polymarket Miss the First Print
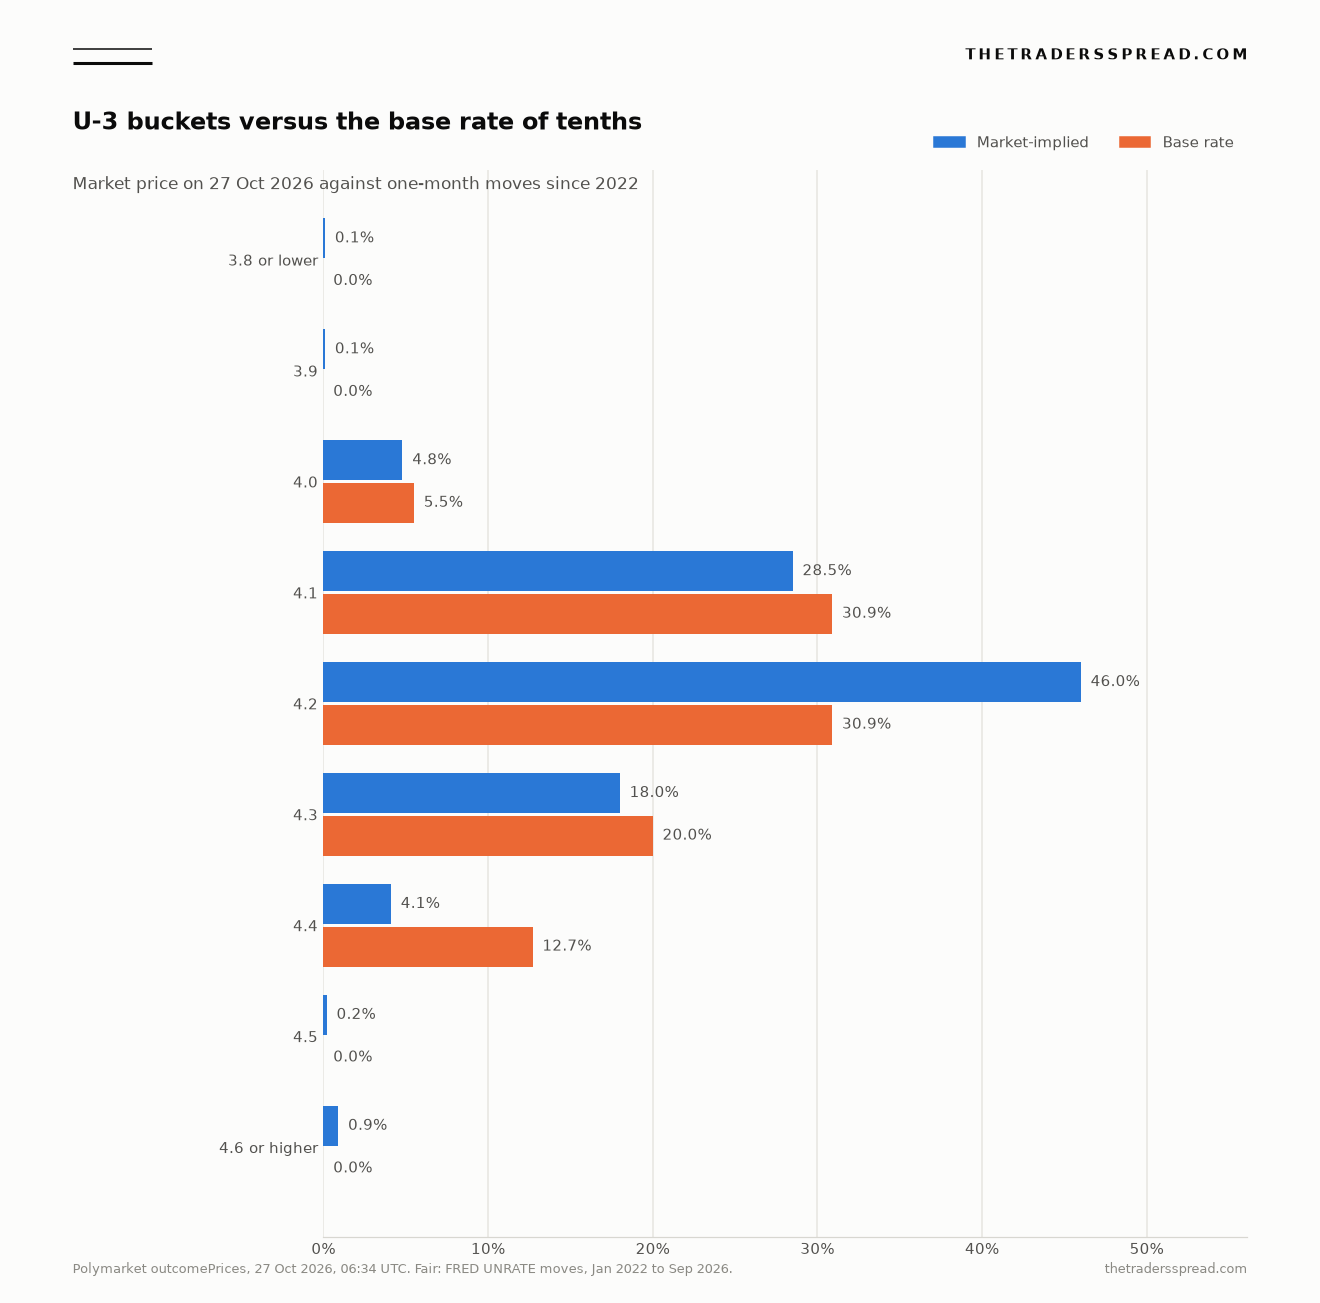
Flat months and one-tenth declines each get 17 steps in the count, while the book prices 4.2 at 46 cents and 4.1 at 28.5 cents. Outer bands keep a sample share of zero and a small posted price.
The low neighbor is the 4.1 percent unemployment bucket, the leg whose 28.5 cent price sits nearest the 30.9 percent share of one-tenth declines.
The high neighbor is the 4.3 percent unemployment bucket, at 18 cents against a 20 percent share of one-tenth rises.
What is the U-3 unemployment rate?
U-3 is the official unemployment rate from the Current Population Survey, unemployed people as a percent of the civilian labor force. The Employment Situation prints it to one decimal and seasonally adjusted. A person counts as unemployed when out of work, available, and searching, or on layoff expecting recall. The September 2026 print was 4.2 percent, and the Bureau's summary rounded unemployment to 7.1 million. The monthly bucket uses that adjusted tenth from the first release.
How does a bucket differ from the rate itself?
The rate is a single published tenth, and a bucket is a contract on one slice, usually 0.1 point, plus outer bands. A three-month average of 4.13 percent rounds to 4.1 while September printed 4.2, so the average and the latest month can name different slices. On 27 October 2026 those slices were 46 cents and 28.5 cents. Slice width is why a small drift in the ratio reprices the book.
Where do initial claims and continuing claims fit?
Initial claims count new unemployment-insurance filings for a week, and continuing claims count people already on those benefits. The weeks ending 17 October and 10 October 2026 showed 194,000 and 1,728,000 on FRED series ICSA and CCSA, and both series are insurance records. U-3 comes from a household survey, and the technical note treats that rate as independent of whether a benefit is paid. A weekly claims ladder and a monthly U-3 ladder use different calendars and different units.
Why can the unemployment rate and payrolls move apart?
They come from different surveys released on the same morning. Payrolls count jobs, and a second job counts again, while U-3 counts people once and includes the self-employed and farm workers the payroll survey skips. In September 2026 payrolls rose by 29,000 while U-3 went from 4.1 percent to 4.2 percent and participation rose by 0.2 point. A jobs gain and a higher rate can share a release when the labor force grows.
What does a later revision do to the bucket?
On this ladder the settlement stays with the first Employment Situation for the named month, so a later U-3 revision leaves the resolved tenth on that first print. Payrolls often rewrite the prior two months, and the September release cut July and August by a combined 60,000. That rewrite belongs to the establishment survey. The U-3 bucket stays with the tenth printed at 8:30 a.m. ET on release morning.
What is the base rate drawn on the chart?
It is the share of exact one-month changes in FRED UNRATE from January 2022 through September 2026, 55 steps, mapped from a starting print of 4.2. Flat months and declines of 0.1 point each occurred 17 times, or 30.9 percent. The 4.2 bucket was 46 cents at 06:34 UTC on 27 October 2026, above that share. Bars round to one decimal, and the count includes a zero share for moves larger than 0.2 point.
A checklist for the next release
- The latest seasonally adjusted U-3 belongs on the page, to one decimal, with the month it covers.
- The unrounded ratio of unemployment to the labor force belongs beside that published tenth.
- Participation and the labor-force level belong beside the rate, so the tenth has a denominator.
- The price on the latest tenth belongs beside the price on the tenth to either side.
- The reference week is the calendar week that contains the 12th.
- The resolution line names the first release, the seasonal adjustment, and the one-decimal print.
- The release clock is 8:30 a.m. ET on the Employment Situation Friday.
- Continuing claims for the latest week stay on their own line, separate from U-3.
Figures here are reference data from the Bureau of Labor Statistics, FRED, and a Polymarket order book retrieved on 27 October 2026. The base rate is a count of past one-month moves, and the page explains how a monthly unemployment-rate bucket is priced. It is not a recommendation to buy or sell any contract.