

A 40.4 cent price still sits on the China inflation band just below the latest official print, even though that print, 0.7 percent, already lives inside the neighbouring band at 49.0 cents. Food prices fell 2.9 percent year on year in October while the headline rose, so one consumer-price number can look calm in the total and strained in the basket.
Updated 13 November 2026.
The live book that turns China inflation into bands is the annual contract on Polymarket. Links to Polymarket are affiliate links, from which The Traders Spread may earn a commission at no cost to you. It pays one cell: the December year-on-year change in the consumer price index, published to one decimal by the National Bureau of Statistics. The January-to-October average, 0.9 percent, is a different statistic. The International Monetary Fund's 2026 average consumer-price reading is 1, and its end-of-period reading is 1.3. Premier Li Qiang's government work report, delivered for the State Council, set a "CPI increase of around 2 percent." Only the December cell settles the bands.
Dong Lijuan, chief statistician of the Urban Survey Department at the National Bureau of Statistics, set the October story down on 9 November 2026. The headline rose 0.7 percent from a year earlier, 0.2 percentage points slower than the prior month, which places September at 0.9 percent. Core prices excluding food and energy rose 0.8 percent, also 0.2 points slower. Food fell 2.9 percent, and she put the wider drag at about 0.49 points of the headline. Gasoline rose 22.4 percent, worth about 0.63 points, and she put energy's rise at 9.9 percent after 7.3 percent. The English release the same week matches the headline, the food fall, the non-food rise of 1.5 percent and the core rise of 0.8 percent.
Key facts
- October headline China inflation rose 0.7 percent year on year, and the January-to-October average rose 0.9 percent (National Bureau of Statistics English release, 10 November 2026).
- Food prices fell 2.9 percent year on year, non-food prices rose 1.5 percent, and core prices excluding food and energy rose 0.8 percent (National Bureau of Statistics English release, 10 November 2026).
- The contract pays the December year-on-year cell to one decimal, and each leg carries an end date of 10 January 2027 (Polymarket rules text on the Gamma event, read 13 November 2026).
- Lifetime volume on the event stood at $137,980, with event liquidity of $18,762, at 07:12 UTC on 13 November 2026 (Gamma API).
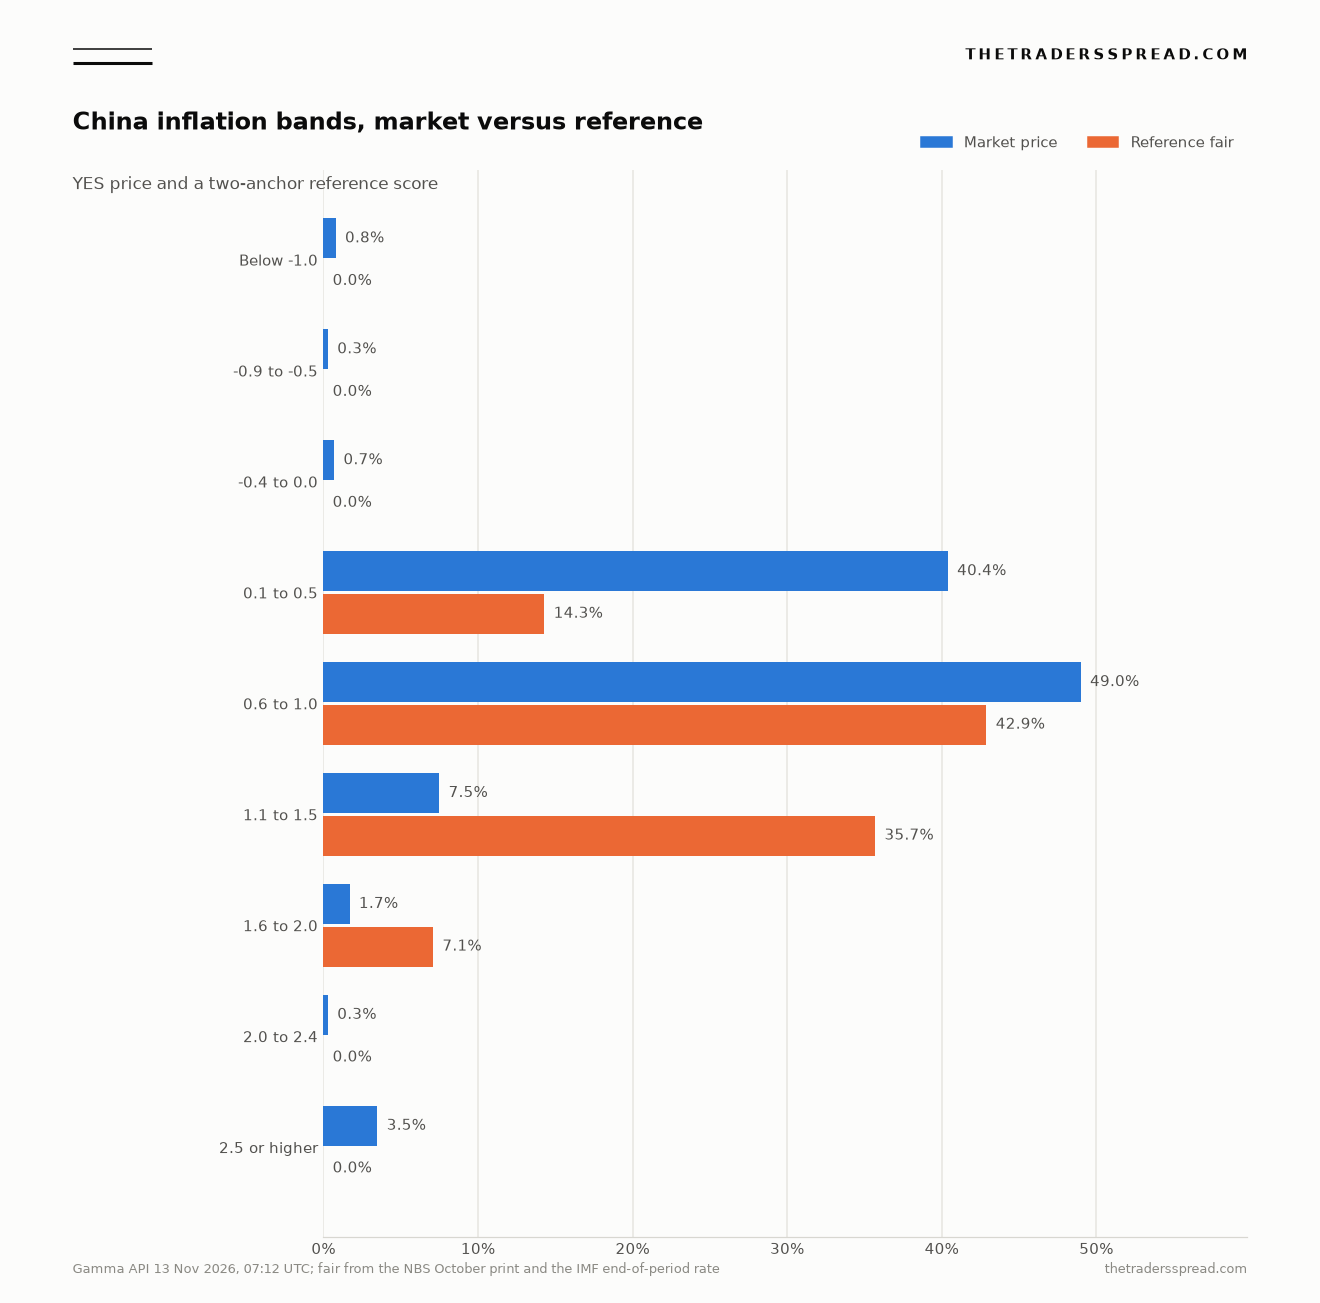
- The 0.6 to 1.0 band was priced at 49.0 cents and the 0.1 to 0.5 band at 40.4 cents at that same timestamp (Gamma API, 13 November 2026).
- The government work report set a CPI increase of around 2 percent, while the Fund's 2026 average consumer-price reading is 1 and its end-of-period reading is 1.3 (People's Daily Online, 5 March 2026; IMF DataMapper API, 13 November 2026).
How one December cell picks the band
The rules text, read from the Gamma event on 13 November 2026, sends a reader to the English press-release page, then to the December report. The resolving figure is the consumer price index in the table "Consumer Price Indexes in December 2026," in the column "Growth Rate Y/Y (%)." The contract pays the headline year-on-year cell.
Precision is written into the rule. The official monthly release reports 12-month inflation to one decimal, and the rules use that precision, with 1.9 percent as their example of it. Rounding can leave an aggregate at the high or the low of the classified figures.
A base-period rotation sits inside that printed tenth. From January 2026 the index uses 2025 as the base, and the bureau says the rotation moves the monthly year-on-year rate by about 0.06 percentage points on average. A shift of about 0.06 points can still decide a print that lands on 1.0 or on 0.5, and eight categories plus 268 basic classes sit behind that tenth.
Inside the October basket, food, tobacco, liquor and dining out fell 1.6 percent, about 0.48 points off the headline, fresh vegetables fell 16.9 percent, and energy for transport facilities rose 20.2 percent.
The nine bands are a negative-risk group. The nine YES prices sum to 1.040, so they do not form a clean partition of one. Each leg's end date on the API is 10 January 2027, and the event's own end timestamp is 11 January 2027 at 04:59 UTC. If December data is missing by the date the following month's release is scheduled, the rules resolve the market on the last available month, which is a different print from the December cell and is written into the contract.
Boundaries stay as the titles write them. A print of exactly −1.0 percent falls outside the leg titled less than −1.0 percent and outside the leg titled −0.9 to −0.5 percent. A print of 2.0 percent falls inside the 1.6 to 2.0 leg and also inside the 2.0 to 2.4 leg. October's 0.7 percent, on a one-decimal inclusive reading, sits inside 0.6 to 1.0 and only there. The 0.6 to 1.0 leg is the band that contains the latest official headline.
After the release appears, settlement still runs through a proposal and a dispute window. See how a Polymarket proposal and a dispute work. Gamma lists a taker-only fee schedule on these legs, with a rate of 0.05 and a rebate rate of 0.25.
Nine bands on the same four axes
YES price, lifetime volume, distance from October's 0.7 percent, and the reference score rank this book four different ways. Volumes and liquidity are nearest-dollar readings of each leg's volumeNum and liquidityNum at 07:12 UTC on 13 November 2026. Distance is zero when 0.7 sits inside the band, and otherwise the gap from 0.7 to the nearest one-decimal value the band includes.
| Band | YES price | Volume | Liquidity | Distance from 0.7 | Reference fair |
|---|---|---|---|---|---|
| Below −1.0 | 0.8 | $21,722 | $2,159 | 1.8 | 0.0 |
| −0.9 to −0.5 | 0.3 | $5,498 | $1,745 | 1.2 | 0.0 |
| −0.4 to 0.0 | 0.7 | $6,419 | $2,203 | 0.7 | 0.0 |
| 0.1 to 0.5 | 40.4 | $16,945 | $2,463 | 0.2 | 14.3 |
| 0.6 to 1.0 | 49.0 | $33,270 | $1,880 | 0.0 | 42.9 |
| 1.1 to 1.5 | 7.5 | $27,024 | $2,462 | 0.4 | 35.7 |
| 1.6 to 2.0 | 1.7 | $9,638 | $1,898 | 0.9 | 7.1 |
| 2.0 to 2.4 | 0.3 | $11,063 | $1,776 | 1.3 | 0.0 |
| 2.5 or higher | 3.5 | $6,401 | $1,891 | 1.8 | 0.0 |
On price, 0.6 to 1.0 leads at 49.0 cents, from a raw YES price of 0.490, bid 0.48 and ask 0.50. The neighbour 0.1 to 0.5 is next at 40.4 cents, from a raw 0.404. Lifetime volume ranks those rows in a different order. The 0.6 to 1.0 band still leads, at about $33,270, and the 1.1 to 1.5 band is second at about $27,024 even though its price is 7.5 cents. The tail below −1.0 is third at about $21,722, with a YES price of 0.8 cents.
Distance from the latest print is a quieter ranking. Only 0.6 to 1.0 sits at distance zero. The 0.1 to 0.5 band is 0.2 points away, because 0.5 is the nearest tenth it includes, and 1.1 to 1.5 is 0.4 points away. Liquidity is a separate total again: Gamma's event figure was $18,762.36, rounding to $18,762, while the nine leg books on the same pull sum to about $18,478, and the table uses each leg.
Why the neighbour can stay expensive
A band 0.2 points below the latest print can keep a large price while traders treat the next two prints as free to move. On the 0.1 to 0.5 book the bid was 0.372 and the ask was 0.436, a spread of 6.4 cents, against a 2 cent spread on 0.6 to 1.0. Last trade on the neighbour was 0.369.
Wang Qing, chief macro analyst at Golden Credit Rating, told Jiemian News, in a report carried by CCTV on 9 November 2026, that core consumer prices were sitting around 1 percent. He expected the November year-on-year rise to stay around 1.0 percent, still well under this year's control target of around 2 percent. A November print of 1.0, read inclusively, would land on the top edge of 0.6 to 1.0 and would leave 0.1 to 0.5 behind it, while December would stay an open cell.
Zhang Di, a macro analyst at China Galaxy Securities, told the same outlet that current inflation still depended mainly on external prices and on a handful of components. He read the unchanged core month, which the English table prints as 0.0, as thin endogenous momentum around a price centre that had held.
Of the event's $1,738.81 of volume in the latest 24 hours, $1,293.52 sat in the 0.6 to 1.0 leg, which is 74.4 percent. That leg has also taken 36.1 percent of its own lifetime volume in the past month, $11,999.20 of $33,269.72. The 1.1 to 1.5 leg, second in lifetime volume, took $25 in the latest day and 7.4 percent of its lifetime volume in the past month, $2,005.47 of $27,024.03. The 0.1 to 0.5 leg had $310.29 of volume in the latest day, so the neighbour is still trading, and it is trading inside a wide spread.
The bureau's data interpretation of 20 October 2026, signed only as the deputy director of the Urban Socio-economic Survey Department, gives January at 0.2 percent, February at 1.3 percent, March through June held between 1.0 and 1.2 percent, July at 0.5, August at 0.8 and September at 0.9. October, from the later release, is 0.7. Of the six months stated as a single tenth, January and July sit in 0.1 to 0.5, February sits in 1.1 to 1.5, and August, September and October sit in 0.6 to 1.0. March through June touch both 0.6 to 1.0 and 1.1 to 1.5, so they stay out of a one-band count. The same choice of print is the subject of how a contract chooses the print that settles it.
What the target and the Fund are measuring
People's Daily Online, at 18:57 on 5 March 2026, reported that Premier Li Qiang delivered the government work report on behalf of the State Council. Among the year's objectives the English text prints one short line, "CPI increase of around 2 percent." The line is an annual objective. The contract pays a single December year-on-year cell to one decimal.
The bands that touch 2.0 make the difference numeric. The 1.6 to 2.0 leg was priced at a raw 0.017, shown as 1.7 cents, and the 2.0 to 2.4 leg at a raw 0.0025, shown as 0.3 cents, which together is 0.0195. The 2.5 or higher leg, at a raw 0.0345 and a displayed 3.5 cents, was priced above both, with a bid of 0.003 and an ask of 0.066, a spread of 6.3 cents.
| Source | Statistic | Figure | Band if it were the December cell | Date |
|---|---|---|---|---|
| NBS English release | October headline, year on year | 0.7% | 0.6 to 1.0 | 10 November 2026 |
| NBS English release | January-to-October average | 0.9% | 0.6 to 1.0 | 10 November 2026 |
| NBS English release | Core, excluding food and energy | 0.8% | 0.6 to 1.0 | 10 November 2026 |
| IMF DataMapper, average consumer prices | China, 2026 | 1 | 0.6 to 1.0, reading 1 as 1.0 | API, 13 November 2026 |
| IMF DataMapper, end-of-period consumer prices | China, 2026 | 1.3 | 1.1 to 1.5 | API, 13 November 2026 |
| Government work report, via People's Daily | CPI increase objective | around 2% | Bands that contain 2.0; the objective is a different object | 5 March 2026 |
The Fund's two series, pulled from the DataMapper API on 13 November 2026, split the same way. Average consumer prices for China read 1 in 2026, after 0 in 2025. The 2026 value is the number 1, so at one decimal it is 1.0 and sits on the top of 0.6 to 1.0 if the band is inclusive. End-of-period consumer prices read 0.9 in 2025, 1.3 in 2026, and 1.3 sits inside 1.1 to 1.5. The public pages are the average consumer-price series and the end-of-period series. Treating the end-of-period figure as the bureau's December cell would be a further assumption.
Related4 Readings That Settle a Polymarket Weather Market
On the same CCTV report, Pang Ming, a member of the China Chief Economist Forum, put the fourth-quarter average year-on-year pace in a range of 1.0 to 1.2 percent. That range touches both 0.6 to 1.0 and 1.1 to 1.5. Wu Chaoming, deputy dean of Caixin Research Institute, expected a mild re-inflation pattern, with the fourth quarter around 0.7 percent and the full year about 0.9 percent. His full-year figure, about 0.9 percent, is an average. The 1.1 to 1.5 leg contains the Fund's 1.3 and the top of Pang Ming's range, and it is priced at 7.5 cents.
How the reference score is built
The reference fair is a comparison score from two anchors opened on 13 November 2026: the bureau's October headline of 0.7 percent, and the Fund's end-of-period reading for 2026 of 1.3 percent. The gap between them is 0.6 percentage points. Half of that gap, 0.3 points, sets a window of one-decimal prints around each anchor. Around 0.7 the window is 0.4 through 1.0. Around 1.3 the window is 1.0 through 1.6. Each of those windows holds seven prints. The score gives the two windows equal weight, and inside a window it gives the seven prints equal weight, so one print inside one window carries 0.5 divided by 7, about 7.1 percent. The only shared print is 1.0, and it carries about 14.3 percent.
Band weights are the sum of those print weights. The 0.1 to 0.5 band contains 0.4 and 0.5 from the October window only, which is 1/7, or 14.3 percent. The 0.6 to 1.0 band contains five October-window prints plus the shared 1.0, which is 3/7, or 42.9 percent. The 1.1 to 1.5 band contains five Fund-window prints, which is 5/14, or 35.7 percent. The 1.6 to 2.0 band contains only 1.6, which is 1/14, or 7.1 percent. Every other band contains none of those prints, so the score assigns it zero. The stored fair on the 0.6 to 1.0 band, the band that contains the latest official print, is 0.429.
A gap under 5 percentage points is the range treated as in line. On the one-decimal reading in the chart, 49.0 against 42.9 is a gap of 6.1 points, so the market price on that band sits above the reference fair. On the 1.1 to 1.5 row, 7.5 against 35.7 is a gap of 28.2 points, and the market price sits under the score. The 0.1 to 0.5 row is 40.4 against 14.3. The stored comparison is the 0.6 to 1.0 band, and the other rows keep their own gaps.
The zeros on the tails are a property of the windows, which stop at 0.4 on the low side and at 1.6 on the high side, while the book still posts a price on every tail. A new official print, or a new Fund vintage, moves the anchors and rebuilds the windows. Venue differences in fees and settlement are a separate subject, covered on how the two venues handle fees, rules and settlement.
What to check on the next print
The next monthly release moves the location of the latest print and leaves the settlement cell as December unless the fallback is in force. The bureau's 20 October interpretation already had the third-quarter headline at 0.9 percent year on year, with quarterly food down 0.9 percent, quarterly energy up 3.4 percent on average, and the core up 1.1 percent.
- The one-decimal headline year-on-year cell, and which band contains it.
- Whether the print landed on 1.0, on 2.0, or on exactly −1.0, where two titles meet or a gap opens.
- The food line and the gasoline line beside the headline. October's 0.7 came with food at −2.9 and gasoline at 22.4.
- The YES price, the bid-ask spread, and the past month's share of that leg's lifetime volume.
- The reference gap on the band that contains the new print, set against the 5-point range treated as in line.
- Any new Fund vintage for the end-of-period anchor. The score uses that figure as a window, and the contract still pays the bureau's cell.
Questions readers ask
Which figure settles the band?
The resolving figure is the headline year-on-year change in the December consumer price index, printed to one decimal in the bureau's English monthly table, in the column labelled Growth Rate Y/Y. Food, core, urban and rural lines explain that cell and stay outside the payout. The January-to-October average and the around-2-percent objective are public numbers with other definitions. If December is missing by the next month's scheduled date, the rules move the source to the last available month.
Why can a neighbouring band still carry a large price?
October's 0.7 percent sits inside 0.6 to 1.0, and the 0.1 to 0.5 band is 0.2 points away, yet that neighbour was still priced at 40.4 cents with a 6.4 cent spread. November and December are still ahead, so the latest print locates the present and leaves the settlement cell open. The live YES price is the book at 07:12 UTC on 13 November 2026, and those two measurements are free to diverge.
What is the reference fair?
It is a comparison score, stored at 0.429 for the 0.6 to 1.0 band. Two windows of seven one-decimal prints, one around the October headline of 0.7 and one around the Fund's end-of-period reading of 1.3, are mixed with equal weight. The market price on that band, 49.0 cents, sits 6.1 points above the score, past the 5-point range treated as in line. Other rows keep their own gaps, and a tail outside both windows carries a score of zero.
This is analysis for information only and is not a solicitation to trade any outcome. Capital is at risk, and a band price can move before the December cell is released.