

We price a Core PCE bucket by reading the contract before we read the tape. The September year-over-year book is the current example, and the inputs that move a price on this ladder are the same every month: a one-decimal official print, a nowcast that has already absorbed the consumer price index, the index level from a year earlier, and a book thin enough that a wide ask can look like news.
The two gauges diverged on the same fortnight, which is why gasoline is a distraction on this ladder. The Bureau of Labor Statistics said the consumer price index rose 0.6 percent in September and 3.7 percent over the year, with gasoline up 9.1 percent on the month, at 08:30 Eastern time on 14 October 2026 (USDL-26-1574). Core CPI was 0.3 percent on the month and 2.6 percent on the year, after 2.4 percent in August. The Cleveland Fed's year-over-year Core PCE nowcast, updated 23 October and still on the page when we opened it on 26 October, is 3.05 percent, against an August Core PCE print of 3.0. The headline jumped three tenths while the core nowcast moved half a tenth. Our September CPI odds piece answered a different question, about which tenth the CPI itself would print.
August core CPI at 2.4 percent against August Core PCE at 3.0 percent was a 0.6 point spread. September core CPI at 2.6 percent against a 3.05 nowcast narrows it to 0.45. On the gamma feed at 06:58 UTC on 26 October the 3.1 percent bucket was 49 percent and the 3.0 percent bucket was 28.5 percent. A centre of 3.05 is the shared edge of those tenths, so a symmetric split is even, and the screen has piled the weight on the upper one.
Updated 26 October 2026
Links to Polymarket are affiliate links, from which The Traders Spread may earn a commission at no cost to you. The event we marked is the Core PCE year-over-year book. The two legs that carry almost all of the price are the 3.1 percent bucket and the 3.0 percent bucket.
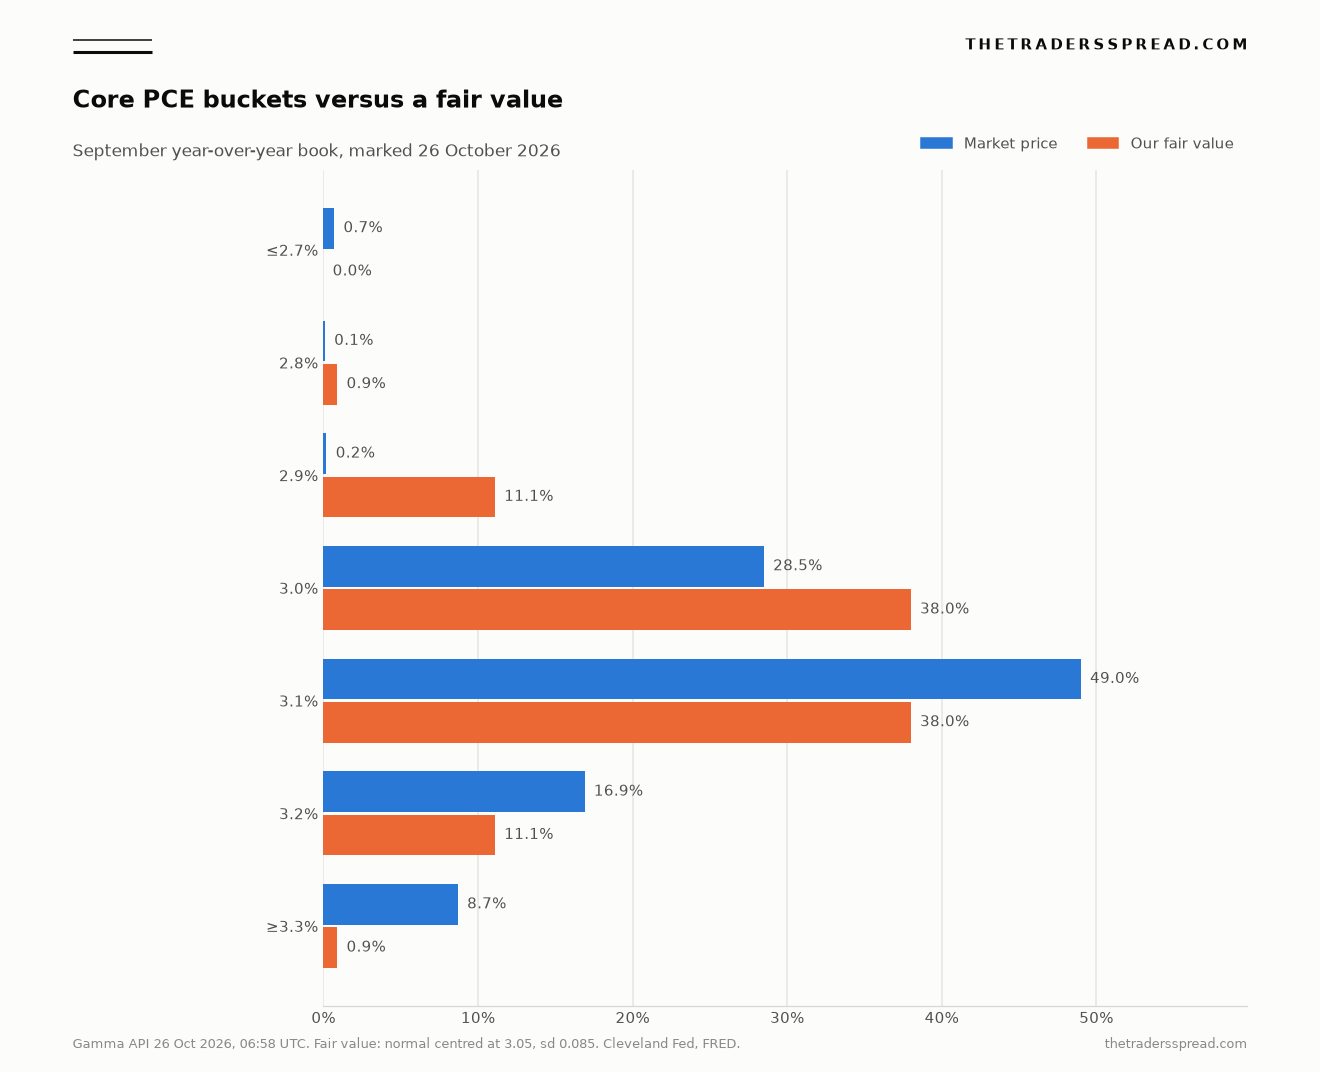
| Bucket | Yes price | Fair value | Volume | Bid / ask |
|---|---|---|---|---|
| 2.7% or lower | 0.65% | 0.0% | $2,620 | 0.2¢ / 1.1¢ |
| 2.8% | 0.05% | 0.9% | $547 | empty bid / 0.1¢ |
| 2.9% | 0.20% | 11.1% | $2,720 | 0.1¢ / 0.3¢ |
| 3.0% | 28.5% | 38.0% | $13,728 | 27¢ / 30¢ |
| 3.1% | 49.0% | 38.0% | $7,567 | 48¢ / 50¢ |
| 3.2% | 16.9% | 11.1% | $2,139 | 14.3¢ / 19.5¢ |
| 3.3% or higher | 8.65% | 0.9% | $1,270 | 6.0¢ / 11.3¢ |
Volume in the table is rounded to the dollar. The 3.0 percent leg has done $13,727.93 of the $30,590.75 event total, and the 3.1 percent leg has done $7,566.60.
1) A one-decimal print cuts the ladder
The contract pays on the year-over-year change in the price index for personal consumption expenditures excluding food and energy, seasonally adjusted, as the Bureau of Economic Analysis reports it in Personal Income and Outlays. The market text in the gamma file says the news release prints that rate to one decimal, and that the headline all-items rate is a separate figure. For the September book the scheduled release is 29 October 2026 at 08:30 Eastern time. Gamma's end time is 13:30 UTC the same day.
One decimal is the whole game. A true rate of 3.04 and a true rate of 3.06 settle different buckets. Under a half-up fence, 2.95 up to the line just under 3.05 prints as 3.0, and 3.05 up to the line just under 3.15 prints as 3.1. A rate under 2.75 is the open low leg, and a rate of 3.25 or above is the open high leg. A continuous distribution puts zero mass on the fence itself, so a printed x.x5 tie leaves the bucket probabilities unchanged.
If the September figures are still missing on the scheduled morning, the market can stay open until the next Personal Income and Outlays release is due, and then it resolves on the latest month that has a figure. The risk is which month the contract words refer to. Filing a proposal, and the dispute window after it, is covered in how a Polymarket resolution is proposed and disputed. The first-print problem on the CPI ladder is a different question, answered in why US CPI markets miss the first print.
2) The nowcast goes quiet once the CPI is in
We use the Cleveland Fed nowcast as the centre because it is built for the gap between the CPI release and the Core PCE release. On the table updated 23 October 2026, September Core PCE is 3.05 percent on the year and 0.28 percent on the month. The CPI cells on that row are blank, which the page defines as a month already released. The headline consumption-price nowcast, still open, is 3.60 percent on the year and 0.47 on the month. A hot headline and a core rate near 3.05 sit in the same row.
The FAQ on that page explains the quiet. Core nowcasts update when a CPI or a consumption-price index arrives, because the model maps the newer CPI month into Core PCE while the consumption-price month is still missing. Oil moves the headline cells between those releases, and the core cell waits for the next print. By 23 October the September CPI was already inside the 3.05, and the next core revision the FAQ describes is the release that settles the contract.
The Cleveland Fed posted the pre-release version of this habit the day before the CPI came out. The post names a CPI nowcast. Core PCE is a separate cell, and the size of the miss is a useful scale for how tight a tenth is.
Our #CPI indicator updates tomorrow. The Cleveland Fed’s #inflation nowcasting model (updated daily!) predicts year-over-year CPI #inflation of 3.60% in September. Check it out: https://t.co/9PmFKwnCLP pic.twitter.com/3cbDqnbORK
— Cleveland Fed (@ClevelandFed) October 13, 2026
The print the next morning was 3.7 percent, a tenth above the 3.60 the post named, and a tenth is one bucket on this ladder.
3) The year-ago month sets the tenth
A 0.28 percent month sits on a base: the new index divided by the index of a year earlier. We downloaded FRED series PCEPILFE on 26 October. August 2026 is 130.455, September 2025 is 126.940, and July 2026 is 130.133. August therefore rose 0.247 percent, which the BEA release of 30 September reported as 0.2 percent, and it stands 3.008 percent above August 2025 at 126.646, reported as 3.0 percent. Apply 0.28 percent to 130.455 and the implied September index is 130.820. Divided by 126.940, the year-over-year rate is 3.057 percent, or 3.06 at two decimals, against the published nowcast cell of 3.05. We centre on 3.05 and treat 3.06 as a check that the month and the year agree.
September 2025, the month that drops out, rose from 126.646 to 126.940, or 0.232 percent. The new month on the nowcast is a little faster, so the year-over-year rate edges up from 3.0 and stays within a few hundredths.
4) Core CPI and Core PCE weigh different baskets
Once the CPI is out, what remains is the translation between the cores. BEA's FAQ 555 sorts the gap into formula, weights, scope and a residual: a Fisher index of spending by and on behalf of households, against a modified Laspeyres index of out-of-pocket urban spending. Shelter and third-party medical care are the usual wedges. In September, shelter rose 0.4 percent on the month and 3.2 percent on the year, owners' equivalent rent rose 0.3 percent, and CPI medical care rose 0.1 percent. Housing weighs less in Core PCE, so core CPI can move from 2.4 to 2.6 while the Core PCE nowcast moves from 3.0 to 3.05.
We measured the miss from the files, because the FAQ still lists shrinking error bands as work to be done. The series are the monthly percent changes in PCEPILFE and in FRED's core CPI, CPILFESL, and we kept a month only when both indexes exist for that month and the calendar month before it. October 2025 is missing from the CPI file. The nowcast page ties that hole to the suspended October 2025 CPI release, so October and the November change that needed it as a base stay out. The other 24 gaps, July 2024 through August 2026, average four thousandths of a point and have a standard deviation of 0.085. The fair value uses that 0.085.
5) A gasoline spike can leave the core book still
September gasoline rose 9.1 percent on the month and 34.2 percent on the year. Energy rose 5.2 percent on the month and 20.4 percent on the year. The all-items index went from a 3.4 percent year-over-year rate in August to 3.7 percent in September. The Bureau of Labor Statistics put the gasoline figure in its own post on 18 October. That post is the part of the CPI report a Core PCE contract is written to set aside.
Prices for gasoline increased 34.2 percent over the year ended September 2026 #BLSData https://t.co/hUfH9xEXg7 pic.twitter.com/y1WDnBu1FP
— BLS-Labor Statistics (@BLS_gov) October 18, 2026
Energy also leaks into core through a slower channel, via airfares, delivery costs and fuel-using services. Airline fares in the September CPI were up 22.4 percent on the year and 1.2 percent on the month. That leakage is already inside the core CPI the Cleveland model has seen, so adding the gasoline print on top of the nowcast would count it twice.
6) Release morning can still revise the base
The 30 September release was the annual update, and BEA said revisions to personal income and outlays begin with January 2021. The September release can still change the September 2025 denominator or the August 2026 starting level. The size of either revision is unknown, and the fair value leaves it out. The 3.0 percent August rate is the current official figure, and the next release is allowed to retouch it. A bucket priced as if that 3.0 were fixed misses the habit.
7) A thin book moves the price on its own
Macro shares the price with the book itself. The seven yes prices sum to 103.95 percent. Strip that overround and the 3.1 percent leg is 47.1 percent of the yes-price total, while the 3.0 percent leg is 27.4 percent, so the ranking holds and the levels move by less than two points. Overround explains a small slice of the richness on the highest-priced leg and leaves an 11 point gap against a 38 percent fair value.
Related97.8% Bank of Japan No-Change Odds Sit Above Fair Value
The wings are where a last-trade column misleads. The 3.2 percent leg is marked at 16.9 percent, between a 14.3 cent bid and a 19.5 cent ask, while the last trade was 7.2 cents. The 3.3-and-higher leg is an 8.65 percent mark between 6.0 and 11.3 cents. The 2.8 percent leg shows an ask of a tenth of a cent and an empty bid.
The 3.1 percent leg is the cleanest quote and the thinnest: 48 cents bid, 50 cents ask, last trade 48 cents, outcome price 49 percent, and $933 of liquidity against $1,819 on the 3.0 percent leg. A few thousand dollars can walk it from 48 to 50 with the macro picture unchanged. Day volume of $256 says almost nobody did that on the morning we pulled the file. Week volume of $8,501 says the price was set earlier, around the CPI, and has sat there since.
| Input | Reading | Source and date |
|---|---|---|
| August Core PCE, year over year | 3.0% | BEA, 30 September 2026 |
| August Core PCE, month | 0.2% (index 0.247%) | BEA, and FRED PCEPILFE 130.455 |
| September core CPI, year over year | 2.6% | BLS, 14 October 2026 |
| September core CPI, month | 0.3% (index 0.335%) | BLS, and FRED CPILFESL 338.896 |
| September Core PCE nowcast | 3.05% year, 0.28% month | Cleveland Fed, updated 23 October 2026 |
| Index bridge | 3.06% | 130.455 times 1.0028, over 126.940 |
| CPI-to-Core PCE monthly gap | mean +0.004 point, sd 0.085 | 24 one-month gaps, July 2024 to August 2026 |
Where the 3.1 percent leg sits
A normal distribution centred at 3.05, with a standard deviation of 0.085 of a point, puts 38.0 percent on each of the 3.0 and 3.1 buckets, 11.1 percent on 2.9 and on 3.2, and 0.9 percent on the two outer buckets, with the lowest leg rounding to 0.0. The fair value we attach to the 3.1 percent leg is 0.380. The market has that leg at 0.49, and at 47.1 after stripping the 103.95 percent sum of yes prices. Both sit above the most mass one tenth can hold under this scatter. A 0.10 point window is 1.17 standard deviations wide, and with the centre in the middle of the bin it holds 44.3 percent. The 3.1 percent price is above that cap.
Pushing the centre up with the CPI translation, rather than the Cleveland cell, stays on the same side. The unrounded September core CPI month is 0.335 percent. Add the 0.004 point average gap, apply 0.339 percent to 130.455, and divide by 126.940. The year-over-year rate is 3.12 percent, and fair value on the 3.1 percent bucket rises only to 43.5 percent. We keep 3.05 as the centre. The reading flips only if the error is much tighter than the files show: about 0.043 of a point would lift the 3.1 percent fair value to 49 on a centre of 3.05. The Cleveland page still lists error bands as unfinished work, so 0.043 is a threshold from the market price, separate from the 0.085 we measured. The mirror leg is 3.0 percent, at 28.5 against a 38.0 fair value, while 0.2 percent sits on the tenth below the fence. The book's doubt is piled on the high side of a nowcast that sits on it.
What does a Core PCE bucket pay on?
A Core PCE bucket pays if the Bureau of Economic Analysis reports that tenth for the year-over-year change in the price index excluding food and energy. The September book uses Personal Income and Outlays, to one decimal, at 08:30 Eastern time on 29 October 2026. If that report slips, the contract can stay open until the next release and then use the latest month that has a figure.
How does a 3.05 nowcast land on two buckets at once?
The Cleveland Fed prints 3.05 for September Core PCE, year over year, on the table updated 23 October 2026. A one-decimal release rounds at the half-tenth, so 3.05 is the shared edge of the 3.0 and 3.1 buckets. A symmetric distribution centred there puts the same probability on each of those two tenths. With the 0.085 point scatter, that shared probability is 38.0 percent, and the 2.9 and 3.2 percent buckets take 11.1 percent each.
Why is core CPI at 2.6 percent while the Core PCE nowcast is 3.05?
Core CPI was 2.6 percent for the year to September, after 2.4 percent in August, while August Core PCE was 3.0 percent. The September nowcast of 3.05 narrows a 0.6 point gap to 0.45. BEA traces such gaps to formula, weights, scope and a residual: shelter weighs more in the CPI, and employer-paid medical care sits in Core PCE. A hotter shelter month passes through only in part.
What would lift the 3.1 percent fair value up to the market price?
On a centre of 3.05, that bucket reaches a 49 percent fair value only if the error shrinks to about 0.043 of a point. The scatter we measured is 0.085, and the most a single tenth can hold at that width is 44.3 percent. The Cleveland Fed still lists error bands as future work, so the band stays where the gaps put it. A higher centre, near 3.12 percent, still leaves the bucket at 43.5 percent.
Where did these prices and index levels come from?
The bucket prices are outcomePrices from the Polymarket gamma API for core-pce-yoy-september-2026, saved at 06:58 UTC on 26 October 2026. The nowcast is the Cleveland Fed inflation-nowcasting table, updated 23 October. The August print is the BEA release of 30 September 2026. The index levels are FRED series PCEPILFE and CPILFESL, downloaded the same day. Every odds figure above comes from that gamma file.
Nothing here is a recommendation to take either side of a contract. The fair value is a desk calculation from the public sources named above, and a different error band would move it.