

Is the Core CPI bucket that traders are marking actually cheap against the last official print? On 17 November 2026 the busiest year-over-year leg, the one that pays if the Bureau of Labor Statistics prints 2.9 percent, was marked at 33.5 cents on Polymarket. A flat reading of the latest unadjusted core index already rounds to 2.9 percent, and a resample of recent seasonally adjusted months through November's usual seasonal gap puts that print at 47.9 percent. The traded price sits below that fair value.
The contract is the Core CPI year-over-year ladder still open on Polymarket. Links to Polymarket are affiliate links, from which The Traders Spread may earn a commission at no cost to you. Gamma, read the same day, showed the event active and unclosed, with about $14,661 of volume and about $17,947 of liquidity across ten buckets. The 2.9 percent leg alone had about $4,113 of volume, the most of any bucket, inside a book bid at 32 cents and offered at 35.
1. The rules the ladder actually uses
Resolution is the percentage change in the Consumer Price Index for All Urban Consumers excluding food and energy over the twelve months ending in the reference month, before seasonal adjustment, as the monthly Bureau of Labor Statistics report states it. The source named on the event is the CPI news release, which prints that core twelve-month change to one decimal. A calculation that lands at 2.87 percent and a release that prints 2.9 percent are the same outcome for this ladder. Headline all-items CPI is a different series, and the rules say so.
The scheduled release named in the rules is 10 December 2026 at 8:30 Eastern time, which is 13:30 UTC. The October news release, USDL-26-1685, published 10 November 2026, set the following CPI release for that Thursday morning. Gamma's end date on the event is that instant. A mark on a speech, a revision, or the seasonally adjusted monthly change is a mark on a different object.
A delay clause sits on a hole in the record. If the scheduled morning passes with no figure, the market may stay open until the following CPI report's scheduled time, and a still-missing figure resolves on the most recent previous month that has the data. That month is September, at 2.6 percent, because October's twelve-month core rate was withheld after October 2025 went uncollected. The 2.6 percent bucket was marked at 4.0 cents on about $2,428 of volume. The paths below assume the December release lands on time.
How a proposal becomes a payout, if the release is messy, is a process question rather than an inflation question. The desk has already walked through how a proposal and a dispute settle a contract. What belongs here is the input the proposal would have to cite: one decimal, unadjusted, core, from the monthly news release.
2. The last core print BLS was willing to publish
The line everyone repeats from October is a monthly change. The Bureau said all items less food and energy rose 0.3 percent, as in September and August, seasonally adjusted, while all items rose 0.4 percent after 0.6 percent in September. Shelter rose 0.3 percent and accounted for over thirty percent of that all-items increase, with owners' equivalent rent up 0.3 percent and rent of primary residence up 0.2 percent. Used cars and trucks fell 1.2 percent after a 0.7 percent rise in September, while recreation rose 0.8 percent and medical care rose 0.3 percent.
The Bureau of Labor Statistics posted that October release the morning it came out.
CPI for all items increases 0.4% in October; shelter rises #BLSData https://t.co/gGc3ktAAGE
— BLS-Labor Statistics (@BLS_gov) November 10, 2026
The post matches the all-items line in the release and links the archived copy. It is silent on a twelve-month core rate. In a boxed note, the October release says the Bureau did not collect survey data for October 2025 because of a lapse in appropriations, could not publish October 2025 indexes for most series, and therefore cannot publish twelve-month percent changes for October 2026 where the year-ago index is missing. The all-items index itself was published at 337.511, up 0.2 percent before seasonal adjustment in the month, and that level is the wrong index for this ladder.
The ladder uses series CUUR0000SA0L1E, all items less food and energy, CPI-U, U.S. city average, unadjusted, 1982-84=100. The public data page, opened 17 November 2026, shows October 2026 at 339.921, September 2026 at 339.287, and November 2025 at 330.425, with October 2025 as a dash and an X footnote. From September to October the unadjusted core index rose 0.187 percent, which the Bureau rounds to 0.2 percent. The adjusted sister series, CUSR0000SA0L1E, rose from 338.896 to 339.900, or 0.296 percent, which the release rounds to 0.3 percent. The twelve-month core rate for October is the cell the release withholds.
The last twelve-month core rate that does exist is September. The 14 October 2026 release, USDL-26-1574, said the all items less food and energy index rose 2.6 percent over the year, following a 2.4 percent increase over the twelve months ending August. The table puts the unadjusted core index at 339.287 for September 2026 against 330.804 a year earlier, and prints 2.6 in the twelve-month column. Dividing those levels gives 2.564 percent, which rounds to the published 2.6. August's pair, 338.041 over 329.970, is 2.446 percent and rounds to the 2.4 percent that release cited. Relative importance on that table lists all items less food and energy at 79.075, so the contract covers about four-fifths of the basket.
| Fact folded from the release and the index | Figure | Where it was read |
|---|---|---|
| Last published core twelve-month change | 2.6 percent, through September 2026 | BLS CPI news release, 14 October 2026 |
| Prior published core twelve-month change | 2.4 percent, through August 2026 | Same September release, citing August |
| October core, seasonally adjusted | 0.3 percent (index 338.896 to 339.900) | October release, 10 November 2026; CUSR0000SA0L1E |
| October core, unadjusted | 0.2 percent (index 339.287 to 339.921) | CUUR0000SA0L1E data page, 17 November 2026 |
| October core twelve-month change | Unpublished; October 2025 index missing | October release, boxed note |
| November 2025 unadjusted core index, the contract's base | 330.425 | CUUR0000SA0L1E data page |
| A November 2026 index left exactly at 339.921 | 2.874 percent, which prints as 2.9 | 330.425 into 339.921 |
| November unadjusted-minus-adjusted gap, 2018 to 2024 | Minus 0.185 to minus 0.229 points, mean minus 0.209 | CUUR and CUSR, same pull |
| 2.9 percent leg, yes mark, volume, book | 33.5 cents; about $4,113; 32 to 35 cents | Gamma, 17 November 2026 |
| Fair value used on that leg | 47.9 percent | 140-path resample in section 4 |
3. One tenth of Core CPI, measured in index points
Because the contract pays on a rounded tenth, the interesting object is the width of each bucket in index points, measured from the November 2025 base of 330.425. One tenth of one percent of that base is 0.330 index points. Half a tenth, the rounding boundary, is about 0.165 index points. From the October level of 339.921, the boundaries fall out as month-on-month unadjusted changes.
A published 2.9 percent needs an unrounded twelve-month change from 2.85 percent up to, but short of, 2.95 percent: an index from 339.842 up to 340.173. From October's 339.921 that is an unadjusted move from minus 0.023 percent to plus 0.074 percent. A 3.0 percent print needs plus 0.074 to plus 0.171 percent. A 2.8 percent print needs a decline from minus 0.120 to minus 0.023 percent. A 3.1 percent print needs plus 0.171 to plus 0.268 percent, and the 2.6 percent delay-clause bucket needs a decline of roughly 0.22 to 0.32 percent.
Leave the October index exactly where it is and the twelve-month rate is 339.921 divided by 330.425, minus one: 2.874 percent. The same half-up rounding that turned September's 2.564 percent into a published 2.6 turns 2.874 into 2.9. The 2.9 percent bucket is the one an unchanged index already occupies. A ladder with 33.5 cents on 2.9 and 34.0 cents on 3.0 looks like a split around a knife edge, and the seasonal gap places that edge on the 2.9 side of the two prices.
Settlement uses the unadjusted core index, not the 0.3 percent seasonally adjusted change that led the October release. For each November from 2018 through 2024 both indexes exist, and the gap, unadjusted monthly change minus adjusted, runs minus 0.185, minus 0.200, minus 0.197, minus 0.213, minus 0.214, minus 0.228 and minus 0.229 percentage points, a mean of minus 0.209 inside a four-hundredths range that held in 2021 as well as in the quieter years. November 2025 stays out of the set because October 2025 is the missing cell, so seven Novembers are the record.
Apply the mean gap to October's own adjusted pace. The adjusted core rise in October was 0.296 percent. Subtract 0.209 and the implied unadjusted November change is plus 0.087 percent. The 3.0 percent bucket starts at plus 0.074 percent, so a carbon copy of October's adjusted pace, translated by the average November gap, scrapes into 3.0 percent by about one hundredth of a point. That single path is why the 3.0 percent leg deserves weight. The fair value below asks how often the recent adjusted record, paired with the actual November gaps, lands in each tenth.
4. A fair value built only from the official series
The resample uses the two BLS series and the bucket boundaries above. Every computable seasonally adjusted core monthly change from January 2025 through October 2026, twenty of them on CUSR0000SA0L1E, is paired with each of the seven November gaps. October 2025 and November 2025 drop out with the missing index, and nothing is filled in for them. Each of the 140 paths, weighted equally, adds a gap to an adjusted change, steps forward from the October unadjusted index of 339.921, divides by 330.425, and rounds half-up to one decimal.
The nine computable 2025 changes span 0.069 to 0.427 percent. The ten inside 2026 are 0.295, 0.216, 0.196, 0.377, 0.208, minus 0.017, 0.215, 0.290, 0.335 and 0.296. August through October average 0.307 percent. The median of those ten 2026 changes is 0.253 percent, and subtracting the mean November gap of 0.209 leaves an unadjusted change near 0.044 percent, inside the 2.9 percent band. October's own 0.296 percent still scrapes into 3.0, and June's minus 0.017 percent is the path that falls toward 2.6.
Out of 140 paths the counts are: 2.6 percent, 4 paths, 2.9 percent of the distribution; 2.7 percent, 9 paths, 6.4 percent; 2.8 percent, 10 paths, 7.1 percent; 2.9 percent, 67 paths, 47.9 percent; 3.0 percent, 40 paths, 28.6 percent; 3.1 percent, 10 paths, 7.1 percent. No path printed 2.5 percent or lower, and no path printed 3.2 percent or higher. The 2.9 percent bucket is the mode, and its fair value as a probability is 0.479. A check that uses only the ten adjusted changes from 2026, still paired with all seven gaps, puts 45.7 percent of those 70 paths on 2.9 percent and 37.1 percent on 3.0 percent. The mode survives the shorter window, with still less weight on 2.8 and 3.1.
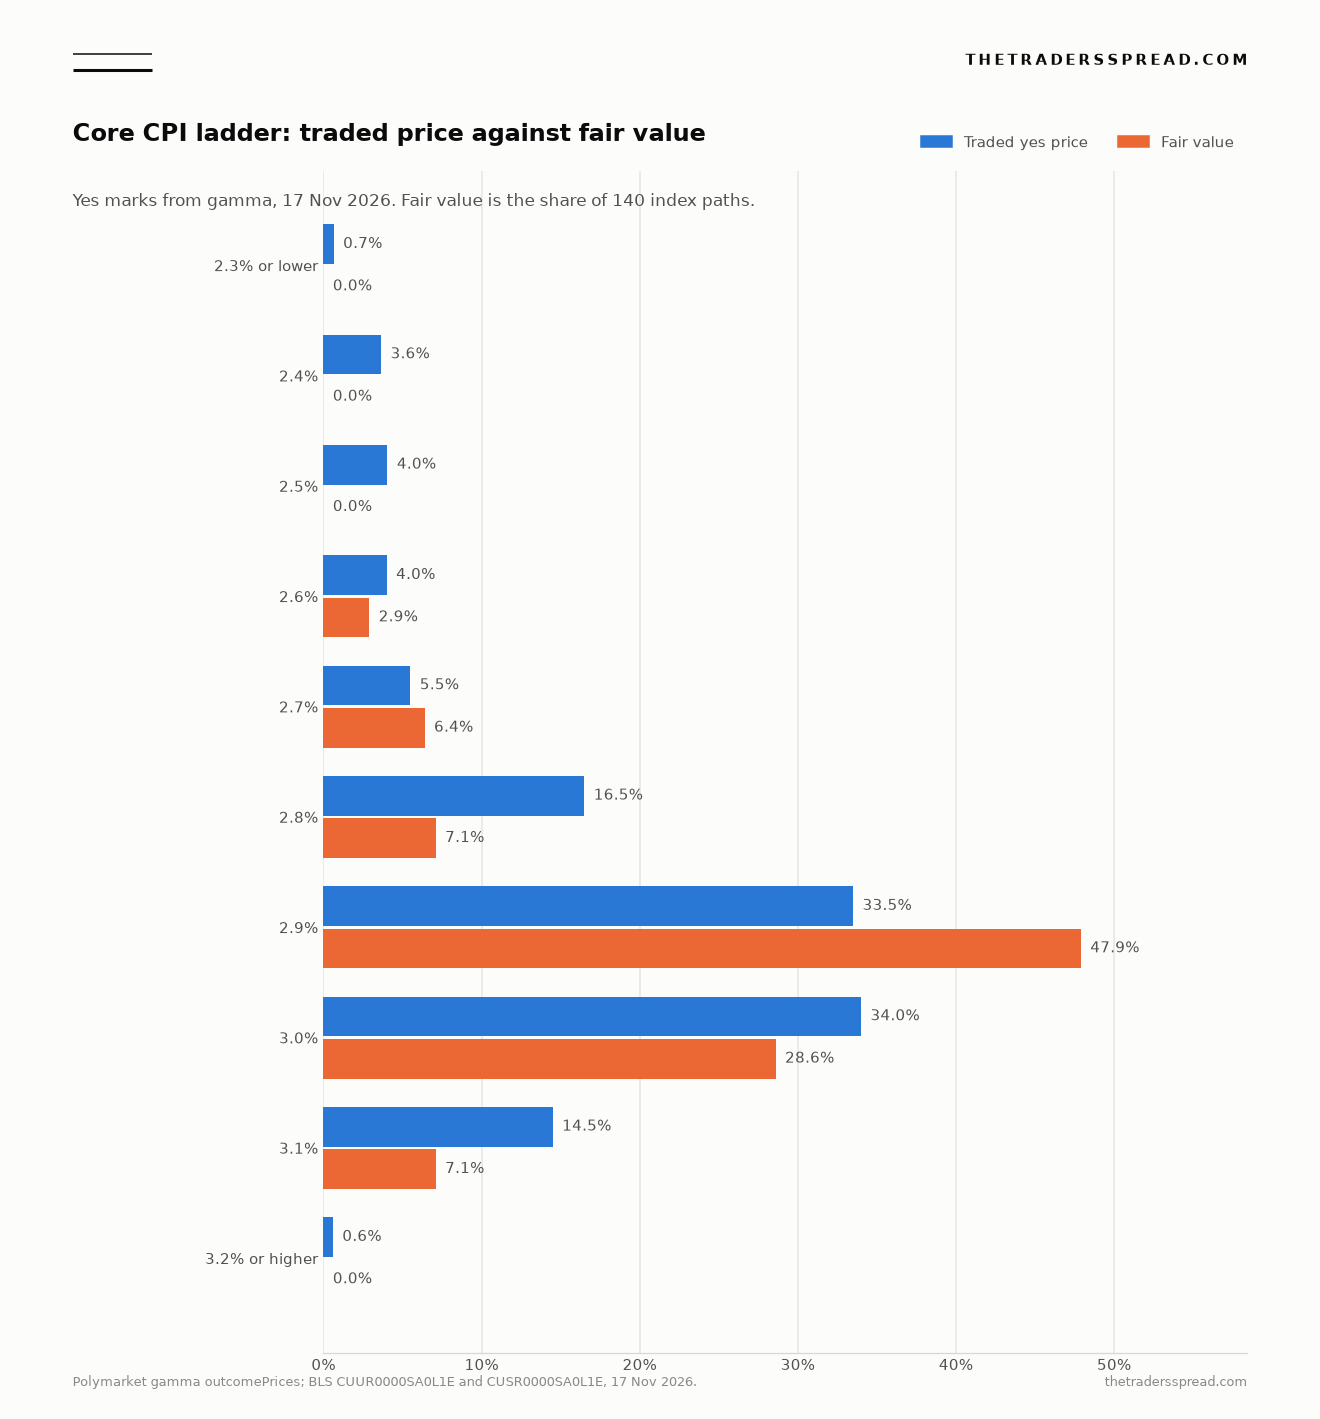
The chart rounds each gamma yes mark to one decimal, so 0.65 cents of price displays as 0.7 percent and 3.65 displays as 3.6. The table below keeps the gamma mark to two decimals. Fair-value bars are the 140-path shares, and on the 2.9 percent row that bar is the longer one, while the 3.0 percent row is the close one.
RelatedOpenAI's IPO Ladder Measures Only a First-Day Close
5. Where the traded price sits against that fair value
Gamma's yes marks on 17 November 2026, converted from the outcome price, were 0.65 percent for 2.3 or lower, 3.65 for 2.4, 4.05 for 2.5, 4.0 for 2.6, 5.5 for 2.7, 16.5 for 2.8, 33.5 for 2.9, 34.0 for 3.0, 14.5 for 3.1, and 0.6 for 3.2 or higher. Those ten marks sum to 116.95 cents. The extra 16.95 cents are the overround, so one share of every bucket costs more than the dollar that exactly one of them pays. The right check is the traded price of a leg against an independent probability, and then whether a pro-rata haircut changes the conclusion.
The 2.9 percent leg carries the volume, and its yes mark of 33.5 cents sits 14.4 points under a 47.9 percent fair value. A pro-rata cut of the 116.95-cent overround leaves that leg with a 28.6 percent share, further below 47.9, so the vig widens the gap. The book agrees with the mark: 32 cents bid, 35 offered, last trade 32. The 3.0 percent neighbour, at 34.0 cents against a 28.6 percent fair value, sits above fair inside a 32 to 36 cent book with the last trade at 31. The index path gives 2.9 percent the ordinary recent month and gives 3.0 percent the firmer ones, October included.
| Bucket | Yes mark | Volume | Liquidity | Fair value | Fair minus mark |
|---|---|---|---|---|---|
| 2.3 percent or lower | 0.65% | $631 | $4,532 | 0.0% | minus 0.7 points |
| 2.4 percent | 3.65% | $181 | $817 | 0.0% | minus 3.7 points |
| 2.5 percent | 4.05% | $172 | $772 | 0.0% | minus 4.1 points |
| 2.6 percent | 4.0% | $2,428 | $1,854 | 2.9% | minus 1.1 points |
| 2.7 percent | 5.5% | $1,028 | $844 | 6.4% | plus 0.9 points |
| 2.8 percent | 16.5% | $1,402 | $710 | 7.1% | minus 9.4 points |
| 2.9 percent | 33.5% | $4,113 | $1,125 | 47.9% | plus 14.4 points |
| 3.0 percent | 34.0% | $2,402 | $691 | 28.6% | minus 5.4 points |
| 3.1 percent | 14.5% | $1,856 | $981 | 7.1% | minus 7.4 points |
| 3.2 percent or higher | 0.60% | $450 | $4,532 | 0.0% | minus 0.6 points |
Volume and liquidity in the table are gamma's figures rounded to the nearest dollar, and a positive gap means the traded yes mark sits below the resampled fair value. The expensive prices are the shoulders. The 2.8 percent leg at 16.5 cents has a 7.1 percent fair value, a gap of 9.4 points the other way, on about $1,402 of volume and a wide book bid at 11 cents and offered at 22. The 3.1 percent leg at 14.5 cents has the same 7.1 percent fair value, on about $1,856 of volume, bid 11 and offered at 18.
The 2.3-or-lower and 3.2-or-higher legs, marked at 0.65 and 0.60 cents, each hold roughly $4,500 to $4,700 of liquidity against a few hundred dollars of volume, and the resample gives them no paths inside the 2025-26 adjusted record. The book that has actually traded is the 2.9 percent leg at the centre of the ladder.
A bucket market can look precise while hiding which reading it will accept. The same desk has shown how one producer-price bucket can sit on top of several different readings, and why a CPI contract can miss the first print people thought they were trading. This ladder names all items less food and energy and points at the news release's one-decimal line, so the headline-versus-core mix-up is written out of the rules, while the seasonal mix-up remains. Carrying the 0.3 percent adjusted pace straight into an unadjusted November print over-weights 3.0 and 3.1, and under-weights the tenth an unchanged index already occupies.
The call is on the leg with the volume. The 2.9 percent yes mark of 33.5 cents sits below a 47.9 percent fair value. The 3.0 percent leg, at 34 cents against 28.6 percent, sits above fair, close enough that a run of adjusted prints like October's would pull the two legs together. The 2.8 and 3.1 legs sit further above fair. Fair value on 2.9 percent would move down toward the traded price if adjusted core changes clustered near 0.35 percent or firmer, or if the November gap came in much smaller than the minus 0.19 to minus 0.23 range that held from 2018 through 2024. Another month like the softer 2026 prints near 0.20 percent adjusted would push fair value further above the traded price. The released number, on the morning of 10 December, is the only print that ends the argument.
Questions the release schedule forces
Which published line settles a Core CPI bucket?
The event rules name the monthly CPI news release and the twelve-month change in CPI-U all items less food and energy, before seasonal adjustment, to one decimal. September is the template: the Bureau printed 2.6 percent, and 339.287 over 330.804 equals 2.564 percent, which rounds to that tenth. A ratio the release rounds to 2.9 settles the 2.9 percent bucket. The adjusted 0.3 percent and the all-items 0.4 percent sit outside the clause.
Does the missing October 2025 index empty the November contract?
November 2025 is on the CUUR0000SA0L1E page at 330.425, so the year-ago denominator exists. October 2025 is the dashed cell, which is why the Bureau withheld an October 2026 twelve-month core rate. The December release can still divide a new November index by 330.425 and print one decimal. A missed release, carried to the following CPI date, would fall through to September's published 2.6 percent.
Why set a cents price next to a percent fair value?
The yes mark is the price of a contract that pays one dollar if that tenth is the printed one, so 33.5 cents is already a 33.5 percent quote before any model. Fair value is the share of 140 official-series paths that round to the same tenth, 47.9 percent. The ten yes marks sum to 116.95 cents, and a pro-rata cut of that overround lowers the 2.9 percent share to 28.6 percent, which widens the gap.
The figures above are research for information. They are not a recommendation to take either side of a contract, and money placed on a prediction market can be lost in full.