

I have sat through enough US GDP mornings on this desk to treat the third estimate as a different object from the number a growth bucket pays. The contracts on the board were written for an earlier page, and for a growth rate that is easy to mix up with the one on the chyron.
Two official figures for 2025 already show the split. In the September Summary of Economic Projections the actual change in real GDP is 2.0 percent, defined as the fourth quarter compared with the fourth quarter a year earlier. The annual-average rate, the percent change from the 2024 level to the 2025 level, is 2.3 percent on FRED series A191RL1A225NBEA, retrieved 29 October 2026. Compounding the published quarterly rates gives 2.03 percent on a fourth-quarter basis, in line with the 2.0 after ordinary rounding.
The second quarter of 2026 makes the vintage point in one row. The advance and the second estimate both had real GDP at a 1.5 percent annual rate. The third estimate, published 30 September, had it at 2.2 percent. A quarterly bucket written the way the live third-quarter market is written would have settled on 1.5 and left 2.2 outside the payoff.
Updated 29 October 2026.
Key facts
- Real GDP rose at a 2.2 percent annual rate in the second quarter of 2026 on the third estimate, 0.7 point above the 1.5 percent advance and second estimate (BEA, 30 September 2026).
- That release revised the first quarter to 2.5 percent from 2.1 percent, inside the 2026 annual update (BEA, 30 September 2026).
- Average absolute revisions in quarterly real GDP growth, 1996 through 2025, are 0.5 point from advance to second, 0.6 from advance to third, and 0.3 from second to third (BEA additional-information page, retrieved 29 October 2026).
- The full-year Polymarket event resolves on the fourth-quarter advance, the change from the 2025 annual level to the 2026 annual level, with about $89,436 of volume and about $6,036 of liquidity (Polymarket Gamma, 29 October 2026, 07:22 UTC).
- The 2.0 to 2.5 percent leg was marked at 56 percent, bid 49 and ask 63, last trade 49 (Polymarket Gamma, 29 October 2026, 07:22 UTC).
- Atlanta Fed GDPNow for the third quarter of 2026 was 3.3 percent on 28 October, with a 0.77 point average absolute error and a 1.17 point root-mean-squared error against advance estimates from 2011 Q3 through 2025 Q2 (Atlanta Fed GDPNow, retrieved 29 October 2026).
- The FOMC median for 2026 real GDP growth was 2.3 percent, fourth quarter to fourth quarter, central tendency 2.2 to 2.4 and range 2.1 to 2.6 (Summary of Economic Projections, 16 September 2026).
What the bracket is written to read
Two US GDP books were open on Polymarket when these prices were filed, and they ask different questions under one label. Links to Polymarket are affiliate links, from which The Traders Spread may earn a commission at no cost to you. The durable book is the full-year 2026 ladder. Gamma at 07:22 UTC on 29 October says it resolves on the seasonally adjusted real GDP growth rate for 2026 in the BEA advance release for the fourth quarter, which the text places in January 2027. The line that counts is the percent change from the 2025 annual level to the 2026 annual level, and later revisions sit outside it. The end date is 29 January 2027.
Mids from that read: 0.45 under 0.5 percent, 0.25 on each of the next two brackets, 2 on 1.5 to 2.0, 56 on 2.0 to 2.5, and 39.6 above 2.5. The Gamma yes price above 2.5 was 0.3955. An exact 2.5 settles the top bracket even though its question says greater than 2.5 percent.
The third-quarter 2026 ladder was still open at that 07:22 UTC read, with an end date of 30 October at 03:59 UTC. It names the seasonally adjusted annualized advance scheduled for 29 October and sets later revisions outside the resolution. The shorter slug, us-gdp-growth-in-q3-2026, returned an empty list, and the live event uses a longer one. After the release the book can be a settled archive.
Three vintages, one of which pays
BEA's additional-information page, retrieved 29 October 2026, describes three current-quarterly estimates: an advance on incomplete data near the end of the first month after the quarter, a second estimate about a month later, and a third about a month after that. For the third quarter of 2026 the schedule lists 29 October, 25 November and 23 December, each at 8:30 Eastern. The October morning also carries September personal income and outlays, so a Core PCE bucket and a GDP bucket can share the half hour.
| Axis | Advance | Second | Third |
|---|---|---|---|
| Timing | End of the first month after the quarter | About a month later | About a month after the second |
| Source data | Still incomplete | More detailed | More comprehensive |
| Average absolute move from the prior vintage | First vintage | 0.5 point from the advance | 0.3 point from the second |
| Average absolute move from the advance | Zero by definition | 0.5 point | 0.6 point |
| GDI and corporate profits | Held back | Included for the first three quarters | Included, and for a fourth quarter this is their first appearance |
| Industry, gross output, state GDP | Later release | Later release | Published here |
| Quarterly growth bucket | The figure the rules name | Outside the payoff once an advance exists | Outside the payoff once an advance exists |
| Full-year 2026 bucket | Annual percent change inside the fourth-quarter advance | A later second estimate leaves the payoff fixed | A later third estimate leaves the payoff fixed |
A 0.6 point advance-to-third gap is wide enough to carry a print from the middle of 2.0 to 2.5 across the line. The later vintage is a real economic number, and the contract assigns it to a different question.
BEA withholds an advance estimate of GDI and of corporate profits, and for a fourth quarter both wait until the third estimate. Industry GDP, gross output and state GDP wait with them. A bucket scored on the advance is fixed before that December-style morning.
The second quarter now holds all three vintages in one table. Real GDP went 1.5, 1.5, 2.2. Real final sales to private domestic purchasers went 3.9, 4.2, 4.6, and real GDI, absent from the advance, went from 2.2 to 2.6. PCE excluding food and energy went 3.4, 3.6, 3.3, so the growth cell and a core price cell moved in different directions after the advance was already public.
The technical note traces that 0.7 point to late surveys, among them Census inventories and construction, farm stocks, and remodelers' payrolls. An advance-estimate rule leaves that pass outside the payoff. A CPI bucket that follows the first print, a PPI bucket, and a payrolls bucket each carry a revision window the price can mistake for the settlement vintage.
BEA News posted the third estimate on 30 September. Here the advance and the second estimate were both 1.5, and the entire 0.7 point arrived on the third estimate, against an average second-to-third gap of 0.3 point.
The U.S. economy grew at a 2.2% annualized rate in Q2, up from the 1.5% rate estimated a month ago.
— BEA News (@BEA_News) September 30, 2026
https://t.co/1v8N8mGzhe https://t.co/IH9NCYkTqx #GDP https://t.co/uMXyatuTbA pic.twitter.com/AYKdVEv1hL
The quarter still on the board
The third-quarter ladder, still trading at 07:22 UTC, prices the advance rule directly. Mids run 0.1, 0.3, 1.35, 1.6, 7.5 and 25 percent, then 63 percent above 3.0. The top leg was bid 61 and offered 65, last trade 65, on about $54,938 of volume, inside an event of about $73,136 traded and about $13,715 of liquidity. A print of exactly 3.0 goes to that top bracket.
If the advance page stays empty, the third-quarter rules switch to the first official figure that appears, and if the page is still empty when the next quarter's advance is due, they switch to the latest figure already published. The full-year text read the same morning simply names the fourth-quarter advance. Copying the fallback across would mis-score a delayed January release.
GDPNow is a nowcast of the advance. The Atlanta Fed page, retrieved 29 October, showed 3.3 percent for the third quarter, updated 28 October. The bank calls it a model result with judgmental adjustments left out, and it withholds official-forecast status for the Atlanta Fed, its president, the Federal Reserve System and the FOMC.
The Atlanta Fed posted that 3.3 percent nowcast on 28 October. It is the bank's own running estimate of the advance print the quarterly contract names, on the day before the release.
On October 28, the #GDPNow model nowcast of real GDP growth in Q3 2026 is 3.3%: https://t.co/T7FoDdgYos. #ATLFedResearch
— Atlanta Fed (@AtlantaFed) October 28, 2026
Download our EconomyNow app or go to our website for the latest GDPNow nowcast: https://t.co/JPMzsC5TNo. pic.twitter.com/6hhy5hun2m
Center the advance on 3.3 and spread it with the 1.17 point root-mean-squared error, mean error at zero because the page reports miss size and withholds a bias. About 60 percent of that spread lands at or above 3.0, and about 15 percent lands from 2.5 up to 3.0. The book has 63 and 25, close on the top bracket and richer on 2.5 to 3.0. A quarterly US GDP bucket pays the advance annualized rate, not the figure BEA prints two months later. The third estimate on 23 December is a separate release, and the contract has set it aside.
Why the annual rate is a different object
The full-year contract reads a percent change in annual levels, the average of four quarterly levels, while a quarterly headline is an annualized rate. A 2.5 percent annualized quarter raises the level by about 0.62 percent. That is why 2025 could print 2.0 on a fourth-quarter basis and 2.3 on the annual average.
The first half of 2026 is already in the levels, at 2.5 and 2.2 percent. Chaining FRED series A191RL1Q225SBEA, zero annualized growth in both remaining quarters still leaves an annual-average increase of about 1.80 percent, which is why the brackets under 1.5 percent are priced in tenths. The disagreement that remains sits between 2.0 to 2.5 and above 2.5.
On this chain, one extra point of third-quarter annualized growth adds about 0.12 point to the annual rate, and one extra point in the fourth quarter adds about 0.06. Hold the third quarter at 3.3. A fourth quarter at 2.2 produces an annual average of 2.35 percent, a fourth quarter at 3.3 produces 2.42, and a second half at 4 and 4 produces 2.55. Clearing 2.5, with the third quarter at 3.3, takes a fourth quarter near 4.5 percent annualized.
The September median of 2.3 percent is fourth quarter to fourth quarter. With the third quarter at 3.3, it maps to a fourth quarter near 1.2 percent annualized and an annual average near 2.29. The participants' range, 2.1 to 2.6, maps to annual averages of about 2.24 to 2.37, all inside 2.0 to 2.5. That range was a mid-September view of the whole year, so the translation is a unit check, and a reason to keep a Q4-to-Q4 median out of an annual-average bracket.
The chart is a desk model, and every shock has a mean of zero because the source pages report miss size and withhold a signed bias. The third-quarter advance is centered on 3.3 with a standard deviation of 1.17. Each draw then adds an advance-to-third revision, normal with standard deviation 0.75, matched to BEA's 0.6 point average absolute revision, because January contains the 23 December third estimate. The fourth-quarter advance is centered on 2.2 with a standard deviation of 1.49, the dispersion of quarterly growth from 2022 Q1 through 2026 Q2. Two hundred thousand draws, seed 7, put 3.7 percent in 1.5 to 2.0, 73.3 percent in 2.0 to 2.5, and 23.0 percent above 2.5. The median is 2.35, the tenth percentile 2.10, the ninetieth 2.61.
RelatedWhat moves the price of a Core PCE inflation bucket?
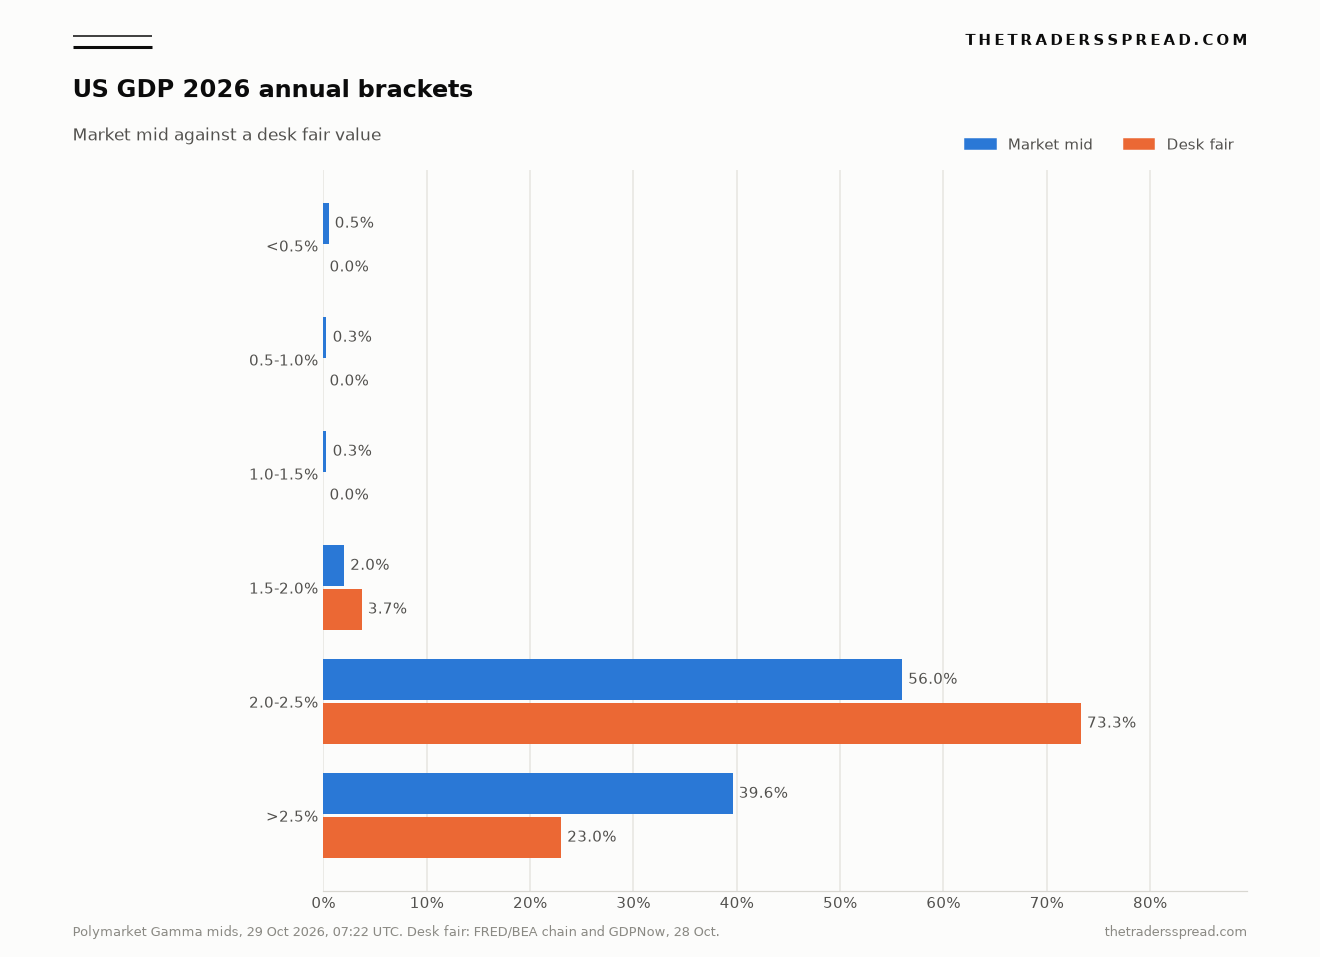
The 2.0 to 2.5 leg is the one the draws single out, 56 percent in the market against 73.3 percent on the desk. The full-year contract pays the annual-average percent change inside the fourth-quarter advance release, not a later third estimate of that quarter. The 63 percent ask and the last trade at 49 both sit below that mark on the 2.0 to 2.5 percent contract.
| Bracket | Mid | Bid | Ask | Desk fair |
|---|---|---|---|---|
| Under 0.5% | 0.45% | 0.3% | 0.6% | under 0.1% |
| 0.5% to 1.0% | 0.25% | 0.2% | 0.3% | under 0.1% |
| 1.0% to 1.5% | 0.25% | 0.2% | 0.3% | under 0.1% |
| 1.5% to 2.0% | 2% | 1.3% | 2.7% | 3.7% |
| 2.0% to 2.5% | 56% | 49% | 63% | 73.3% |
| Above 2.5% | 39.6% | 30% | 49.1% | 23.0% |
Move the fourth-quarter center from 2.2 to 3.3 and the 2.0 to 2.5 share falls to 63.5 percent, while the share above 2.5 rises to 34.9, close to the 39.6 mid. The chart keeps 2.2 because that is the latest quarterly rate BEA has published. The hotter center still leaves the annual average near 2.42, inside the bracket.
Where the touch is wider than the story
The 56 percent mid averages a 49 percent bid and a 63 percent ask. Liquidity on the leg was about $593, against about $6,036 on the event, with about $20,788 of volume on the leg and about $25,380 above 2.5 percent. A fourteen-point touch is a weak stand-in for a precise probability. In the second quarter, state real GDP ran from 4.0 percent in New York to a 2.3 percent decline in West Virginia, and the national bucket pays the national cell.
What still changes after the payoff
The 2026 annual update sat inside the 30 September release. It reopened the accounts from the first quarter of 2021 through the first quarter of 2026, left the reference year at 2017, and moved the first quarter from 2.1 percent to 2.5. BEA puts annual updates in late September, generally covering at least five calendar years. On that pattern the update that revisits 2026 lands in late September 2027, after the January advance and after the 29 January end date.
The third estimate of the third quarter, on 23 December, does enter the January figure, which is why the distribution already carries revision noise around the nowcast. The third estimate of the fourth quarter falls on the far side of the resolution text. The advance can be a rough draft of the economy and the final draft of the contract in the same hour.
Questions that keep coming back
Which BEA vintage does a US GDP growth bucket use?
The contracts read here use the advance estimate. The third-quarter market names the advance annualized rate scheduled for 29 October 2026. The full-year market names the annual percent change inside the fourth-quarter advance, estimated for January 2027. Second and third estimates remain the documents for the economy, and they sit outside the resolution once an advance exists. The historical gap from advance to third averages 0.6 point, wide enough to cross a half-point bracket.
What growth rate does the full-year contract measure?
It measures the percent change from the 2025 annual level of real GDP to the 2026 annual level, as stated in the fourth-quarter advance. An annual level is the average of the four quarterly levels. That differs from the annualized quarterly rate on the chyron and from the fourth-quarter-to-fourth-quarter rate in the Summary of Economic Projections. For 2025 those concepts printed at 2.0 percent in the projections table and 2.3 percent on the annual-average series.
Where does an exact bracket boundary go?
Both events send an exact boundary to the higher bracket. A full-year print of 2.5 percent settles the bracket whose question says growth greater than 2.5 percent. A third-quarter print of 3.0 percent settles the top quarterly bracket on the same rule. The question wording and the tie sentence pull apart, and the tie sentence is the line that governs. Mass sitting on the boundary belongs in the upper bucket.
Why can the annual rate sit in a lower bracket than the quarterly rate?
The first half of 2026 is already published at 2.5 and 2.2 percent, so much of the annual average is set before the fourth-quarter advance. A third quarter at the 3.3 percent nowcast and a fourth quarter at 2.2 produce an annual average near 2.35 percent. The quarterly headline can look fast while the annual level stays inside 2.0 to 2.5. Clearing 2.5 from there takes a fourth quarter near 4.5 percent annualized.
What happens if the advance release is missing?
On the third-quarter contract, an empty advance page switches resolution to the first official figure that appears, and if the page is still empty at the next quarter's advance, to the latest figure already published. The full-year text read on 29 October names the fourth-quarter advance and sets later revisions outside scope. That quarterly fallback is absent from the year text, so a delayed January release follows the year contract's own wording.
A reading list for the release
On the morning a US GDP bucket is scored, the payoff is one cell in a long release. The list below is the set of lines that decide it.
- The vintage named in the release title.
- For a full-year bracket, the percent change from the prior annual level.
- For a quarterly bracket, the annualized rate, kept apart from the annual-level rate.
- The tie sentence, if the print lands on a bracket edge.
- The dates of the later estimates, useful for the economy once the advance has fixed the payoff.
- The bid and the ask beside the mid.
- The fallback paragraph in the contract in hand, if the advance page is empty.
This is analysis, and it is not a recommendation to take either side of a contract. A growth bucket can settle at zero, and the stake can be lost. The 73.3 percent figure is a desk calculation from the BEA vintages, the FRED quarterly chain, the Atlanta Fed nowcast and the September projections, as read on 29 October 2026, and a different fourth-quarter center moves it.