

Having tracked USD/INR on this desk's rate sheet through every leg of the past year, from 88.70 rupees per dollar last September to 95.74 at the European Central Bank's 23 September reference fix, I have learned to read the pair less as a price and more as a policy decision taken daily in Mumbai. This week that decision looks harder than it did in June. The live quote was 95.87 at 06:43 UTC on Thursday 24 September, per the FX_IDC:USDINR feed on TradingView, and the official FBIL reference rate that the Reserve Bank of India publishes on its homepage was 95.7310 at 1:00pm IST on 23 September. USD/INR has risen 7.9% in twelve months. It has also barely moved since 5 June, when the RBI announced a dollar-raising window that has since brought in $143.6 billion. That flat line is the whole story, and it is the reason our bull case sits at 98.50 and our bear case at 93.00.
Here is the part nobody is pricing. The swap facility pulled in $143.6 billion by 18 September, yet the RBI's foreign currency assets rose only $93.5 billion between end-March and 11 September. Roughly $50 billion of borrowed dollars did not stay on the balance sheet. On our reading of the RBI's own tables, the gap is what defending the 94-to-96.6 range has cost since June, and every one of those swapped dollars comes back as a forward obligation from 2029 onward.
Key facts
- USD/INR spot 95.87 at 06:43 UTC on 24 September; FBIL reference rate 95.7310 on 23 September; ECB cross 95.74 on 23 September, up 7.9% from 88.70 a year earlier — TradingView scanner, RBI homepage (FBIL), ECB via Frankfurter, 24 Sep 2026
- Forex inflows under the RBI swap facility reached $143.596 billion, of which FCNR(B) deposits were $132.98 billion — RBI press release, 21 Sep 2026
- Total reserves were $780.78 billion on 11 September, down $4.92 billion on the week; foreign currency assets were $645.80 billion — RBI Weekly Statistical Supplement, 18 Sep 2026
- The RBI's outstanding net forward position was a $103.3 billion short at end-June, $64.2 billion of it beyond one year — RBI Bulletin table 4A, 25 Aug 2026
- India's July current account deficit widened to $7.0 billion from $3.2 billion a year earlier — RBI balance of payments release, 15 Sep 2026
- Brent spot hit $130.80 on 15 September and printed $114.89 on 22 September, against $96.02 on 1 September — FRED, EIA Brent series, 22 Sep 2026
- Repo rate 5.25% with a neutral stance, against a fed funds range of 3.75% to 4.00% after the 16 September hike — RBI, 5 Aug 2026, Federal Reserve, 16 Sep 2026
Where did $143.6 billion go?
Start with the plumbing, because it decides everything else. On 5 June Governor Sanjay Malhotra announced a package to pull foreign money in. Two of its five measures matter for the pair: a concessional forex swap for external commercial borrowings by public-sector companies, and "a similar facility for bearing the full hedging cost" for banks raising fresh three-to-five-year FCNR(B) deposits, both running to 30 September. The RBI's own FAQ on the scheme describes it as a plain foreign exchange swap covering only the principal, with a minimum original deposit tenor of three years.
Mechanically, a bank takes a non-resident Indian's dollars, hands them to the RBI today for rupees, and contracts to take them back at maturity. The RBI gets spot dollars now and books a forward obligation to return them later. Because the central bank bears the hedging cost, the depositor earns a dollar rate the open market would never pay.
It worked, and faster than planned.
| Reporting date | FCNR(B) deposits ($m) | OFCBs ($m) | ECBs ($m) | Total ($m) |
|---|---|---|---|---|
| 31 Jul 2026 | 36,725 | 2,575 | 1,516 | 40,816 |
| 31 Aug 2026 (provisional) | 127,226 | 5,260 | 3,891 | 136,377 |
| 18 Sep 2026 | 132,980 | 5,320 | 5,296 | 143,596 |
Sources: RBI press releases of 1 August, 2 September and 21 September 2026. The FCNR(B) line is final to 31 August, when the window closed a month early; the ECB and OFCB windows stay open to 31 December.
August alone brought in about $96 billion of FCNR(B) money. Reserves show the footprint: $729.3 billion on 21 August, $780.8 billion on 11 September, after $785.7 billion the week before. So far, so reassuring. Now compare the flow with the stock. Foreign currency assets were up $93.5 billion from end-March to 11 September, while the swap facility alone delivered $143.6 billion, and net FDI inflows were adding to the pile too. Some of the difference is valuation, because non-dollar holdings are revalued weekly and gold is carried separately. Most of it, on our arithmetic, is the RBI spending dollars in the spot market to keep the rupee from breaking higher. The Bulletin's latest intervention table supports the direction: net dollar sales of $53.1 billion across fiscal 2025-26 and cumulative net sales of $14.5 billion from April to June 2026, per RBI Bulletin table 4. That $50 billion gap is our estimate, not a figure the RBI publishes, and the September Bulletin will test it.
A 2.3-rupee box, and why the chart looks calm
The chart below is the ECB's daily reference cross for USD/INR over twelve months, with our three scenario levels projected to 31 March 2027, the end of India's fiscal year.
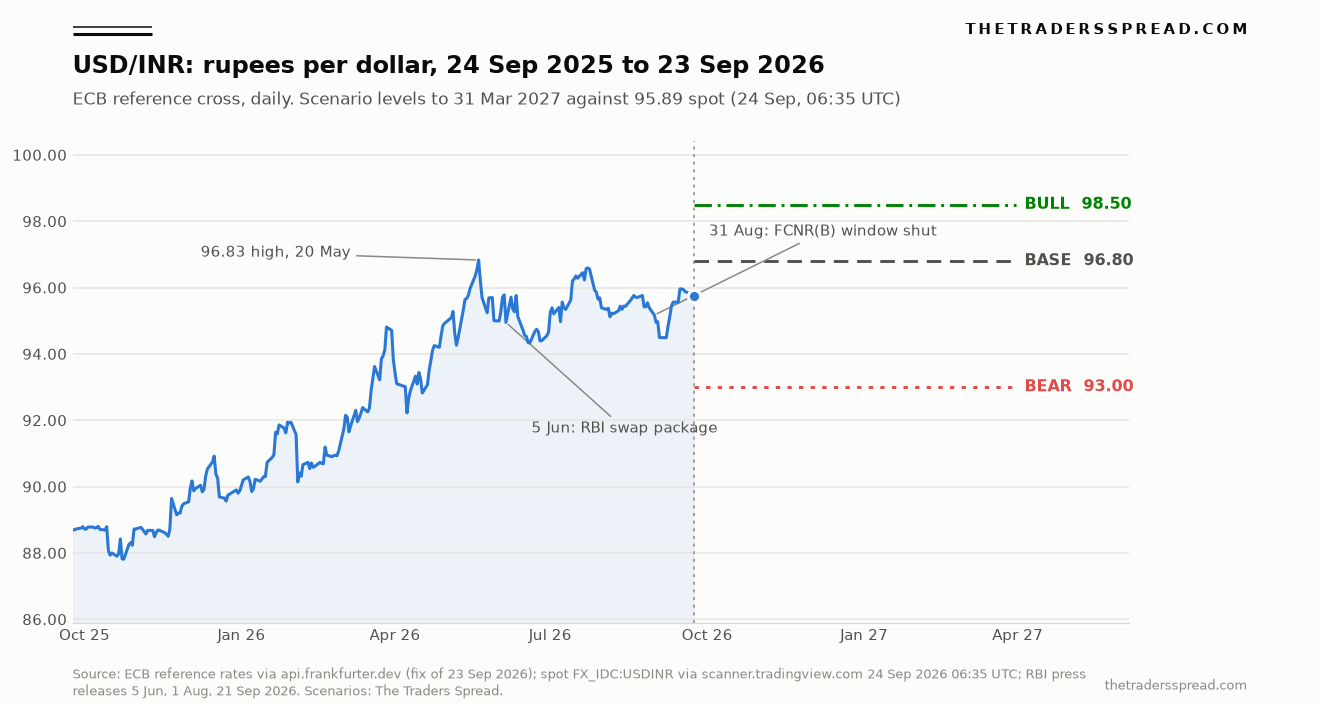
Look at the right-hand third. From 8 June, when the swap window opened, to 23 September, the pair has traded between 94.33 on 19 June and 96.59 on 23 July. That high came on the day Brent jumped to $105.32. The year's peak on this series, 96.83, printed on 20 May, before any of the June measures existed; TradingView's composite shows a 52-week high of 96.96. Since then the rupee has been held in a box roughly 2.3 rupees wide while oil, the Fed and portfolio flows all moved against it.
| Level | USD/INR | Distance from 95.87 spot | Side of spot | What it represents |
|---|---|---|---|---|
| Bull case | 98.50 | +2.74% | Above | Box breaks; RBI lets the crawl resume |
| Base case | 96.80 | +0.97% | Above | Slow grind through the May high |
| Spot (24 Sep, 06:43 UTC) | 95.87 | 0.00% | n/a | TradingView FX_IDC:USDINR |
| Invalidation | 94.30 | -1.64% | Below | Under the post-package low of 94.33 |
| Bear case | 93.00 | -2.99% | Below | Oil unwinds and the RBI hikes |
A pair that climbs 7.9% in a year and then goes still for fifteen weeks is not in equilibrium. It is being held, and the only question is who tires first.
The central bank's words, read closely
The RBI insists it is not defending a number. "We do not target any specific level or band; instead, we allow the exchange rate to be determined by market forces," said Sanjay Malhotra, Governor of the Reserve Bank of India, on 5 June. The same paragraph promised to "curb excessive volatility and prevent disorderly market movements." Fifteen weeks inside a 2.3-rupee range suggests the second sentence carries more weight than the first.
The Monetary Policy Committee's external members were explicit about intent. "These forex inflows will support INR stability and help limit the impact of imported inflation," wrote Professor Ram Singh, Director of the Delhi School of Economics and an external member of the RBI's Monetary Policy Committee, in the minutes of the 3 to 5 August meeting. So the swap money was raised, in part, to be spent on the currency. That is consistent with the $50 billion gap above.
Malhotra's own statement in those minutes points to the other lever. The committee held the repo rate at 5.25% unanimously, with inflation projected to peak at 5.9% in the October to December quarter. But he added: "Any evidence of these risks materialising may need policy tightening." That line is the bear case in embryo. The next MPC meeting runs from 5 to 7 October 2026, per the same minutes.
What the swap window hides: oil, the Fed and a thinner carry
Three forces have turned since June, and all three push USD/INR higher.
Oil first. India imports most of its crude, and the 5 August Governor's statement put the April-to-June merchandise deficit at $86.6 billion, up from $68.7 billion a year earlier, driven by crude, electronics and gold. The July balance of payments made it worse: a $31.7 billion goods deficit and a current account shortfall of $7.0 billion. Those July numbers were struck with Brent between roughly $68.5 and $105. In September it has traded between $96 and $131 on the FRED daily series. The August and September trade prints have not been published yet, and they will carry that bill.
Then the carry. The Federal Reserve raised its target range to 3.75% to 4.00% on 16 September by a 12-0 vote. With the repo rate at 5.25%, the policy gap to the top of the fed funds range is 125 basis points. For a currency that relies partly on portfolio debt inflows, that is a thin cushion, and it narrows further with every Fed move the RBI does not match. Portfolio flows are already split: the RBI counts $11.6 billion of net equity outflows and $7.3 billion of debt inflows from April to July.
Third, the pipe is closing. The FCNR(B) window shut on 31 August, a month ahead of the 30 September date in the original package. Only the ECB and OFCB windows remain, and they added under $2 billion between 31 August and 18 September. The extraordinary August inflow does not repeat. July's balance of payments shows how much depended on it: NRI deposits contributed $33.5 billion of a $20.8 billion overall surplus. Strip them out and July was a deficit month.
Anyone following the Brent crude outlook on this site will recognise the sensitivity. So will readers of our USD/KRW forecast, where another oil-importing Asian currency faces the same squeeze with a smaller reserve pile.
Precedent: 2013 had the same window with a different price tag
India has run this play before. In September 2013, at the height of the taper tantrum, the RBI opened a swap window for FCNR(B) deposits mobilised after 6 September with a minimum three-year maturity. According to the RBI's FAQ on that facility, banks paid a swap cost of 3.5% a year, compounded semi-annually. The 2026 version is cheaper for banks and costlier for the central bank, because the RBI bears the full hedging cost itself.
The lesson from 2013 is about timing, not size. Those deposits matured from late 2016, three years on, and the forward legs had to be settled when they did. The 2026 deposits carry a three-to-five-year tenor, so the bulk of the obligations fall between mid-2029 and 2031. They are a long way off. What they do today is change what the $780 billion headline means. At end-June the RBI was already net short $103.3 billion in forwards; each dollar swapped since then adds a matching forward leg. On simple addition, and before netting the $14.7 billion of forwards the Bulletin showed maturing within three months of end-June, the net short book is plausibly near $200 billion once August is booked. That is our estimate; the RBI's September and October Bulletins will print the real figure.
Gross reserves are real dollars. Net of forward commitments, the war chest is smaller than the headline, and the market knows how to read table 4A.
What could prove the bears right
The bear case is not a fantasy, and it deserves a fair hearing. Three things would drag USD/INR toward 93.00.
A peace dividend in West Asia would do the most. Brent was $67.96 a year ago; a return toward $80 would shrink India's import bill fast and turn the current account from threat to comfort. Next, the RBI could hike in October or December. Malhotra has put tightening on the table, core inflation is projected at 4.3% for the year, and a surprise move would reopen the carry gap. Last, the June debt-market measures are working: the RBI credits the Fully Accessible Route changes and tax exemptions for a turnaround in portfolio debt flows. Debt inflows are rate-sensitive, and a hawkish RBI would draw more of them.
There is a quieter mechanism too. With reserves near $781 billion and the RBI keen to show the swap money was well spent, it could lean the other way for a while and let the rupee firm, as it did between 20 May and 19 June, when the ECB cross fell from 96.83 to 94.33. A repeat from here lands near 93.4. We treat that as the tail, not the base.
RelatedNZD/CHF Forecast: 0.4790 Bull Case vs 0.4560 Bear Case
For a sense of how fast an emerging-market pair can travel when policy and flows align, see our USD/BRL forecast, built on a carry trade far wider than India's.
The call
Base case, 50%: USD/INR at 96.80 by 31 March 2027. The RBI keeps the box but lets its ceiling drift, a crawl of roughly 1% over six months. Oil stays elevated, the ECB and OFCB windows add modest dollars into December, and the October MPC holds with hawkish language. That is +0.97% from 95.87 spot, just short of the May high.
Bull case, 30%: 98.50. Brent holds above $110 through the northern winter, the August and September trade deficits print wide, and the Fed hikes again while the RBI waits. Faced with a shrinking net reserve position, the central bank decides that spending borrowed dollars on a level it says it does not target is poor value, and allows a step move. That is +2.74% from spot, above the 96.96 52-week high, and would leave USD/INR more than 11% above its level of a year earlier.
Bear case, 20%: 93.00. A West Asia settlement pulls Brent toward $80, the RBI tightens in October or December, and portfolio debt inflows accelerate. The rupee revisits April's range. That is -2.99% from spot.
What would change my mind: a daily close below 94.30, under the post-package low of 94.33, would say the RBI has chosen strength over reserves, and I would move to neutral. A 25bp RBI hike at the 5 to 7 October meeting would cut the bull probability in half. On the other side, a September Bulletin showing the net forward short above $200 billion alongside a fresh decline in foreign currency assets would push me toward the bull case, because it would show the central bank has less room than its $780 billion headline suggests. A reader tracking another managed emerging-market currency can compare the setup with our USD/TRY forecast, where the central bank's hand is heavier still.
USD/INR forecast FAQ
What is the USD/INR exchange rate today?
The live quote was 95.87 rupees per dollar at 06:43 UTC on 24 September 2026, from TradingView's FX_IDC:USDINR composite. The official FBIL reference rate shown on the RBI homepage was 95.7310 at 1:00pm IST on 23 September, and the ECB's reference cross for the same day worked out at 95.74. Quotes differ slightly by source and time of day.
What is the RBI's FCNR(B) swap window?
It is a facility, opened on 8 June 2026, under which banks raising fresh three-to-five-year dollar deposits from non-residents could swap the principal with the RBI, which bore the full hedging cost. The FCNR(B) leg closed on 31 August after raising $132.98 billion; the ECB and OFCB legs remain open to 31 December 2026.
Does India have enough reserves to hold the rupee?
Gross reserves were $780.78 billion on 11 September, a very large buffer. The caveat is the forward book: at end-June the RBI was net short $103.3 billion in forwards, and the swap window adds matching forward obligations. Net of those, the usable buffer is smaller than the headline, though still substantial by emerging-market standards.
Will the RBI raise rates in October 2026?
The MPC meets from 5 to 7 October. In August it held the repo rate at 5.25% unanimously, and Governor Malhotra wrote that evidence of inflation broadening "may need policy tightening." Inflation is projected to peak at 5.9% in the October to December quarter. A hike is possible but not the committee's stated base case.
Why is the rupee weak when inflows are so large?
Because the inflows are one-off and borrowed, while the outflows are recurring. The goods deficit widened to $31.7 billion in July, Brent has traded above $110 for much of September, equity portfolio money has left, and the Fed is hiking. On our reading, the swap dollars have mostly been used to slow the rupee's fall rather than reverse it.
Disclaimer
This article is analysis and commentary, not investment advice or a recommendation to trade any instrument. Currency and CFD trading carries a high risk of loss, and margined products can lose more than your initial deposit. Scenario levels and probabilities reflect the author's judgement at the time of writing and can change without notice. Past performance does not predict future results. Capital is at risk.