
The US 10-year Treasury yield was 5.31% on 5 October 2026. That figure is the par yield on the Treasury's daily curve for a 10-year point, the rate a new note of that maturity would carry if the price were exactly par. The CBOE index that tracks the same maturity, Yahoo Finance symbol ^TNX, closed the same cash session at 5.311. The title uses the Treasury print of 5.31%, not a yield inferred from bond futures. Futures are a price, on a different clock. At 06:45 UTC on 6 October the December 2026 10-year note future was 104.29688 on Yahoo, up from 104.21875 at the 5 October close. A higher futures price points the other way from a higher yield. Tuesday's cash curve had not been published when these figures were pulled.
On 3 September this desk published an EUR/USD forecast whose bear case was 1.1250. At 06:54 UTC on 6 October, Yahoo's EUR/USD rate was 1.1213, about 37 pips through that level. The yield beside it is a number the FRED constant-maturity series, pulled the same morning and running through 2 October, had not recorded at or above 5.31% since 14 May 2002, when it stood at 5.32%. The Treasury then printed 5.31% for 5 October. Euro spot is already past a downside case drawn five weeks ago. The bond yield next to it is back at a level last seen when the Fed's target rate was 1.75%, not the 3.75 to 4 percent range in force now.
What follows is the mechanism. It is not a forecast, and it is not a trade.
Key facts
- The 10-year par yield was 5.31% on 5 October 2026, up from 5.28% on 2 October, a rise of 3 basis points. Source: US Treasury daily par yield curve, pulled 6 October 2026.
- Yahoo ^TNX closed that same session at 5.311, so the cash index and the Treasury curve agree once the index is rounded to two decimals. Source: Yahoo Finance, 5 October 2026 close.
- The federal funds target range was 3.75% to 4.00% on 5 October. The effective funds rate was 3.88% on 2 October, the latest daily print in FRED that morning. Source: FRED DFEDTARU, DFEDTARL and DFF, pulled 6 October 2026.
- On the 5 October curve the 2-year was 4.84%, the 10-year minus the 2-year was 0.47 percentage point, the 20-year was 5.70% and the 30-year was 5.66%. Source: US Treasury, 5 October 2026. FRED T10Y2Y also printed 0.47 that day.
- The 30-year fixed mortgage average was 7.28% in the week of 1 October 2026, up from 7.03% in the week of 24 September. Source: FRED MORTGAGE30US, the Freddie Mac survey, pulled 6 October 2026.
- In the FRED DGS10 file through 2 October 2026, the last observation at or above 5.31% was 5.32% on 14 May 2002. The April 2002 peak was 5.44% on 1 April. Source: FRED DGS10, pulled 6 October 2026.
A yield is a price, read backwards
Bonds are not priced the way shares are priced. The quote people pass around is a yield. The thing that changes hands is a price. They move in opposite directions, and the reason is arithmetic.
Take a new 10-year note with coupons twice a year, and set the coupon equal to the yield so the bond is worth par. At 5.31%, that price is 100 per 100 of face value. Push the yield up 10 basis points, to 5.41%, and the same coupons are discounted at a higher rate. The price falls to 99.24, about 76 cents per 100 of face, or about $7.65 per $1,000. Push the yield down 10 basis points, to 5.21%, and the price rises to 100.77, about $7.72 per $1,000. The two moves are close, not identical. This is a clean par bond, not the quote of a particular CUSIP, and not the futures price above.
The real move was smaller. The Treasury's 10-year went from 5.28% on 2 October to 5.31% on 5 October. A bond that was par at 5.28%, repriced at 5.31%, is worth about 99.77. That is roughly 23 cents per 100 of face, or about $2.30 per $1,000. Three basis points is a quiet session in price. The level those three basis points arrived at is not quiet.
One basis point is 0.01 percentage point, so Thursday to Monday is 3 basis points. On that par note, about 10 basis points of yield is worth roughly three quarters of a price point. A bill portfolio feels much less of the same move.
The funds rate is a different contract
The federal funds rate is what banks charge each other for overnight reserves. The Fed sets a target range for it. The 10-year yield is what investors demand to lend to the Treasury for a decade. One is an administered overnight rate. The other is a market price for ten years of inflation, growth and fiscal risk.
Vice Chair Philip N. Jefferson, on 1 October 2026, said the Committee had voted the previous month to raise the target range by a quarter of a percentage point, to 3.75 to 4 percent. FRED shows that step on 17 September, from 3.50 to 3.75 percent up to 3.75 to 4.00 percent, and no other change in the range during 2026 through 5 October. In the same speech he said, "Since our September meeting, yields across the term structure have increased further," which matches the curve: the 10-year par yield was 5.17% on 25 September and 5.31% on 5 October.
On 5 October the 10-year sat 131 basis points above the top of the funds range, 5.31 minus 4.00. The effective funds rate was 3.88% on 2 October. Against that older print the gap is 143 basis points. The effective rate for 5 October was not yet in FRED, so the 143 figure mixes a Monday yield with a Thursday funds rate. The 131 figure does not. Either way, the bond market is not quoting the policy rate back to the Fed.
The curve slopes up from the front. On 5 October the 3-month was 4.22%, the 2-year 4.84%, the 5-year 5.06%, the 10-year 5.31% and the 30-year 5.66%. The 20-year, at 5.70%, sat 4 basis points above the 30-year that same afternoon. The kink is a fact on one curve, not a preference for one maturity. The 47 basis point gap from the 2-year to the 10-year is the number FRED publishes as T10Y2Y, and 5.31 minus 4.84 is the same 0.47.
Back at a 2002 level, not in a 2002 economy
A yield near 5.3% sounds familiar because it is familiar. The level is not, by itself, a description of the economy that produced it.
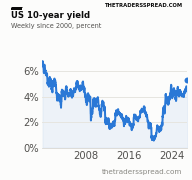
Weekly Treasury constant-maturity yield from 2000, FRED DGS10 through the week of 2 October 2026, with the 5 October point set to the Treasury par yield of 5.31%. The line is the path. It is not a set of trade levels.
| Date | 10-year yield | Policy rate | Gap to the top of policy |
|---|---|---|---|
| 20 January 2000 | 6.79% | 5.50% target | 129 bp |
| 1 April 2002 | 5.44% | 1.75% target | 369 bp |
| 14 May 2002 | 5.32% | 1.75% target | 357 bp |
| 12 June 2007 | 5.26% | 5.25% target | 1 bp |
| 4 August 2020 | 0.52% | 0 to 0.25% | 27 bp |
| 27 February 2026 | 3.97% | 3.50 to 3.75% | 22 bp |
| 5 October 2026 | 5.31% | 3.75 to 4.00% | 131 bp |
Yields are FRED DGS10, except 5 October 2026, which is the Treasury par yield because the DGS10 file pulled on 6 October still ended on 2 October at 5.28%. Policy rates are FRED DFEDTAR through 2008 and DFEDTARU after that. The 2 October DGS10 print of 5.28% matches the Treasury curve that day.
The January 2000 peak of 6.79% is still well above today's print. Calling 5.31% a record would be wrong. Calling it a return to the 2002 neighbourhood is fair: 13 basis points under the 1 April 2002 high of 5.44%, and above the 12 June 2007 high of 5.26%. On this series, the 2006 to 2007 cycle never got the 10-year as high as Monday's Treasury print.
The gap is the part that does not rhyme. In April 2002 the funds target was 1.75% and the 10-year was 5.44%, 369 basis points apart. In June 2007 the two rates met. On 27 February 2026 the yield was 3.97% against a 3.75% ceiling, only 22 basis points above it. Monday's 5.31% is 131 basis points above a ceiling that has risen 25 basis points since February. Of the 134 basis point rise from 3.97% to 5.31%, the September hike is the smaller share.
What else was trading against that print
A higher 10-year yield is a higher discount rate. It raises the hurdle on earnings far in the future, it raises the carry cost of holding an asset that pays no coupon, and it tends to support the dollar when other yields have not moved as much. Those are channels. They are not a claim that every market moved for one reason on 5 October.
They did not. The S&P 500 closed 5 October at 7,773.95, up from 7,670.84 on 29 September, about 1.3% higher. The CAC 40 closed the same day at 7,834.10, down from 8,035.87 on 29 September, about 2.5% lower. Same dates, opposite signs. The longer equity note on this desk is the S&P 500 forecast. One US yield does not hand every share index the same direction.
The dollar was firmer over a longer window. The ICE US Dollar Index was 102.264 at 06:45 UTC on 6 October, up from 100.97 on 25 September, about 1.3 index points, over the same fortnight the 10-year went from 5.17% to 5.31%. The USD/CNH forecast is the desk's separate note on one dollar pair. The euro print above is the cross-check that belongs in this piece: 1.1213, through a 1.1250 case published on 3 September.
COMEX December gold was $4,158.20 at 06:45 UTC on 6 October, $163 under the 25 September close of $4,321.20, though the future was already $4,168.40 by 28 September, when the 10-year was 5.24%. Brent was $99.66 and WTI was $88.62 at the same Tuesday timestamp, against Monday closes of $100.32 and $89.43.
Mortgages are where the 10-year shows up in a household budget. The Freddie Mac 30-year average was 7.28% in the week of 1 October, 25 basis points above 7.03% the week before. On 1 October the Treasury 10-year was 5.24%, so the mortgage sat about 204 basis points above the bond yield. That gap is not a fixed markup, and 7.28% is a weekly survey. The bond has since moved to 5.31%. The survey, on this pull, stops at 1 October.
Who takes the other side
The Treasury is the borrower. A pension fund buying a note is lending for a decade. A dealer who bids at auction lends first and looks for a customer afterwards. The yield is the price of that loan.
Vice Chair Jefferson, on 22 September 2026, at the Treasury Market Conference at the Federal Reserve Bank of New York, said: "The U.S. Treasury market serves as the foundation for pricing risk across all asset classes, facilitating the efficient allocation of capital throughout our economy." That is why a forex desk writes about a bond yield. The dollar, the mortgage and the equity discount rate are quoted off a curve that starts here.
Dealers sit in the middle. They take down what the auction does not place directly, and they make the secondary market. When they are full, the price goes down and the yield goes up. This note has no fresh dealer-positioning figure, so it stops at the mechanism.
Foreign official accounts still hold Treasuries as reserves. A reserve manager who needs dollars, or who has been told to shorten the book, changes the bid for the long end. The dollar stock of those holdings is a TIC figure with a lag. It was not re-pulled here, so no total is stated.
Mortgage hedgers can amplify a move they did not start. When the 10-year yield rises, fewer homeowners refinance, and the expected life of a mortgage-backed bond gets longer. A holder who had matched a shorter life then has more rate exposure than the book was built for. Cutting Treasury holdings, or paying fixed in a swap, leans against the bond price and can add to the yield. It is a channel, not a schedule.
RelatedGBP/NOK Price Prediction: 13.20 Bull Case vs 12.10 Bear
What would change this reading
The reading is narrow. The 10-year is at a 2002-style level, the gap to the funds rate is wide rather than flat, and the September hike does not account for most of the rise since February. Three kinds of news would change that reading. None of them is a price target.
Inflation is the first. The latest CPI index in FRED on this pull is August 2026: 334.131, up from 332.813 in July, about 0.4% on the month, and up from 323.291 in August 2025, about 3.35% on the year, on CPIAUCSL. September is not in the file. A faster September index would make 5.31% look more like inflation that is not fading. A softer one would make the same yield look more like a term premium or a positioning squeeze.
An auction is the second. If the high yield at the next 10-year sale clears above the yield dealers were marking just before the deadline, the cash curve often gaps wider. This note does not cite a tail or a bid-to-cover, because those results were not pulled this session. Whether 5.31% is a plateau depends on whether the next sale finds a bid near that yield.
Growth is the third. Unemployment was 4.2% in September 2026, up from 4.1% in August, on FRED UNRATE. A tenth of a point is not a regime change. Weaker labour prints would challenge a hot-economy reading of 5.31%. Stronger ones would challenge the opposite reading. Jefferson said further policy changes should follow the data. That does not date the next move.
There is a nearer test that needs no data release. The December note future was higher in price on the morning of 6 October than at the 5 October close. If Monday's 5.31% is not matched on the next Treasury curve, then 5.31% stays a true statement about one session and a weaker statement about a plateau. The futures price is not itself a yield. It only hints that the note market, before the cash curve reopened, was not extending the move.
Questions the print raises
What is the US 10-year Treasury yield?
It is the par yield for a 10-year point on the Treasury's daily curve: the coupon a new 10-year note would carry if the price were exactly 100. It is not the coupon frozen into older bonds, and it is not the federal funds rate. On 5 October 2026 the Treasury put that yield at 5.31%. The CBOE index closed the same session at 5.311.
Why do mortgage rates follow the 10-year?
A 30-year mortgage is rarely outstanding for 30 years, because people move and refinance. Its expected life sits nearer the 10-year than the 30-year bond, so lenders start from the 10-year yield and add a spread for credit, servicing and the option to prepay. In the week of 1 October 2026 that average was 7.28%, about 204 basis points over the 5.24% Treasury yield that day. The spread is not fixed.
How is the 10-year different from the federal funds rate?
The funds rate is an overnight rate inside a range the Federal Reserve sets. On 5 October 2026 that range was 3.75% to 4.00%. The 10-year is a market rate for lending to the Treasury for ten years. It was 5.31% the same day, 131 basis points above the top of the range. The Fed can change the overnight range at a meeting. It does not set the 10-year. Investors do, by the price they pay.
What is a basis point?
A basis point is 0.01 percentage point. One hundred of them make one percentage point. The move from 5.28% on 2 October to 5.31% on 5 October was 3 basis points. The gap from the 4.00% top of the funds range to the 5.31% yield was 131 basis points. The unit keeps a tenth of a percent and a hundredth of a percent from being mixed up.
If the yield rises, do existing bondholders come out ahead?
Not on the price of the bond they already hold. A higher yield is a lower price. In the par-bond example, 10 basis points more yield took a 5.31% note down by about $7.65 per $1,000 of face. Someone reinvesting coupons lends at the new higher rate. Someone who needs to exit the old note exits at the lower price. Which effect wins depends on the horizon. This note does not pick one.
Does the 10-year yield predict the Fed's next decision?
It mixes expected policy, inflation and a term premium. It is not a vote on the next meeting. From the February low of 3.97% to the 5 October print of 5.31%, the yield rose 134 basis points while the top of the funds range rose 25. Jefferson said on 1 October that yields had risen further since September, and that the next policy step would depend on the data. The yield is an input to that judgment, not the judgment.
This article is analysis, not a recommendation to trade Treasuries, currencies, mortgages or any related price. Yields and the prices that move with them can go against a position. Capital is at risk. Figures were pulled on 6 October 2026 from the US Treasury, FRED and Yahoo Finance, and they will go stale.