

AUD/CAD is not pricing a fresh surge in Australian growth. The question the market is actually pricing is narrower: can the Australian dollar keep beating the Canadian dollar once both are moving against the US dollar by almost the same amount? The European Central Bank reference rate on Friday 9 October 2026 fixed the cross at 0.99315. That is 0.64% under the 0.99957 high on 21 September, and 8.53% above the 0.91508 fix on 31 December 2025. On the same ECB dataset, with the US dollar as the base, AUD/USD fell from 0.72249 on 9 September to 0.69813 on 9 October, a 3.37% decline. USD/CAD rose from 1.3768 to 1.4226, a 3.33% rise. The direct cross went from 0.99473 to 0.99315. Parity was offered in September. No ECB reference day in the sample has paid it.
Reverse both of those legs halfway, in price, and the cross does not go anywhere. The midpoint of 0.72249 and 0.69813 is 0.71031. The midpoint of 1.3768 and 1.4226 is 1.3997. Multiply them and you get 0.9942, five pips from the 9 September cross of 0.99473. A partial undoing of the last month's dollar move leaves AUD/CAD where it already was, because the two legs offset. The cross trends only when one commodity dollar outperforms the other against the US dollar. Year to date both legs have helped the Australian dollar: AUD/USD is up 4.46% from the 0.66832 fix on 31 December 2025, and USD/CAD is up 3.90% from 1.3692. The product of those two factors is an 8.53% rise, which matches the direct cross. Any AUD/CAD forecast into 31 December is a judgement about which leg stops cooperating. It is not a view that commodity currencies travel as one bloc. The AUD/USD forecast is one half of that identity. This page is the residual against Canada.
- AUD/CAD fixed at 0.99315 on 9 October 2026, 8.53% above the 0.91508 fix on 31 December 2025 — ECB reference rates via Frankfurter, retrieved 11 October 2026
- The high in that sample was 0.99957 on 21 September 2026, and 45 of 255 reference days closed at or above 0.99 — ECB reference rates via Frankfurter, 10 October 2025 to 9 October 2026
- AUD/USD fell 3.37% and USD/CAD rose 3.33% between the 9 September and 9 October fixes, and the cross was almost unchanged — ECB reference rates via Frankfurter, retrieved 11 October 2026
- The Reserve Bank of Australia raised the cash rate target by 25 basis points to 4.60% on 29 September 2026 — RBA media release 2026-27, 29 September 2026
- The Bank of Canada overnight-rate target was 2.25% on 8 October 2026, unchanged since 30 October 2025 — Bank of Canada Valet series V39079, retrieved 11 October 2026
- The Bank of Canada monthly energy commodity index read 1636.53 on 1 September 2026, 43.0% above the 1 December 2025 reading of 1144.47 — Bank of Canada Valet series M.ENER, retrieved 11 October 2026
Two reference rates, one cross
AUD/CAD is not an independent price in the ECB's book. It is the Australian dollar against the US dollar, multiplied by the US dollar against the Canadian dollar. On 9 October the product of 0.69813 and 1.4226 was 0.99316, against a direct fix of 0.99315. The same check holds on the other dates that matter for this year. Use the direct series when you quote the cross. Use the dollar-base series when you quote a leg. Do not average them.
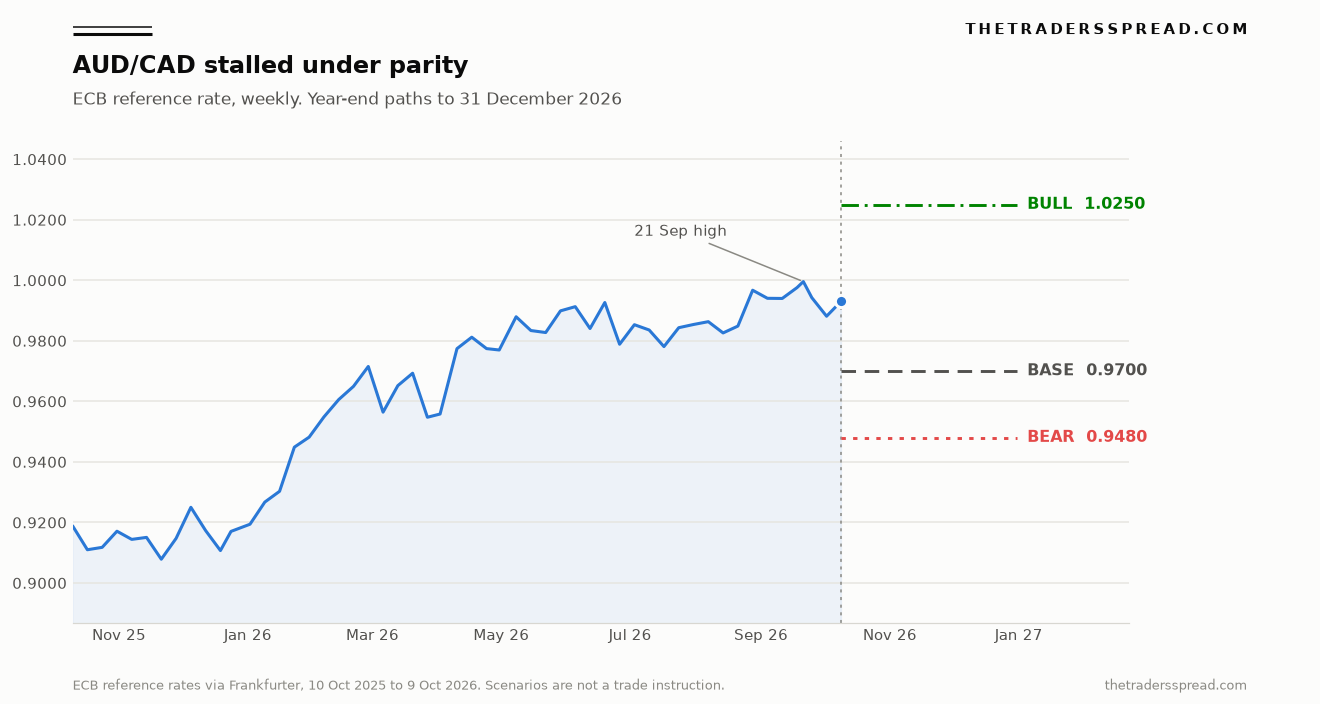
The path on the chart is the weekly ECB fix from 10 October 2025 to 9 October 2026, with the 21 September high included. The low of the sample was 0.90746 on 14 October 2025. From there the cross spent the back half of 2025 near 0.91 to 0.92, then climbed through the first half of 2026 and has since been pinned under parity. The bull line at 1.0250, the base line at 0.9700 and the bear line at 0.9480 are scenarios for 31 December 2026. They are not orders.
| ECB date | AUD/CAD | AUD/USD | USD/CAD |
|---|---|---|---|
| 31 Dec 2025 | 0.91508 | 0.66832 | 1.3692 |
| 7 May 2026 | 0.98896 | 0.72569 | 1.3628 |
| 21 Sep 2026 | 0.99957 | 0.71378 | 1.4004 |
| 9 Oct 2026 | 0.99315 | 0.69813 | 1.4226 |
AUD/CAD in the table is the direct ECB series. The legs are the ECB series with the US dollar as the base. Both were retrieved via Frankfurter on 11 October 2026. Products of the legs on these four dates are 0.91506, 0.98897, 0.99957 and 0.99316.
7 May is the point the weekly dollar story gets wrong. That day was the high for AUD/USD in this sample, at 0.72569, and it was not the high for the cross. USD/CAD was 1.3628, close to the sample low of 1.3524 on 29 January, so the Canadian dollar was still firm against the US dollar. The cross fixed at 0.98896. The 0.99957 high arrived on 21 September, with AUD/USD already down to 0.71378 and USD/CAD up to 1.4004. From 7 May to 21 September, AUD/USD fell 1.64% and USD/CAD rose 2.76%, and the cross rose 1.07%. Canada weakening against the US dollar, not a new high in the Aussie, did the last stretch of the rally.
From that high to 9 October the split flipped. AUD/USD fell a further 2.19%, from 0.71378 to 0.69813. USD/CAD rose 1.59%, from 1.4004 to 1.4226, and printed a sample high of 1.4262 on 8 October. The cross eased 0.64%, to 0.99315. Australia gave back more ground against the dollar than Canada did. That is a small underperformance, not a trend change. It is also the only kind of move that can actually reprice this cross.
Sydney at 4.60%, Ottawa at 2.25%
Michele Bullock, Governor of the Reserve Bank of Australia, told the media conference in Sydney on 29 September 2026: "Higher interest rates are needed to ensure inflation returns to target." The same afternoon the Monetary Policy Board raised the cash rate target by 25 basis points to 4.60%. The decision release said three increases since the start of the year had already tightened financial conditions, and that a further tightening was warranted because inflation was still too high. Bullock added a second cause in the same opening remarks: "The conflict in the Middle East has escalated again in recent weeks, and oil prices have risen significantly."
Ottawa did not follow. Tiff Macklem, Governor of the Bank of Canada, said on 2 September: "With recent data coming out largely in line with our July forecast, we decided to maintain the policy interest rate at 2.25%." Valet series V39079 shows that 2.25% target in place since 30 October 2025, and still there on 8 October 2026. The 2 September press release puts the next overnight-rate announcement on 28 October 2026.
Set the two policy rates side by side and the gap is 2.35 percentage points, 4.60% against 2.25%. In January 2026 the RBA's own table F1.1, published 1 October 2026, records a monthly-average cash rate target of 3.60%. Against a Bank of Canada target that was already 2.25%, that is a gap of about 1.35 percentage points. The gap has widened by a full percentage point over the months in which AUD/CAD rose 8.53%. The same table shows monthly averages of 4.35% in June, July and August 2026, and 4.36% in September. The September figure is an average, not the new target: the 25 basis-point rise was decided on the 29th, so almost the whole month was still at 4.35%.
The higher target did not come with a new high in the cross. It could not have, on the calendar: 0.99957 printed on 21 September, eight days earlier. The fix on 29 September was 0.99321. The fix on 30 September, the first ECB day with the higher Australian target in force, was 0.98822. By 9 October the cross was back at 0.99315, still under the September high. A wider rate gap supported the year's rally. The last 25 basis points did not push the reference rate through 1.00 while both currencies were falling against the US dollar.
One reading of that is mechanical. The rate gap is already in the eight-month climb from the January month-end fix of 0.94818 to the levels near parity. Traders who treat the 29 September decision as a fresh reason to expect a higher cross are double-counting a differential that has been widening since February. The AUD/NZD cross is a different question: it has no Canadian policy rate in it, and it does not inherit the US tariff shock Macklem described. Using it as a proxy for AUD/CAD throws away the leg that has been doing much of the work.
The day parity was not paid
Parity is a round number, and this cross has treated it like a wall. Across 255 ECB reference days from 10 October 2025 to 9 October 2026, the highest fix is 0.99957. The first fix at or above 0.99 was 0.99264 on 13 May 2026. Forty-five days in the sample have closed at or above 0.99. None has closed at 1.00 or above.
A second official source says the same thing in a different print. Bank of Canada series FXAUDCAD, the daily average of the Australian dollar in Canadian dollars, reached 0.9997 on 22 September 2026 and was 0.9958 on 9 October. That 9 October average sat about 0.0026 above the ECB fix. The two agencies do not publish the same snapshot. Neither snapshot has printed 1.00.
Month-end fixes show where the time was spent. The cross closed 2025 at 0.91508, January at 0.94818, February at 0.97153, March at 0.95980, April at 0.97697 and May at 0.98990. June was 0.98042, July 0.98540, August 0.99450, September 0.98822. The entire net gain from the end of May to 9 October is 0.00325, from 0.98990 to 0.99315. Four months of noise around a ceiling, after a winter and spring in which the cross did the real climbing.
That shape matters for the year-end scenarios. A bull case of 1.0250 is not a drift from a market that is already trending through parity. It is a break of a high that has stood since 21 September, by about 2.5 cents, in a cross that has added almost nothing net since May. A bear case of 0.9480 is not a return to the October 2025 low of 0.90746. It is close to the 30 January fix of 0.94818, and the cross has not fixed below 0.9480 since 26 January. The base case of 0.9700 is inside the range the cross already traded in February and April.
Tariffs on one side of the cross
Commodity prices do not explain the Canadian dollar's slide, at least not on the Bank of Canada's own index. Monthly series M.BCPI went from 604.64 on 1 December 2025 to 745.20 on 1 September 2026, a rise of 23.2%. The energy sub-index, M.ENER, went from 1144.47 to 1636.53 over the same readings, a rise of 43.0%. September's energy reading was 4.7% below the May reading of 1716.85, so the boom cooled, but the year-on-year picture is still a higher Canadian commodity basket, not a collapse. The cross rose while Canada's export prices, on this index, were rising. Filing AUD/CAD under "Canada's terms of trade broke" does not survive the Bank's own numbers.
The weekly energy index does show a late dip. W.ENER was 1732.36 on 16 September and 1543.23 on 7 October, a fall of 10.9% in three weeks. That lines up with the last leg of USD/CAD, which made its sample high at 1.4262 on 8 October. It does not line up with the year's rally. The year's rally happened alongside a higher energy index and a wider policy-rate gap.
Macklem's 2 September statement names a shock the commodity index does not capture. "Closer to home, the United States has imposed new tariffs on Canadian exports, and the Canadian government has responded with proportionate counter-tariffs and new supports for hard-hit businesses and workers." He also said the economy had strengthened in the second quarter, "with GDP up by 3.3% following very weak growth in the first quarter," and that the Middle East conflict was "keeping energy prices higher for longer." Growth up, energy prices up, policy rate on hold, new US tariffs on Canadian exports. The Canadian dollar can cheapen against the Australian dollar in that mix even while a commodity index is rising. The Australian side of the same geopolitical shock showed up as an inflation problem and a rate rise, not as a tariff hit of the kind Macklem described.
The USD/CAD forecast is where that Canadian leg is mapped on its own. For the cross, the useful question is whether the tariff story still has room to weaken the Canadian dollar further, or whether 1.4262 on 8 October already marks an extended print. The bull case below needs the first answer. The base and the bear case need something closer to the second.
A bear weighting into 31 December
The base case is 0.9700 by 31 December 2026. The bull case is 1.0250. The bear case is 0.9480. Spot is the ECB fix of 0.99315 on 9 October. The lean is bearish: the nearer objective is the base, not the full bear case, and 1.0250 is the level that retires the bearish scenario. Conviction is 2 out of 5. The cross is still 0.64% under its high, and the cash-rate gap still favours Australia.
RelatedEUR/AUD Forecast: 1.68 Bull Case vs 1.54 Bear Case
Each scenario is one currency outperforming the other, not a joint move in commodity FX. Hold AUD/USD at 0.69813 and 1.0250 implies USD/CAD at 1.4682, about 3.2% past the 8 October high of 1.4262. Hold USD/CAD at 1.4226 and the same bull case implies AUD/USD at 0.7205, close to the 9 September fix of 0.72249. The base case, with AUD/USD unchanged, implies USD/CAD at 1.3894, part of the way back from 1.4226 toward 1.3768. With USD/CAD unchanged it implies AUD/USD near 0.6818. The bear case implies USD/CAD at 1.3579 if AUD/USD stays put, near the 29 January low of 1.3524, or AUD/USD near 0.6664 if USD/CAD stays at 1.4226.
Editorial weights, not an option price: about half on 0.9700, about three tenths on 0.9480, about one fifth on 1.0250. A reference rate at or above 1.0000, which this sample has not printed, would retire 0.9700 as the central case. A fix at 1.0250 would retire the bearish scenario. A fix through 0.9600, last printed on 2 April at 0.95582, would shift weight onto the bear case before December.
The Bank of Canada's 28 October decision is the nearest dated event that can break the offset. A hold at 2.25% leaves the cross dependent on whether USD/CAD eases from 1.4262. A cut, or a statement that treats the new US tariffs as a larger growth hit, is the path toward 1.0250. The Australian target of 4.60% is already in the fixes, and it has not cleared parity.
Questions the fixes raise
What is the AUD/CAD forecast into 31 December 2026?
The base case is 0.9700, the bull case is 1.0250 and the bear case is 0.9480, against an ECB reference rate of 0.99315 on 9 October 2026. The central weight sits on the base. The bull case needs Australia to outperform Canada by about a further 3.2% against the US dollar. The bear case needs about a 4.5% underperformance. These are scenarios, not instructions, and the conviction on the bearish lean is only 2 out of 5.
Why did the cross barely move over the last month?
Because the two US-dollar legs cancelled. From 9 September to 9 October, AUD/USD fell 3.37%, from 0.72249 to 0.69813, and USD/CAD rose 3.33%, from 1.3768 to 1.4226. The direct AUD/CAD fix went from 0.99473 to 0.99315. Halfway back on both legs, at 0.71031 and 1.3997, multiplies to 0.9942. The cross reprices when one commodity dollar beats the other, not when the dollar rises against both.
How wide is the policy-rate gap?
The RBA cash rate target is 4.60% after the 29 September 2026 decision. The Bank of Canada overnight target is 2.25%, and Valet series V39079 shows that level unchanged since 30 October 2025. The gap is 2.35 percentage points. In January the RBA's monthly-average target in table F1.1 was 3.60%, so the gap then was about 1.35 percentage points. The widening lines up with the year's rally. The last hike did not produce a new high.
Has AUD/CAD reached parity?
Not on these two official series. The ECB reference high from 10 October 2025 to 9 October 2026 is 0.99957, on 21 September. The Bank of Canada daily-average high in series FXAUDCAD over the same window is 0.9997, on 22 September. Forty-five ECB reference days closed at or above 0.99. None closed at 1.00. A fix at or above 1.0000 would retire the 0.9700 base case used here.
What would push the cross to 1.0250 or down to 0.9480?
With AUD/USD held at 0.69813, 1.0250 implies USD/CAD at 1.4682, past the 8 October high of 1.4262. With USD/CAD held at 1.4226, 1.0250 implies AUD/USD near 0.7205. The bear case is the mirror. Unchanged AUD/USD implies USD/CAD at 1.3579. Unchanged USD/CAD implies AUD/USD near 0.6664, through last December's fix. The Bank of Canada's 28 October decision is the nearest event that can force one of those mixes.
Disclaimer. This is analysis, not advice and not a solicitation to trade foreign exchange or any other instrument. Capital is at risk. Scenarios are editorial judgements based on reference rates and official releases retrieved on 11 October 2026. They are not a forecast the market is obliged to meet, and past fixes are not a guide to the next one.