

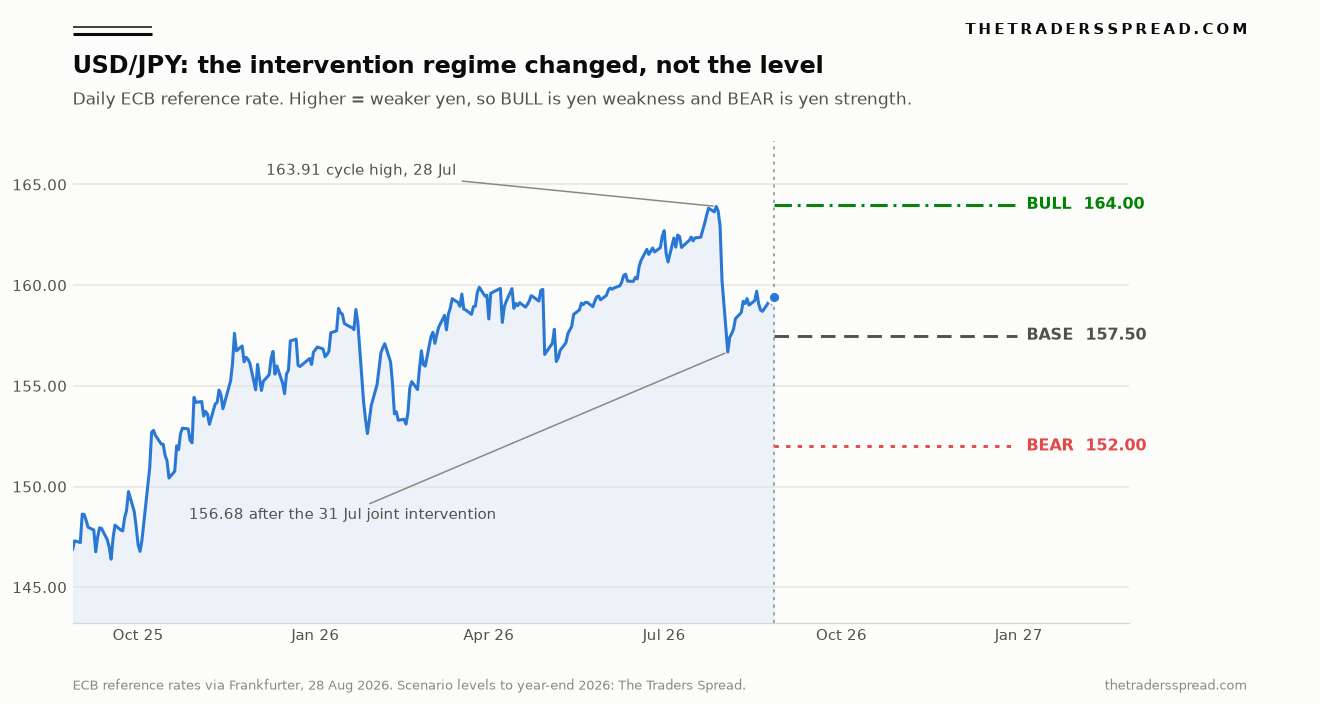
USD/JPY — the number of Japanese yen it takes to buy one US dollar — trades at 159.39, and the level everyone calls the intervention line has quietly stopped being one. The received wisdom says Tokyo defends 160. The record says otherwise: Japan's Ministry of Finance spent a record ¥11,734.9 billion in the month to 27 May 2026 defending that area, then watched the pair trade above 160 for 39 consecutive sessions and print 163.91 on 28 July while spending, on its own published numbers, exactly ¥0. A record cheque bought four weeks. Silence bought nothing, and cost nothing.
Here is the part the level-watchers missed, and it is visible in two public datasets that almost nobody joins together. On 31 July the US 10-year Treasury yield closed at 4.75% — its highest print of 2026. On exactly that day USD/JPY fell 2.70 yen, and on the next trading day it fell another 3.56. The yen had its best two sessions of the year at the precise moment the interest-rate gap that had driven it lower all year was at its widest. Rate differentials, which explained the entire 2026 trend up to that point, explained none of the reversal. One variable changed: the United States joined the trade. What matters for this pair from here is not a level on a chart but whether Washington picks up the phone twice.
Key facts
- USD/JPY spot: 159.39, down 2.8% from the 163.91 cycle high of 28 July — ECB reference rate, 27 August 2026
- MoF intervention, month to 27 May 2026: ¥11,734.9 billion (about $73.6bn), the largest monthly total on record — Ministry of Finance, 29 May 2026
- MoF intervention, months to 26 June and 29 July 2026: ¥0 and ¥0 — Ministry of Finance, 30 June and 31 July 2026
- Bank of Japan policy rate: around 1.0%, raised from 0.75% on a 7–1 vote effective 17 June 2026 — Bank of Japan, 16 June 2026
- BoJ held at 1.0% on 31 July by 8–1, with Takata Hajime dissenting in favour of 1.25% — Bank of Japan, 31 July 2026
- US–Japan 10-year yield gap: 177 basis points (4.67% vs 2.897%) — US Treasury and Japan's Ministry of Finance, 27 August 2026
- Fed funds target range: 3.50–3.75%, held on a 9–3 vote — Federal Reserve, 29 July 2026
- BoJ forecast for core CPI: +2.5% in FY2026, +2.4% in FY2027, +2.0–2.2% in FY2028 — above target in every year of the horizon — BoJ Outlook Report, 31 July 2026
What actually happened on 31 July
Two things landed within hours of each other, and the market has spent August pricing the wrong one. At 12:11 Tokyo time the Bank of Japan published its Statement on Monetary Policy and left the uncollateralised overnight call rate at around 1.0%. On the headline that is a hold, and a hold from a central bank whose currency is at a four-decade low reads as capitulation.
The detail underneath was the opposite. The vote was 8–1. The dissenter, Policy Board member Takata Hajime, proposed 1.25% and put his reasoning on the record in the statement itself. He judged, in the Bank's own published wording, that "the situation had shifted to a new phase in which the Bank needs to adopt a nimble approach in response to upside risks to prices caused by demand shocks stemming from overseas developments and to changes in overseas financial conditions." That is not the language of a board settling in. It is the language of a board with one member already voting for the next move.
The second event was the intervention. Japan's Ministry of Finance and the US Treasury conducted a coordinated yen-buying operation that Friday, confirmed by both sides on Monday 3 August — the first joint US–Japan operation to buy yen since 1998. The Ministry said it was carried out under the Joint Statement of the Japanese and US Finance Ministers issued in September 2025, and was aimed at "the recent excessive volatility and disorderly movements of the yen." US Treasury Secretary Scott Bessent confirmed it in near-identical terms, saying "Friday's coordinated foreign exchange actions countered disorderly yen movements."
The mechanics matter more than the headline. Writing for the Council on Foreign Relations on 4 August, Brad W. Setser, Whitney Shepardson Senior Fellow, set out that the US Treasury sold euros from its own reserves to buy yen. Washington did not print dollars to weaken them; it liquidated a third currency. That is a materially different signal from a rate cut or a swap line, and it is why the move stuck. For the same dynamic playing out in a commodity currency this week, our AUD/USD forecast covers a pair facing the mirror-image problem.
Who is responding, and how the desks read it
The institutional reaction split along a fault line that is worth understanding, because it tells you what the market thinks it now owns.
On the official side the messaging was unusually joined-up. Finance Minister Satsuki Katayama framed the operation as continuing close communication with the US Treasury rather than a one-off. Bessent went further, saying Washington "will not hesitate to participate in further joint intervention" and that the US "strongly supports Japan's decisive market and monetary steps." Reuters photographed a notepad in front of the Treasury Secretary at a cabinet meeting at Camp David on 31 July reading "To Do Buy Japanese Yen $5-10 bil" — an unusually literal preview of an operation that is normally invisible until the monthly data lands.
On the sell side, the striking thing is how thoroughly the event overturned the prevailing view. Before it happened, Junya Tanase, chief Japan currency strategist at JP Morgan, had set out the standard objection: "Past coordinated intervention came in very rare circumstances such as during a financial crisis or a big natural disaster," adding that "the distance between joint rate checks to coordinated intervention is quite big." That was the consensus, and it was reasonable. It was also wrong within weeks — which is precisely why the repricing was violent rather than orderly.
Masahiko Loo, senior macro strategist at State Street, put the point most usefully for anyone sizing risk in this pair, judging that the signal "may be bigger than the intervention itself." That is the correct frame. A unilateral operation is a balance-sheet question: how many dollars does Tokyo hold, and how fast can it sell them. A coordinated one is a political question, and political questions do not have a published limit. The market cannot compute how much ammunition it is facing, so it discounts a wider tail on the topside.
Setser's caveat is the one that keeps the bear case honest. His argument is that intervention alone is insufficient and that Japan must deliver higher rates from its central bank for the yen to hold its gains, because the currency has weakened well beyond what Japan's fundamentals justify. Intervention buys time. Only the Bank of Japan can change the carry. Traders accessing this pair through a retail venue should note that spreads on USD/JPY widened materially during both 31 July and 3 August; our Pepperstone review covers how execution behaves in exactly these conditions.
The data: a widening gap and a rising yen
The chart below sets the last twelve months of USD/JPY against the three scenario levels this desk is working to. A higher line means a weaker yen.
Now the synthesis that the single-source view misses. Set the two official curves side by side, both as of 27 August 2026, one from the US Treasury and one from Japan's Ministry of Finance.
| Tenor | United States | Japan | Gap |
|---|---|---|---|
| Policy rate | 3.50–3.75% | around 1.00% | ~262 bp |
| 2-year | 4.20% | 1.696% | 250 bp |
| 10-year | 4.67% | 2.897% | 177 bp |
| 30-year | 5.19% | 4.038% | 115 bp |
Two readings fall out of that table. The first is that Japan's long end has already normalised further than most desks have updated for: a 30-year JGB at 4.038% and a 40-year at 4.043% are not the yields of a financially repressed bond market, and they compress the structural incentive for Japanese institutions to fund abroad. The second is the timing point that anchors this whole piece. The 10-year gap was wider on 31 July than it is today, because the US 10-year was at 4.75% that day against 4.67% now. The gap widened and the yen rallied 4.4% from its high. Any model that prices this pair off the differential alone was, on the two most important days of the year, pointing the wrong way.
The third input is inflation, and it is the most commonly misread number in the set. The BoJ's July Outlook Report cut the FY2026 core CPI forecast to +2.5% from +2.8% in April. Read alone that is dovish. Read in the Bank's own words it is not: the downgrade is attributed to "the effects of the government's measures to reduce the household burden of higher energy prices (electricity and gas charges) during summer." It is a subsidy artefact with an expiry date. Underneath it the Bank states that core inflation is "likely to accelerate to a level clearly above 2 percent from the second half of fiscal 2026," names "the recent depreciation of the yen" as one of the drivers, and marks the risks to its CPI outlook as "skewed to the upside." Current core CPI is running at around 1.5% precisely because of those subsidies. When they roll off, the print mechanically rises into a board that already has one member voting for 1.25%. The same AI-driven demand the Bank cites as supporting Japanese exports and semiconductor prices is visible in the numbers behind our Nvidia guidance analysis, and it is one reason Japan's terms of trade are not deteriorating as fast as the oil price alone implies.
Why coordinated intervention is rare, and what it costs
Joint currency intervention between the G7's two largest economies is rare for reasons that are structural rather than technical, and those reasons are now part of the risk in this pair.
The framework the operation cites is the Joint Statement of the Japanese and US Finance Ministers of September 2025, which sits inside the long-standing G7 and G20 language that exchange rates should be market-determined and that intervention is reserved for excessive volatility and disorderly movements — not for levels. That distinction is the whole ballgame. It explains the ¥11.7 trillion in May, when the move was fast, and the two consecutive zeroes in June and July, when the same pair went four yen higher in an orderly grind. On the Ministry's own doctrine, the pace is the trigger. The level is not.
It also explains why the operation drew criticism in Washington. The US Treasury's Exchange Stabilization Fund exists to smooth disorderly conditions, and selling euro reserves to prop up a trading partner's currency invites the question of whose disorder is being smoothed. Setser's framing was the sympathetic one — a destabilised yen pressures other Asian currencies and cuts against US reindustrialisation aims — but even that makes the intervention a means to an end that Washington controls and Tokyo does not.
For a trader the practical consequence is asymmetry. Above roughly 163, the pair is not merely testing a chart level; it is testing whether a second joint operation is politically available in a US election-adjacent autumn. That is unknowable in advance, it has no published size limit, and it can arrive in the illiquid hours. Below the market, by contrast, there is no equivalent policy floor: nobody in Tokyo intervenes to weaken the yen at 152. The risk is not symmetric, and positions sized as though it were are mispriced. This is the same regime-driven repricing that has run through metals this month, as our silver analysis sets out from a different angle.
One date closes the loop. The Ministry of Finance publishes its next monthly intervention total at the end of August, covering 30 July to 27 August. That release will show, for the first time, what Japan actually spent on 31 July. Until it lands, the size of the operation is an estimate — market participants have put Japan's leg near $59bn, and the Camp David notepad implied a US leg of $5–10bn — and the market is trading a number nobody has yet seen.
The call: base 157.50, bull 164.00, bear 152.00
Spot is 159.39. All three scenarios run to year-end 2026 and are expressed in price terms, so a higher number means a weaker yen.
Base case, 157.50 — roughly 50% likelihood. The joint operation caps the topside without reversing the trend, the Bank of Japan raises once more into year-end, and the pair grinds sideways to slightly lower in a 155–160 band. This is the path in which carry still pays — 250 basis points on the two-year is real money — but nobody is willing to hold a large short-yen position through a policy meeting any more. The characteristic price action is a slow drift up interrupted by sharp, unexplained air pockets.
RelatedCAD/JPY Forecast: 115.30 Bull Case vs 107.50 Bear Case
Bull case, 164.00 — roughly 25%. A weaker yen, and a new cycle high. This needs the BoJ to hold again on 18 September, US yields to stay near 4.70%, and crude to remain elevated enough to keep grinding Japan's terms of trade. Above all it needs the market to conclude that 31 July was a one-off and that Washington will not return. The tell would be a push through 163.91 that draws no official comment from either capital within 24 hours.
Bear case, 152.00 — roughly 25%. A stronger yen. This is Takata's dissent becoming the majority on 18 September, the energy subsidies rolling off into a core CPI print that starts with a 2, and a second joint operation confirming the first was a regime change rather than an accident. Note that this case does not require US yields to fall at all — which is exactly what made the August move so instructive.
What would change my mind. Three things, in order. First, the end-August Ministry of Finance release: a very large Japanese leg would suggest Tokyo did most of the work and the "coordination" was cosmetic, which weakens the whole thesis and lifts the bull case. Second, the 17–18 September Bank of Japan meeting, which follows the Federal Reserve's 15–16 September decision by roughly 24 hours — a hold with the dissent withdrawn would be a genuine dovish surprise. Third, a clean break and close above 163.91 with no official response, which would confirm that the intervention put has expired. A sustained move above 164.00 invalidates the base case outright.
Frequently asked questions
What is the USD/JPY forecast for the rest of 2026?
This desk's base case is 157.50 by year-end 2026, from 159.39 on 27 August, with a 164.00 bull case and a 152.00 bear case. The central expectation is a 155–160 range: the Bank of Japan tightening slowly while a still-wide 250 basis point two-year yield gap keeps the carry trade alive but no longer risk-free.
Does the Bank of Japan intervene at 160?
No. The published record shows the Ministry of Finance — not the Bank of Japan, which acts as its agent — spent ¥11.7 trillion in the month to 27 May 2026 and then nothing at all in the months to 26 June and 29 July, while the pair traded above 160 for 39 straight sessions. Official doctrine targets excessive volatility and disorderly moves, not a level.
What was the first joint US-Japan yen intervention since 1998?
On 31 July 2026 the US Treasury and Japan's Ministry of Finance bought yen in a coordinated operation, confirmed by both on 3 August. It was carried out under the September 2025 Joint Statement of the Japanese and US Finance Ministers. The US leg was funded by selling euros from Treasury reserves rather than by creating dollars.
Why did the yen rise when US yields were at their 2026 high?
Because the driver changed. On 31 July the US 10-year yield closed at 4.75%, its highest of 2026, and USD/JPY still fell 2.70 yen that day and 3.56 the next. The interest-rate differential was at its widest while the yen had its strongest two sessions of the year, which tells you positioning and policy risk, not carry, set the price.
When is the next Bank of Japan meeting?
The next Monetary Policy Meeting is 17–18 September 2026, about 24 hours after the Federal Reserve's 15–16 September decision. The policy rate has been around 1.0% since 17 June 2026. At the 31 July meeting the board held by 8–1, with Takata Hajime dissenting in favour of 1.25%, so the September vote count will matter as much as the decision.
What does a higher USD/JPY number mean?
A higher number means a weaker yen. USD/JPY expresses how many yen one US dollar buys, so a move from 159 to 164 means the dollar buys more yen and the yen has depreciated. A move to 152 means the yen has strengthened. In this analysis the bull case is dollar strength and yen weakness; the bear case is the reverse.
Disclaimer
This article is analysis and information only. It is not financial, investment or trading advice, and it is not a recommendation to buy or sell any currency, instrument or product. Foreign exchange and leveraged derivatives carry a high level of risk and can result in losses that exceed deposits. Prices and forecasts quoted here were accurate at the time of writing and will change. Capital is at risk. Readers should conduct their own research and consider seeking advice from an appropriately licensed professional.