

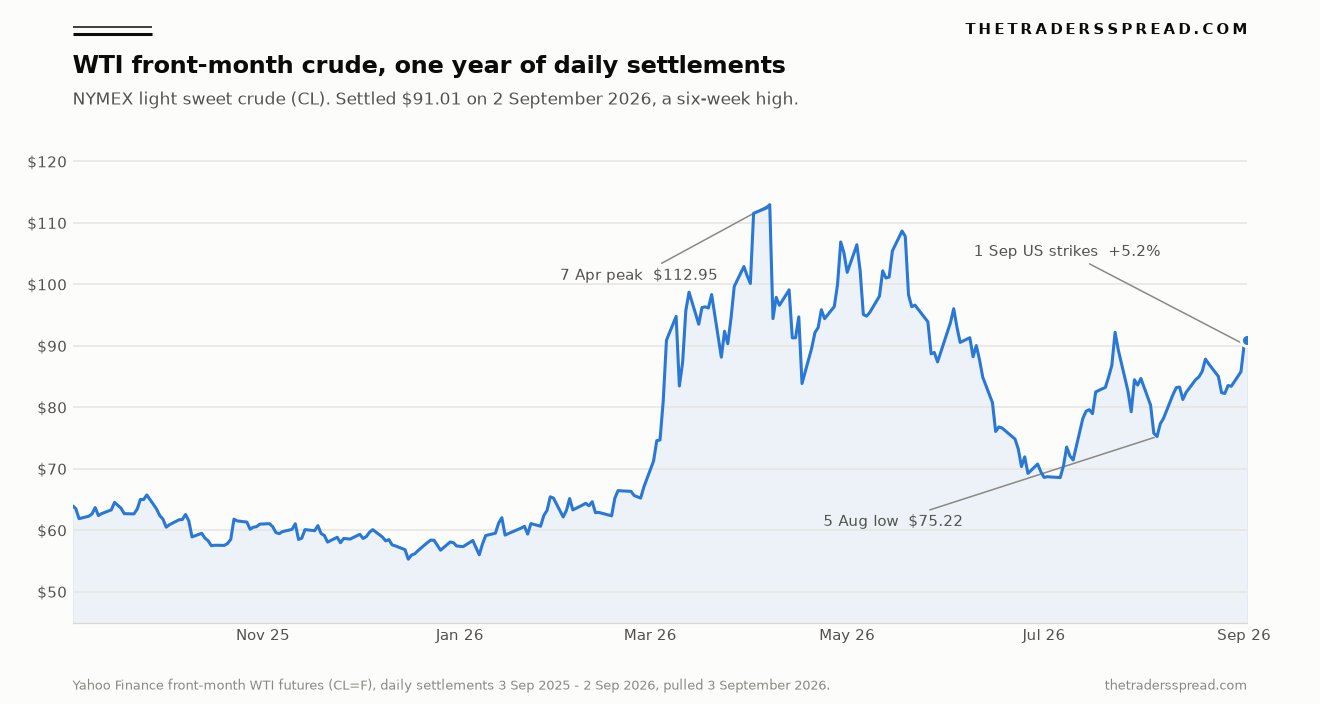
The question underneath a 21% move in a month is narrower than the headlines make it sound: has crude actually gone missing, or has the market simply run out of room to absorb the next barrel that does? Front-month WTI gave a partial answer on Tuesday 1 September, settling up $4.46, or 5.2%, at $90.22 within hours of US Central Command announcing that American forces had begun striking Islamic Revolutionary Guard Corps targets inside Iran.
It climbed again on Wednesday to settle at $91.01, a six-week high, and was quoted at $89.94 at 08:19 GMT on Thursday as the rally paused. Measured against the 5 August settlement of $75.22, that is a gain of 21.0% in four weeks. Brent covered similar ground at a slightly slower pace, running from $79.45 to $95.63 over the same stretch and quoting $94.49 on Thursday morning. All four prices are NYMEX and ICE front-month futures, pulled from Yahoo Finance on 3 September 2026.
The physical record for those same four weeks says something the price alone does not. Barrels are arriving. US Energy Secretary Chris Wright told CNBC on Wednesday that more than 17 million barrels of crude and products moved through the Strait of Hormuz on Monday 31 August, the largest daily volume since the war began on 28 February. What has gone missing is not the flow. It is the cushion behind it. American commercial crude inventories are 3.8 million barrels above where they sat a year ago, the Strategic Petroleum Reserve is 118.1 million barrels lower, refiners are running at 98.0% of capacity, and Cushing holds 22.5 million barrels. A market carrying no slack reprices violently on news that a market carrying slack would absorb without moving.
Key facts
- WTI front-month settled $91.01 on 2 September, up 21.0% from $75.22 on 5 August — Yahoo Finance front-month futures (CL=F), pulled 3 September 2026
- WTI added $4.46, or 5.2%, on 1 September, the day US Central Command opened a strike wave on IRGC targets — Reuters, 1 September 2026
- US commercial crude stocks fell 4.5 million barrels to 424.5 million in the week to 28 August; the SPR fell 3.1 million to 286.6 million, down 29.2% year on year — EIA Weekly Petroleum Status Report, 2 September 2026
- Refinery utilisation hit 98.0%, with Midwest refiners at 103.5% of nameplate capacity — EIA, week ending 28 August 2026
- Cushing, Oklahoma held 22.5 million barrels, against 24.2 million a year earlier — EIA, week ending 28 August 2026
- Hormuz transits averaged 4.9 million b/d in 2Q26, against 21.6 million b/d in 4Q25 — EIA Short-Term Energy Outlook, 11 August 2026
- December 2027 WTI traded $19.43 below the front month on Thursday morning, a 21.6% discount — NYMEX contract quotes, 08:19 GMT 3 September 2026
The barrels are moving. The buffer is not.
Wright's number is contested, and the contest matters more than the number. Ship-tracking firm Kpler counted four commodity vessels crossing Hormuz on Tuesday 1 September, down from ten on Monday, and market analysts have disputed earlier Energy Department estimates, putting actual flows in early August at four to six million barrels a day against Wright's claim of nearly nine. Administration officials answer that external trackers undercount because masters switch off transponders to avoid being targeted. Both sides are probably right, which is the problem: nobody trading this market can settle a bet on how much crude left the Gulf yesterday.
Set the dispute aside and look at the tanks instead. The Energy Information Administration reported on 2 September that US commercial crude stocks fell 4.5 million barrels in the week to 28 August, to 424.5 million, the first draw since late July. Total crude including the reserve stands at 711.1 million barrels, down 114.4 million, or 13.9%, from a year ago. Nearly all of that decline is the Strategic Petroleum Reserve, which has been drained 118.1 million barrels in twelve months and gave up another 446,000 barrels a day in the reported week. Washington has been meeting the shortfall out of the emergency stockpile rather than out of the market.
That is the trade the price is expressing. Not a shortage of crude today, but the steady exhaustion of the thing that makes a shortage survivable.
The rest of the barrel count runs the other way, which is why the rally has been so jumpy. Domestic production printed 13.862 million barrels a day, up 439,000 on the year. Crude imports jumped 612,000 b/d week on week to 6.77 million. Exports rose 691,000 b/d to 4.483 million, a sign Gulf Coast crude is still finding foreign buyers. Supply, in the narrow accounting sense, is fine. Resilience is not.
What is Cushing actually telling anyone?
Cushing is the delivery point for the NYMEX contract, and its tank level is the closest thing the WTI market has to a physical conscience. It sat at 22.5 million barrels on 28 August, a fraction above the prior week's 22.4 million and 1.7 million below the same week of 2025. Working capacity in the Cushing hub runs to roughly 78 million barrels, so the tanks are around a quarter full. Operators generally treat anything under about 20 million as tank bottoms.
Twenty-two and a half million barrels is not an emergency. It is thin enough that a single week of heavy Midwest refinery pull can move the whole curve, and Midwest refiners have been pulling hard. PADD 2 ran at 103.5% of nameplate capacity in the reported week, and crude inputs across all five districts reached 17.496 million barrels a day, 627,000 above last year.
Look at the Brent-WTI differential and the same story appears from another angle. Brent settled $4.62 above WTI on 2 September. On 27 August, the gap was $6.17. WTI gained 9.0% over those four sessions against Brent's 6.6%, which is the opposite of what a pure Middle East risk premium should do to a landlocked American grade. The premium narrowed because seaborne crude now carries a freight and insurance bill that Cushing barrels do not, and because US refiners running at 98% would rather bid for something that arrives by pipeline. Traders are paying up for domestic molecules precisely because the water has become expensive.
Refiners became the marginal buyer
The most useful number in this rally is not a crude price at all. It is the spread between crude and what comes out the other end of a refinery.
Take the 2 September settlements. NYMEX RBOB gasoline closed at $3.1038 a gallon, which is $130.36 a barrel, leaving a gasoline crack of $39.35 over WTI. Heating oil, the contract that prices diesel and stands in for global middle distillate, settled at $4.6822 a gallon, or $196.65 a barrel, for a distillate crack of $105.64. A year earlier, on 3 September 2025, the same distillate crack was $35.19. It has roughly tripled.
Now run the month. Between 5 August and 2 September, WTI rose 21.0%. Heating oil rose 23.3% and gasoline rose 9.3%. The distillate crack widened by $21.42 a barrel over a month in which crude gained sixteen dollars; the gasoline crack narrowed by $4.66. This is not a crude shortage transmitting evenly through the barrel. It is a middle distillate squeeze, and it is why refiners keep bidding for crude even as crude gets more expensive: every incremental barrel of diesel they make is worth more than a hundred dollars over the feedstock.
The inventory data agrees. US distillate stocks stand at 104.2 million barrels against 115.9 million a year ago, a 10.1% shortfall, with East Coast distillate down to 19.3 million from 28.7 million. Gasoline stocks are 205.7 million against 218.5 million. The Gulf that Hormuz gates is not only a crude exporter; it is one of the world's largest sources of jet fuel and diesel, and those are the barrels that have not been replaced.
The curve prices a war that ends
Whatever the spot market believes about this week, the forward curve is unambiguous about the shape of the problem. Backwardation of this depth is the market paying a premium for immediate possession and refusing to pay it for possession eighteen months out.
| NYMEX WTI contract | Quote, 08:19 GMT 3 Sep 2026 | Discount to front month |
|---|---|---|
| October 2026 (front) | $89.94 | — |
| November 2026 | $87.16 | $2.78 |
| December 2026 | $84.13 | $5.81 |
| March 2027 | $77.09 | $12.85 |
| June 2027 | $73.58 | $16.36 |
| December 2027 | $70.51 | $19.43 |
A $19.43 discount from front month to December 2027, 21.6% of the front price, is the market putting a number on the duration of the disruption rather than its severity. It closely tracks the official view. The EIA's August Short-Term Energy Outlook forecast Brent averaging $85 a barrel in the third quarter, $78 by the fourth and $69 across 2027, and stated that "it will take until early 2027 for production and trade patterns to generally return to pre-conflict status." The same report put Hormuz transits at 4.9 million b/d in the second quarter against 21.6 million b/d in the fourth quarter of 2025, assessed production shut-ins at 5.5 million b/d in July, and estimated global inventories falling by an average of 4.2 million b/d in 2Q26 with a further 3.8 million b/d draw forecast for the third quarter.
History is unkind to anyone reading a 20% month as a trend. WTI has posted nine monthly gains of 20% or more since 2000. April 2015 rose 23.6% and gave back 21.0% over the next quarter; April 2026, the month Hormuz first closed, rose 61.1% to a $112.95 peak and then fell 19.4%. May 2020 and December 2020 each added another 20% or more. The deciding variable was whether the physical dislocation persisted.
The freight bill nobody quotes
Ask a shipbroker what oil costs and the answer includes a line the futures screen does not show. Charter rates for a very large crude carrier on the Middle East to China run reached close to $498,000 a day in late August, against roughly $200,000 before the war, as owners withdrew tonnage from the Gulf.
Insurance has done something more extreme. Lloyd's List reported in March that Hormuz transit cover was being quoted at about 2.5% of hull value for most tonnage and 5% for vessels with US, UK or Israeli connections, three times the rate charged to everyone else. On a five-year-old VLCC valued near $138 million, that is a war risk premium of $10 million to $14 million for a single voyage. Dylan Mortimer, hull war lead at broker Marsh, told the publication that average ratings across the wider market sat between 0.8% and 1.5%. Chris Jones, chief executive of the International Underwriting Association, confirmed cover remained available. During the tanker war of the 1980s, the comparable rate was around 5%.
Freight and insurance are the reason the same barrel is worth different money in different places, and the reason the Brent-WTI relationship has behaved oddly. They are also the most reliable early warning available. A rate that stops rising says shipowners have decided the escort arrangements work.
Producers have started to respond, slowly. Diamondback Energy broke publicly with the capital discipline the sector adopted after 2022, adding two to three rigs and five completion crews and lifting 2026 capital spending from $3.75 billion to $3.9 billion. Chief executive Kaes Van't Hof retired the company's "stoplight" framing in May, saying "the light has turned green." The barrels that money buys arrive in 2027, which is roughly where the curve says the price will already have gone.
What this changes
The immediate consequence is not the crude price. It is the diesel price, and everything indexed to it. A distillate crack above $100 a barrel with US inventories 10.1% below last year pushes refiners toward maximising middle distillate yield, which means running heavier, sourer crude where they can get it and pulling more feedstock out of Cushing and the Gulf Coast. That keeps American crude inventories drawing even in weeks when imports are strong, and it keeps trucking, rail, farm and airline costs rising well after crude stops.
RelatedEU Carbon Price Rises to €82.32 on the Q3 CBAM Print
The second consequence is the reserve. Drawing the SPR at 446,000 barrels a day suppresses the visible price of a supply gap while removing the instrument that would cap the next one. At 286.6 million barrels, the reserve has 29.2% less in it than a year ago. Any future refill is itself a bid, and it will land in a market the curve currently expects to be much cheaper by 2027.
The third is what a resolution would do to positioning. The curve is $19.43 backwardated. If Hormuz throughput holds near the levels Wright described and shipping rates ease, the front of the curve has considerably further to fall than the back, and anyone financing inventory against a steep backwardation finds the carry inverting quickly.
Three things are worth watching over the next fortnight. Weekly Cushing stocks, because a build below 22 million or a drop toward tank bottoms will move the WTI contract more than any headline out of the Gulf. The distillate crack, because it, and not crude, is where the actual scarcity currently sits. And VLCC rates on the Gulf to Asia run, which price the willingness of shipowners to enter the strait more honestly than any official statement about transits.
Event traders are pricing the same duration question directly, in the Strait of Hormuz reopening odds and the Iran blockade market. Elsewhere in the complex, the natural gas outlook and the gold analysis cover the two markets most exposed to the same shock, and the USD/CAD forecast tracks the currency tied most tightly to WTI.
Frequently asked questions
Why did WTI rise more than Brent during a Middle East escalation?
Because the incremental cost of moving seaborne crude has risen faster than the risk to the crude itself. Charter rates on the Gulf to Asia run approached $498,000 a day in late August and Hormuz war risk cover has been quoted at multiples of pre-war levels. US refiners running at 98.0% of capacity have bid for pipeline-delivered domestic barrels instead, narrowing the Brent premium from $6.17 on 27 August to $4.62 on 2 September.
What does the backwardation in the WTI curve mean?
December 2027 WTI traded $19.43 below the October front month on 3 September, a 21.6% discount. A curve that steep prices immediate scarcity and expects it to resolve. It aligns with the EIA's August outlook, which forecast Brent averaging $69 a barrel across 2027 and said production and trade patterns should return to pre-conflict status by early that year.
How much oil is actually passing through the Strait of Hormuz?
Estimates conflict. US Energy Secretary Chris Wright said more than 17 million barrels transited on Monday 31 August, the highest since the war began, rising to 21 to 22 million including bypass pipelines. Kpler counted four commodity vessels crossing on Tuesday against ten on Monday, and analysts have put earlier flows well below official figures. Pre-war throughput was roughly 20 million barrels a day.
Why is diesel tighter than gasoline?
The Gulf is a major exporter of jet fuel and diesel as well as crude, and those product cargoes have not been replaced. US distillate stocks are 104.2 million barrels against 115.9 million a year ago, a 10.1% shortfall, while gasoline is down 5.9%. Between 5 August and 2 September the distillate crack widened $21.42 a barrel while the gasoline crack narrowed $4.66.
How low can Cushing inventories go?
Cushing held 22.5 million barrels on 28 August against working capacity of roughly 78 million. Operators typically treat about 20 million as tank bottoms, the point at which blending and pipeline operations degrade rather than simply run low. The hub therefore has a few million barrels of practical room, which is why weekly Cushing data moves the WTI contract disproportionately.
This article is analysis and reporting, not investment advice. Commodity futures are leveraged instruments and capital is at risk. Prices cited were pulled live on 3 September 2026 and will have changed. Do your own research and consider professional advice before making any financial decision.