

What is the Strait of Hormuz contract actually pricing? Not whether Gulf crude reaches its buyers, and not whether Washington and Tehran shake hands. It pays on one number published by the International Monetary Fund: a seven-day moving average of transit calls through the strait, and whether that average touches 60 on any day before 31 December. At 08:54 UTC on 1 September the Yes leg traded at 28.5% on Polymarket's Strait of Hormuz normalisation market, against $10,115,744 of lifetime volume and $448,409 of resting liquidity, with a book of 28 bid, 29 offered. The most recent PortWatch print, for 23 August, puts that seven-day average at 5.00.
Five. The barrier is sixty, and 121 days remain.
Here is the part that does not appear to be priced. On 28 August, ING's commodities desk wrote that "we've been assuming oil flows through this key chokepoint have averaged 5m b/d. However, some suggest volumes could be as high as 6-8m b/d." Set that against the contract's own resolution source. The US Energy Information Administration put pre-crisis Hormuz oil flow at 21 million barrels a day in 2022, so ING's working assumption has the strait running at roughly 24% of normal. IMF PortWatch, the dataset this market settles on, shows August tanker deadweight through Hormuz at 0.68% of its February level. Two readings of the same waterway, taken in the same week, differing by a factor of about 35 on ING's own assumption and by 56 at the top of the range others are quoting. The crowd is trading a shipping recovery. The contract pays on a satellite-reporting series. Those are not the same instrument, and right now they disagree by more than an order of magnitude.
What the numbers say
- Market price 28.5% for Yes, 71.5% for No, on $10,115,744 volume and $448,409 liquidity — Polymarket gamma-api, pulled 1 September 2026, 08:54 UTC.
- Our fair value: 13%, a gap of 15.5 percentage points, with the market trading above where we think it belongs.
- Current seven-day moving average: 5.00 transit calls a day (17–23 August: 4, 6, 6, 5, 4, 7, 3) — IMF PortWatch daily chokepoint data, latest published date 23 August 2026.
- The 60 barrier equals 76.6% of the February 2026 mean of 78.29 calls a day. Today's reading is 6.4% of that baseline (IMF PortWatch, computed 1 September 2026).
- Tanker deadweight fell 99.3%, from 2,023,161 DWT a day in February to 13,659 in August; tanker transits went from 43.5 a day to 1.9 (IMF PortWatch).
- Last time the seven-day average touched 60: 2 March 2026, 183 days ago, at 63.3 (IMF PortWatch).
- The price has fallen 30 points in a month and four in the past week, per Polymarket's own price-change fields, 1 September 2026.
The instrument, not the waterway
The resolution text is unusually specific, and the specificity is the whole trade. Yes requires that "IMF Portwatch publishes a 7-day moving average of transit calls ('Arrivals of Ships') for the Strait of Hormuz equal to or above 60 for any date between market creation and December 31, 2026." Container, dry bulk, roll-on/roll-off, general cargo and tanker vessels all count. Then comes the clause that most participants seem to skate past: "Ships not reported by IMF Portwatch will not be considered."
PortWatch is built on AIS transponder data. It counts vessels that broadcast their position and are matched to a chokepoint polygon. It does not count cargo, it does not count barrels, and it cannot count a ship that has switched its transponder off.
That matters more here than it would at Suez or Panama, because the vessels most likely to be moving through a contested Hormuz right now are precisely the ones with the strongest reasons to go dark: sanctioned cargoes, insurance-marginal operators, state-linked charterers. If physical flows recover while AIS reporting does not, the print stays low and Yes gets mechanically harder than 28.5% suggests. The reverse is also true, and it is the honest version of the bull case. Transponders are a switch, not a supply chain. Flip them back on at a ceasefire and the series can snap several fold in a fortnight without a single additional barrel moving.
So the contract is a wager on a measurement regime as much as on a geopolitical outcome. Anyone modelling it from oil-flow estimates is modelling the wrong variable.
Transits peaked in June and have been falling since
The monthly series is not ambiguous. Hormuz averaged 58.45 transit calls a day in January and 78.29 in February. March collapsed to 3.19. What followed was a partial, stuttering recovery: 7.13 in April, 3.94 in May, then 12.93 in June and 10.19 in July. August, through the 23rd, averaged 4.91.
The seven-day average peaked at 31.9 on 29 June. That is the high-water mark of the entire post-March period, and it is barely half the barrier. Since then the series has given back two-thirds of its gains. The last time the seven-day average even reached 25 was 1 July, 62 days ago.
A market at 28.5% is therefore not extrapolating the trend. It is pricing a break in the trend, and pricing it as though the break has better than a one-in-four chance of arriving with enough runway left to compound into a sixty-a-day weekly average.
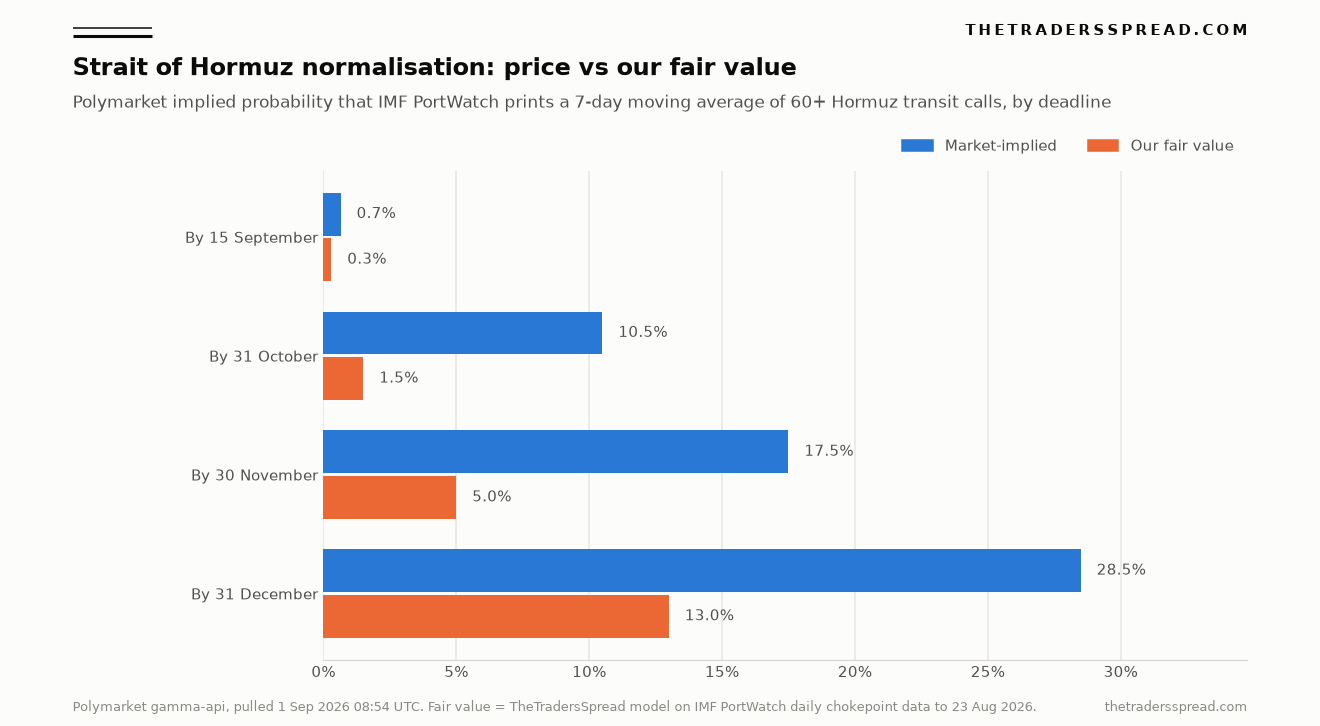
The full ladder of deadlines is where the pricing gets interesting, because Polymarket lists four of them and they can be read against each other. Every figure below was pulled live from gamma-api at 08:54 UTC on 1 September, and the whole ladder is visible on the December contract page.
| Deadline | Yes price | Volume | Liquidity | Our fair value |
|---|---|---|---|---|
| 15 September | 0.65% | $1,110,683 | $109,986 | 0.3% |
| 31 October | 10.5% | $305,646 | $134,212 | 1.5% |
| 30 November | 17.5% | $178,356 | $85,272 | 5.0% |
| 31 December | 28.5% | $10,115,744 | $448,409 | 13.0% |
Strip that into conditional hazard rates and the market's own logic surfaces. It assigns 10.5% to the barrier being cleared at any point in the next two months. It then assigns 7.8% to November alone, conditional on October having failed. And 13.3% to December alone, conditional on November having failed. The implied monthly probability of a sixty-print therefore rises as the deadline approaches, nearly doubling between November and December.
Physical recoveries do not work that way. Traffic either inflects or it does not, and the longer a chokepoint sits at 6% of baseline the more entrenched the rerouting, the insurance repricing and the charter-party language become. The rising hazard curve is the signature of a market pricing a political event with a deadline, not a shipping series with momentum.
Does the Suez precedent apply here?
Partly, and the part that applies is unkind to the Yes side of the price. The same PortWatch dataset carries Suez and Bab el-Mandeb through their own disruption, which gives a clean out-of-sample base rate for the question "how fast does a chokepoint come back?"
Using January to October 2023 as the pre-crisis window, Suez averaged 73.6 transit calls a day. In August 2026, thirty-two months later, it averaged 40.9, or 55.5% of baseline. Bab el-Mandeb went from 74.6 to 27.8, which is 37.3%. Neither has recovered.
The sharper number is the ceiling. Since February 2024, once the initial disruption had fully bedded in, the best seven-day moving average Suez has produced is 46.1 calls a day, on 13 May 2024, or 62.7% of its pre-crisis level. Bab el-Mandeb's best is 42.6 on 26 February 2026, which is 57.1%. In thirty-one months, across two chokepoints and two separate diplomatic tracks, neither series has printed a single week above 63% of normal.
Hormuz needs 76.6%. It needs it inside 121 days. It needs it starting from 6.4%.
The counter-argument deserves stating at full strength, because it is genuinely the best thing the other side has: Hormuz is not Suez. Suez has an alternative, and shipowners took it, sailing round the Cape and absorbing the cost. Hormuz has no bypass. Every barrel leaving Kuwait, Qatar, Bahrain, Iraq's southern terminals and most of Saudi Arabia's eastern fields has to pass through it or stay in the ground. The snapback incentive is therefore far stronger than anything Suez ever generated, and a recovery there could be steeper than the Red Sea analogue implies. That is why our residual probability is set generously rather than at the base rate.
The strongest case against us
ING's own coverage cuts both ways, and the second half of it is a live counter-signal we take seriously. Writing on 31 August, Warren Patterson, Head of Commodities Strategy at ING, and Ewa Manthey, Commodities Strategist at the same firm, noted that "oil producers in the region have grown more comfortable shuttling crude through the key chokepoint in recent weeks". That is a direct observation of behaviour on the water from a desk that watches it professionally, and it is not what a series pinned at five transits a day would lead you to expect.
Two readings can reconcile it. Either the AIS gap is real and widening, in which case producers are indeed moving more crude while PortWatch stays flat — which makes the physical story better and the contract harder at the same time. Or the comfort is concentrated in a small number of large, heavily escorted cargoes that lift volume without lifting vessel counts, which is the same conclusion by a different route. Deadweight per tanker transit collapsed alongside the count, which argues against the second reading, but not decisively.
Patterson and Manthey attached their own caveat in the same note: "Further escalation could put these flows under renewed pressure." Three days earlier, in the 28 August edition of the same Commodities Feed, Patterson and Manthey were blunter: "However, we're clearly still far from normalisation."
We think the balance of that evidence supports a low number rather than a high one. But a desk that cannot state the opposing case in its strongest form has not done the work, and this is the version that would cost us: a settlement lands in early October, transponders come back on across the Gulf fleet within days, and the series prints 60 on reporting alone.
The book argues with itself
Polymarket lists enough adjacent Hormuz contracts to check the December price for internal consistency, and it does not survive the check cleanly.
The liquid political leg — whether the US announces an end to the Iranian blockade by 31 December — trades at 63.8%, on $1,256,435 of volume and $189,091 of liquidity. Divide the shipping contract by the political one and you get the market's implied conditional: 44.7%. In words, if Washington formally lifts the blockade at some point before New Year, the same book gives it a 44.7% chance that PortWatch's seven-day average climbs from 5 to 60 before the year is out. Given that the announcement itself carries no deadline earlier than 31 December, a meaningful slice of that mass would need the physical recovery to complete in weeks.
The near-dated ladders say something different again. The market on how many ships transit Hormuz in the week of 31 August puts 77.5% on the 20-to-39 bucket, which is roughly three to six a day, and 0.3% on 80 or more. The end-of-September average-transits market puts 86.5% of its mass below 15 a day and 4% on 30 or more. Both books are thin, at $16,435 and $8,475 of lifetime volume respectively, so read them as sentiment rather than price. Read that way they still say the same thing the data says: nobody trading the near term expects a fourfold jump, and the December contract needs a twelvefold one.
Then there is the record. Four earlier versions of this exact contract have already resolved — by 30 April, by 15 June, by end of May and by end of June — carrying $128,829,279 in combined volume between them. Every one resolved No. Serial over-optimism on a repeating contract is not proof that the current version is mispriced, but it is a strong prior about which way this particular crowd leans, and it is consistent with what we found when we looked at the September blockade leg at 23.5% on 30 August. That leg has since traded down to 18.5%.
RelatedSerbia Parliamentary Election: Vučić at 60.5%, Fair Higher
Where we come out
Our fair value is 13%. The market is at 28.5%, putting the price 15.5 points above our estimate and rather more than double what we think the contract is worth. In absolute terms that is a narrower gap than the 46 points we flagged on the Anthropic IPO market. It sits on a much denser book, though: $10.1m of volume, against a settlement series that has spent two months moving away from the number the price requires.
The arithmetic behind 13% is deliberately generous to the other side. We put roughly a one-in-three chance on a political settlement landing early enough, call it mid-November, to leave any runway at all. Conditional on that, we allow a 35% chance the barrier is actually cleared inside the residual window. Multiply and you get 11.6%. We add a small allowance for a pure reporting snapback, the scenario where transponders return faster than cargo, to reach 13%. That 35% is well above what the Suez and Bab el-Mandeb base rates would support on their own, and it is set high specifically because Hormuz has no bypass.
The lower deadlines follow the same model and are shown in the table above. At 31 October our 1.5% against a market at 10.5% is the widest proportional gap on the ladder, largely because the physical lag alone makes it nearly unreachable: a settlement would have needed to land around 5 September, and the political ladder itself prices that at under 4%.
What would change our mind. A transit agreement that is both signed and implemented before roughly 1 November, accompanied by a visible inflection in the PortWatch series — the seven-day average clearing 25 within three weeks of a signature — would force a material revision upward. So would direct evidence that the AIS gap is closing, since that alone could carry the print to 60 with no change in real cargo moved. A single week above 25 would not do it. A three-week trend that holds, from a dated agreement, would. Absent both, a series sitting at 6.4% of its February baseline with 121 days on the clock, against a barrier no comparable chokepoint has cleared in thirty-one months of trying, does not look like a one-in-four proposition to us. The current state of the ladder is public on Polymarket and worth checking against the PortWatch print each week, since the data updates faster than the price does.
FAQ
What exactly has to happen for this market to resolve Yes?
IMF PortWatch has to publish a seven-day moving average of Hormuz transit calls at 60 or above for any single date before 31 December 2026. It resolves the moment such a value appears. If no data has been published for 31 December within 14 calendar days, it settles on whatever has been published by then.
Why does the AIS data matter so much?
PortWatch counts vessels that broadcast an AIS position and are matched to the chokepoint. The resolution text states plainly that ships not reported by PortWatch are not considered. So a tanker crossing with its transponder off is invisible to the contract even though it is entirely visible to the oil market, which is why flow estimates and the settlement series have diverged so far.
How far is the strait from normal right now?
The seven-day average stood at 5.00 transit calls a day on 23 August, against a February 2026 mean of 78.29. That is 6.4% of the pre-crisis baseline. Tanker deadweight has fallen 99.3% over the same span, from 2,023,161 DWT a day to 13,659.
Has any comparable chokepoint recovered this fast before?
No. Since February 2024, Suez has not printed a seven-day average above 62.7% of its pre-crisis level, and Bab el-Mandeb has not exceeded 57.1%. Hormuz needs 76.6% within 121 days. Both comparisons come from the same IMF PortWatch dataset the contract settles on.
Does a US-Iran deal automatically mean the market resolves Yes?
No, and that is the central confusion in the pricing. The blockade-announcement contract trades at 63.8% for 31 December while the shipping contract trades at 28.5%, implying a 44.7% conditional. A signature is a necessary condition, not a sufficient one; the vessels then have to sail, be insured, and be seen.
Where can the underlying data be checked?
IMF PortWatch publishes daily chokepoint transit calls at portwatch.imf.org, with the full series available through its public ArcGIS feature service. Prices, volume and liquidity in this piece were pulled from Polymarket's gamma-api at 08:54 UTC on 1 September 2026, not from a third-party summary.
Related reading from the desk: our natural gas outlook covers the energy complex this chokepoint feeds, and the French presidential market applies the same fair-value method to a political contract.
Analysis and information only. Nothing here is financial advice, a recommendation, or an offer to transact. Prediction-market contracts can settle at zero and capital is at risk. Figures are accurate as at 1 September 2026 and prices move.