

A prediction-market curve with five expiry dates looks like five separate forecasts. On the Iran blockade market it is one. Polymarket's US announces end of Iranian blockade event carries four open legs, and every one of them can be reproduced to within 1.2 percentage points from a single number: a constant hazard rate of 0.88% per day, or 5.99% per week. Anchor the exponential on the December leg at 66.5¢ and it spits out 24.59% for 30 September against a traded 23.50%, and 42.63% for 31 October against a traded 41.50%. That is not four opinions about Iran. It is one opinion, extrapolated.
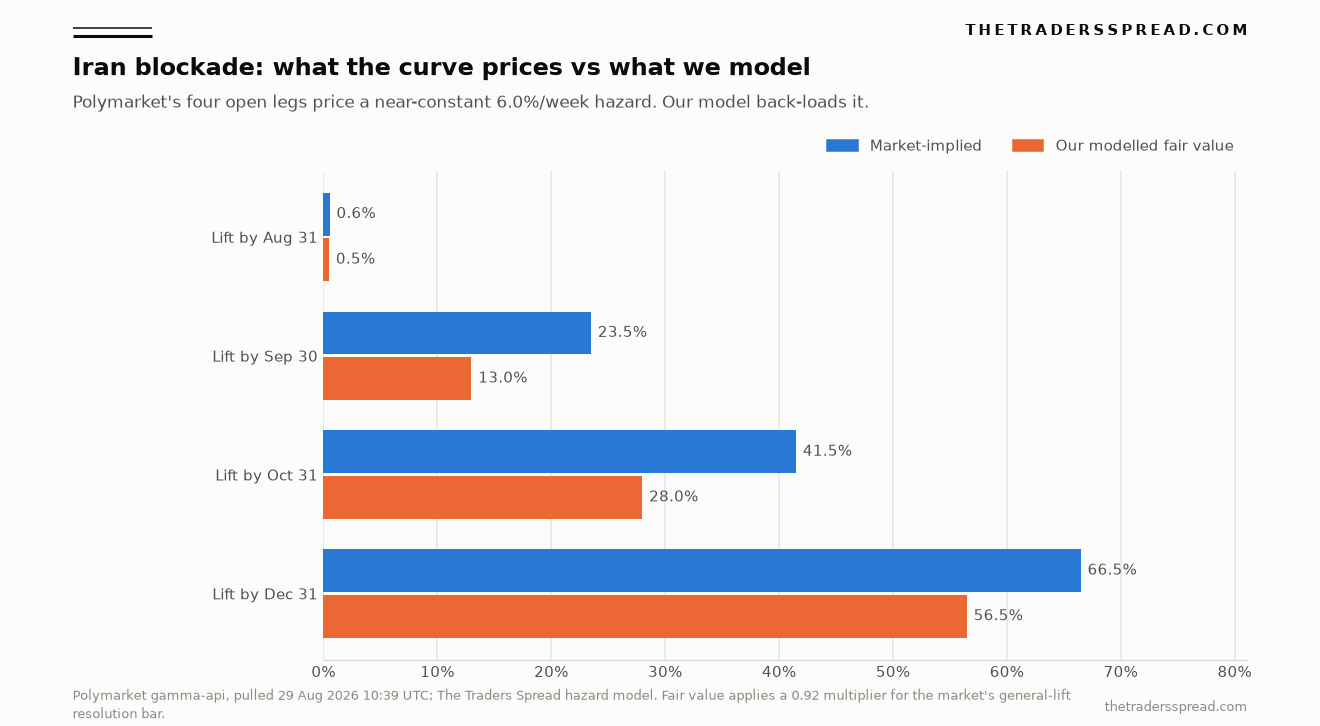
Which would be defensible if the underlying event were memoryless. It is not. A qualifying resolution here requires the United States government to make a present, decided, official announcement that the naval blockade is over — a discrete political act, taken by a small number of people, on a calendar shaped by summits and deadlines. And the market itself knows this, because the one leg that breaks the exponential fit is the front one. The 31 August leg should trade at 1.75% under a constant hazard. It trades at 0.55¢ — 69% below. Traders apply "nothing is visibly in train" logic across the next 48 hours, then abandon it across the next 32 days. Extend that same discount over a three-week diplomatic lead time and September prices at 14.4%, not 23.5%. Our own bottom-up model lands at 11.9%. We put fair value at 13%.
Key facts
- 23.5¢ — the traded price on "US announces end of Iranian blockade by September 30, 2026", bid 23 / ask 24, on $2.09m of volume and $145,452 of book liquidity (Polymarket gamma-api, pulled 29 August 2026, 10:39 UTC).
- 5.99% per week — the constant hazard rate that reproduces all four open legs to a mean absolute error of 0.85pp (The Traders Spread calculation on the same pull).
- 1.45¢ — the price of a signed US-Iran final nuclear deal by the same 30 September date, on $1.32m of volume. The blockade leg is 16.2 times higher.
- 22.5% — the probability the same venue assigns to a qualifying US military strike on Iran by 30 September, derived from the ceasefire contract at 77.5¢. Statistically indistinguishable from the 23.5% it assigns to a full stand-down.
- 5.0 — the seven-day moving average of daily transit calls through the Strait of Hormuz on 23 August 2026, against a pre-crisis August 2025 average of 92.4 (IMF PortWatch, data to 23 August 2026). A 94.7% year-on-year collapse.
- 174 days — consecutive days that seven-day average has sat below 60, the threshold Polymarket uses to define "normal". It was last above it on 2 March 2026.
- 20 million b/d — oil transiting Hormuz in 2024, about 20% of global petroleum liquids consumption and more than a quarter of seaborne oil trade, against roughly 2.6 million b/d of usable bypass pipeline capacity (US Energy Information Administration, 16 June 2025).
What the contract actually asks
The blockade is 47 days old. Polymarket's own resolution text dates it: "On July 13, 2026, Trump announced the United States would reinstate its naval blockade of Iran, targeting Iranian ships and customers." The market resolves YES only if Washington "publicly and officially announces the end, termination, lifting, or suspension" of that blockade before 11:59pm ET on the listed date.
The bar is narrower than the headline suggests, and the exclusions are where pricing gets interesting. An announcement "does not qualify if it reflects only a limited or partial change that stops short of a general end or suspension of the blockade, for example, an exemption for a specific vessel, cargo, or port." Nor do "statements that describe a prospective, contingent, probable, or conditional end to the blockade rather than announcing a present and decided position." Leaks, unattributed briefings and third-party analysis are all explicitly excluded.
Two clauses cut the other way. A fee regime imposed in place of interdiction still counts as a lift. And once a qualifying announcement is made, the market "will resolve to Yes regardless of whether it is later reversed" — so a lift that collapses within a week still pays. Netting the four exclusions against the two allowances, we apply a 0.92 multiplier to our raw probability. That is deliberately conservative; the historical pattern for unwinding US interdiction and sanctions regimes is incremental relief through licences, waivers and carve-outs, and almost none of that phrasing clears this contract's wording.
The physical backdrop sets the size of the decision. The US Energy Information Administration, in an analysis by Candace Dunn and Justine Barden published on 16 June 2025, describes chokepoints as "narrow channels along widely used global sea routes that are critical to global energy security", and puts 2024 Hormuz throughput at 20 million barrels a day. Saudi Arabia alone accounted for 38% of those crude flows, at 5.5 million b/d, and only about 2.6 million b/d — roughly 13% of the total — can be re-routed through the Saudi East-West and UAE pipelines. This is not a decision a US administration reverses casually, in either direction. For how the same risk premium has been transmitting into metals, see our read on silver at $69.57 and a gold ratio of 66.
The market has already repriced itself once
The September leg opened on 28 July at 65.5¢. It peaked at 85.5¢ on 8 August. It closed 28 August at 26.5¢ and trades 23.5¢ now. That is a 62-point round trip in 21 days on a contract whose underlying question has not changed.
Convert those prices into hazard rates and the movement is sharper still. On 8 August, with 53 days to run, 85.5¢ implied a daily hazard of 3.64%. Today, with 32 days to run, 23.5¢ implies 0.84%. The market's own view of how fast this decision arrives has fallen 77% in three weeks.
More telling is what happened to the shape. Compare the hazard implied by the September leg with the hazard implied by the December leg, day by day. On 8 August the ratio was 1.76 — the near leg priced almost twice the urgency of the far leg, which is exactly what a front-loaded, decision-imminent structure looks like. By 18 August the ratio was 1.00. Today it is 0.95. The curve did not choose to be memoryless. It drifted into memorylessness as the front-loaded expectation failed and traders marked the near leg down toward the far leg's rate rather than rebuilding the structure underneath it.
Liquidity says the far leg is the anchor, and the pattern repeats across the complex: the deepest Iran-adjacent book on the Hormuz normalisation contract carries $17.27m against a 0.25¢ price. The December contract holds $177,741 of book against the September leg's $145,452, and the event as a whole carries $22.92m of lifetime volume and $880,357 of liquidity. When a curve is fitted rather than reasoned, the deepest leg sets the level and the rest follow. That is the same failure mode we flagged when Lula's 61.5% looked too high on the Brazil book.
Three contracts that cannot all be right
Polymarket runs four separate Iran-adjacent event books, and reading them against each other is where the September leg gets hard to defend. All prices below were pulled in the same session, 29 August 2026 at 10:39 UTC, direct from gamma-api rather than from any secondary tracker.
| Contract (Polymarket) | By 30 Sep | By 31 Dec | Volume |
|---|---|---|---|
| US announces end of Iranian blockade | 23.5% | 66.5% | $22.92m |
| US-Iran final nuclear deal signed | 1.45% | 10.5% | $16.74m |
| US strikes Iran (ceasefire breaks) | 22.5% | n/a | $4.60m |
| Bab el-Mandeb effectively closed | 5.5% | 17.5% | $11.61m |
| Hormuz traffic returns to normal (by 31 Aug) | 0.25% | $17.27m |
Start with the deal. The nuclear-deal book is the cleanest read on the diplomatic track on the venue, and prices 1.45% by 30 September on $1.32m of leg volume. Strip out the overlap and the blockade contract is implying at least a 22.4% chance the United States lifts its blockade in the next 32 days without any signed instrument to show for it. By 31 December the same arithmetic gives 62.6%. The blockade market is not pricing diplomacy. It is pricing a unilateral climb-down.
Then the ceasefire book. At 77.5¢ for "ceasefire continues through September 30", it assigns a 22.5% probability to a qualifying US air or missile strike on Iran inside the identical 32-day window. So the same venue prices near-identical odds — 23.5% and 22.5% — on the United States standing down completely and on it bombing Iran again, with about 59% left over for the status quo if the two are treated as independent. A decision-maker does not generate that distribution. Two contracts priced independently off the same fear index do.
Finally the physical data, which is the part almost nobody checks. IMF PortWatch publishes daily transit calls for every major chokepoint, and it is the resolution source Polymarket itself uses. Hormuz ran a seven-day average of 92.4 calls a day over 1–23 August 2025. Over the same dates in 2026 it ran 4.9. The last day the seven-day average touched 60 was 2 March 2026, 174 days ago. The Hormuz normalisation contract, at $17.27m the deepest book in the whole complex, trades at 0.25¢ — the market is 99.75% certain nothing has reopened.
The June precedent, and why it is the base rate
There is a directly observable precedent for what a US-Iran de-escalation announcement does, and it happened ten weeks ago. Polymarket's nuclear-deal resolution text records it: "On June 14, 2026, the United States and Iran announced a written diplomatic agreement, including a 60-day extendable period in which both countries committed to negotiate toward a 'final deal'."
The PortWatch series shows what followed. The Hormuz seven-day average was 2.43 on 15 June. It climbed to 11.29 by 20 June, 26.0 by 25 June and peaked at 30.0 on 30 June — half of the 60-call normalisation bar, and the best fortnight since the strait shut in March. Then it decayed: 26.86 on 1 July, 18.14 on 10 July, 7.71 on 15 July, 5.57 on 20 July. The 60-day negotiating window from 14 June lapsed on 13 August with nothing signed. By 23 August the average was back to 5.0.
So the last time this exact process ran, a formal written agreement moved the physical trade to a third of normal and round-tripped inside five weeks — and the blockade was reimposed on 13 July, in the middle of it. That is not an argument that de-escalation is impossible. It is an argument that the odds of a declarative, present-tense, general lift landing inside any given 32-day window are lower than a smooth 6%-a-week curve implies, because the observed path is stop-start rather than Poisson.
Structure, cost and who is actually setting the price
Two structural details shape how long a gap like this persists. First, this is a Geopolitics-tagged market, and Polymarket's published fee schedule sets both the taker and maker rate to zero for that category: "Geopolitical and world events markets are fee-free. Polymarket does not charge fees or profit from trading activity on these markets." Fees elsewhere follow fee = C × feeRate × p × (1 − p), running 0.04 to 0.07 by category. Here the rate is nil.
Second, the tick size is 1¢ and the minimum order is 5 shares. With bid 23 and ask 24, the spread is a single tick — but a single tick on a 23.5¢ contract is 4.3% of notional round-trip. Zero fees plus a 4.3% crossing cost is a market where a 10-point view is tradeable and a 2-point view is not. That asymmetry is why term-structure errors like this one survive: nobody is paid enough to arbitrage 1.1pp of curve-fitting noise, so the fitted curve stands until something forces a re-mark.
The resolution language quoted throughout this piece is drafted to withstand a dispute, which is why its exclusions are so specific. Traders reading these books as sentiment gauges rather than as contracts routinely miss that the wording, not the news, decides the payout. We made the same point about the definitional traps in the September Fed decision market.
The call: 23.5¢ against a 13% fair value
We model fair value for a qualifying announcement by 30 September at 13%, against a traded 23.5¢. The gap is 10.5 percentage points; the market is 81% above where we mark it.
RelatedElon Musk Tweets October Odds: The Book Has No Peak
The number comes from two independent routes that bracket it. The first is a two-block hazard model. For days 1–14 we use a 1.0% weekly hazard, on the grounds that a general lift needs a visible negotiating track and none exists — the market's own 31 August leg at 0.55¢ concedes the point. For days 15–32 we use 4.5% weekly, allowing for a track that opens in early September and concludes around the UN General Assembly high-level week. That gives 12.93%, and 11.9% after the 0.92 wording multiplier. The second route uses the market's own numbers: the 31 August leg trades at 31.5% of its memoryless value, and applying that same lead-time discount across a 21-day diplomatic runway gives 14.4%. Midpoint, 13%.
Scenarios through year-end, on the same model: a base case at 13% for September, in which the blockade holds through the month, Hormuz transit calls stay in the 3–8 range, and the December leg drifts toward the mid-50s as the calendar eats the front. A faster-resolution case at 28% by 31 October, requiring a visible negotiating track to open in the first half of September and a declarative statement from the President, State, Defense or CENTCOM before month-end. A slower case in which the ceasefire contract's 22.5% strike risk materialises, the diplomatic track is void, and the December leg trades below 40%. Our marks across the four legs are 0.5%, 13%, 28% and 56.5% against traded 0.55%, 23.5%, 41.5% and 66.5% — close at the front, close at the back, well below in the middle. That is what a shape disagreement looks like.
What would change our mind. Three things, in order of weight. One: the Hormuz seven-day average breaking above 20 for a sustained week, which would say a de-escalation is under way in the physical data before it reaches a podium. Two: the nuclear-deal contract for 30 September moving above 8%, which would mean the diplomatic track has re-opened and our no-deal-lift objection weakens. Three: the term-structure ratio between the September and December legs moving back above 1.3, which would mean traders have rebuilt a genuine front-loaded view rather than extending a fitted line. Any of those and 23.5¢ stops looking rich. The live board on this market updates continuously, and the September leg is now short enough that one official statement resolves it outright. For the same chokepoint risk read through industrial metals, see our copper outlook at $7.50 and $5.60.
FAQ
What do Polymarket odds actually mean?
A contract price is the market-implied probability of the event, expressed in cents on a $1 payout. The Iran blockade September leg at 23.5¢ means the market prices a 23.5% chance of a qualifying announcement by 30 September. It is not a forecast by Polymarket; it is the last price at which two people disagreed enough to trade. Read it alongside the leg's own volume and book depth, because a thin leg can print a headline number nobody has capital behind.
How does Polymarket work?
Each market is a pair of outcome shares, YES and NO, that always sum to $1. Shares change hands on a central limit order book, at a 1¢ minimum tick and a five-share minimum order on this contract. At expiry the winning side settles at $1 and the losing side at zero, against published criteria rather than editorial judgement. Settlement is in USDC, and positions can be closed at the prevailing price before resolution.
Does Polymarket charge fees?
It depends on the category. Polymarket's published schedule charges takers only, on the formula fee = C × feeRate × p × (1 − p), with rates from 0.04 for Politics and Finance to 0.07 for Crypto; makers are never charged. Geopolitics markets, which is how the Iran blockade contract is tagged, are explicitly fee-free on both sides. There are no Polymarket fees to deposit or withdraw USDC, though a payment intermediary may levy its own.
Kalshi vs Polymarket — which prices geopolitical risk better?
They differ in structure rather than quality. Kalshi settles in dollars from a US bank account; Polymarket settles on-chain in USDC and lists a far wider set of one-off geopolitical questions, which is why the four Iran books cited here have no clean Kalshi equivalent. For a single named contract, depth decides: this event carries $22.92m of lifetime volume and $880,357 of liquidity, enough for its term structure to be worth analysing at all.
Why does the resolution wording matter so much here?
Because it is where most of the disagreement between our 13% and the market's 23.5% sits. The contract needs a present, decided, officially attributed announcement of a general lift. A vessel-by-vessel exemption, a conditional offer, or an anonymous briefing all resolve NO. Since sanctions and interdiction regimes are usually unwound incrementally, a real-world softening can happen without this contract ever paying.
How reliable is the Hormuz transit data?
IMF PortWatch publishes daily arrivals by vessel class from AIS tracking, and it is the named resolution source for the Hormuz and Bab el-Mandeb contracts, so it is the same data the market settles against. It runs a short reporting lag — the latest published figure at the time of writing was 23 August 2026 — and revisions are possible, which is why the contracts specify how they are treated.
Analysis and information only. Nothing here is financial, investment or trading advice, and nothing here is a recommendation to take any side of any contract. Prediction-market contracts can settle at zero. Capital is at risk. All prices were pulled live on 29 August 2026 at 10:39 UTC and move continuously; verify before acting on anything.