

The idea that USD/CAD is a tariff trade does not survive contact with the trade data. Canada's motor vehicle exports rose 2.4% in June 2026, a fifth consecutive monthly increase, with passenger cars and light trucks up 4.5% to their highest level since March 2025. That is Statistics Canada's own reading, published on 4 August 2026, in the middle of the most aggressive US tariff campaign against Canada in living memory. The Bank of Canada put the same point more carefully in its July 2026 Monetary Policy Report: "Trade within North America remains mostly free of tariffs, but some industries have been heavily affected by sector-specific measures." Sector-specific. Not systemic. The Canadian dollar sits at 1.3886 to the US dollar not because Washington is strangling Canadian industry, but because of something duller and far more durable.
Here is the number that should end the tariff conversation. Between the January 2026 monthly average and the May 2026 monthly average, WTI crude went from $60.04 to $102.13 a barrel, a gain of 70%, according to the Government of Alberta's oil price series. Canada is the largest single supplier of crude to the United States. Over that same stretch USD/CAD did not fall — it climbed from a low of 1.3524 on 29 January to a cycle high of 1.4240 on 25 June, a 5.3% move against the loonie. A 70% terms-of-trade windfall bought the Canadian dollar nothing. When an asset ignores the one variable everybody agrees should move it, the variable that is actually moving it lies elsewhere. In this case it is sitting in plain sight, 137.5 basis points wide, and it is why our bull case is 1.4250 and the consensus band is wrong.
Key facts
- USD/CAD spot 1.3886 · European Central Bank daily reference rate, 31 August 2026, via frankfurter.dev.
- Bank of Canada policy rate 2.25%, held on 15 July 2026, with the Bank Rate at 2.5% and the deposit rate at 2.20% · Bank of Canada.
- US federal funds target range 3.50%–3.75%, held on 29 July 2026 by a 9–3 vote, with all three dissenters preferring a 0.25pp increase · Federal Reserve.
- Canadian CPI inflation 3.0% in July 2026; CPI-trim 2.0%, CPI-median 2.7% · Bank of Canada key variables.
- WCS–WTI differential US$13.30/bbl in July 2026, having peaked at US$18.99 in May 2026 · Government of Alberta oil price data.
- Canada's merchandise trade surplus with the United States narrowed to $10.0 billion in June 2026 from $11.1 billion in May · Statistics Canada, 4 August 2026.
- 12-month range 1.3524 to 1.4240; spot sits almost exactly mid-range.
The spread nobody wants to underwrite
Take the two policy rates at their midpoints. The Federal Reserve is at 3.625%. The Bank of Canada is at 2.25%. The gap is 137.5 basis points, and every dollar of carry in that gap runs one way.
What makes this more than an arithmetic curiosity is how each central bank got there and what each has said about leaving. The Bank of Canada held on 15 July after a cutting cycle that took the overnight rate down to 2.25%, and Governor Tiff Macklem was explicit about where that leaves policy. "The current policy rate remains appropriate to sustain the economic recovery and bring inflation back to the 2% target," he said at the press conference that day. A central bank that describes its rate as appropriate is a central bank telling you it intends to do nothing. The Bank's own projection has GDP growth of 0.7% for 2026 rising to 1.8% in 2027 and 2028, and inflation returning to around 2% in early 2027. Nothing in that path argues for hikes.
Now read the Fed. Its 29 July statement says inflation "remains elevated relative to the Committee's 2 percent goal, in part reflecting supply shocks that have driven price increases in certain sectors, including energy," and that economic activity "is expanding at a solid pace." Three members of the Committee voted against holding — not because they wanted a cut, but because they wanted a quarter-point increase.
Then, four days before this was written, the Chair said the quiet part at Jackson Hole. "Inflation is running above our 2 percent target. So the Fed's predominant focus right now should be on prices," Kevin Warsh, Chair of the Board of Governors of the Federal Reserve System, told the Kansas City Fed's symposium on 28 August 2026. He went further: "I would be hard pressed to describe broad financial conditions as restrictive."
Sit with that second sentence. A Fed chair who does not think policy is restrictive has no reason to loosen it. He also told the audience he regards forward guidance as a practice that "has overstayed its welcome," and that he stands "committed to a discipline, not to a decision." Read as a package, this is a central bank that has removed its own obligation to telegraph cuts and simultaneously said it does not see a reason for them.
That is the whole trade. For USD/CAD to reach the consensus 1.33–1.38 band, the 137.5bp gap has to compress, and it can only compress in two ways: the Fed cuts, or the Bank of Canada hikes. A Fed with three voting hawks and an inflation problem it attributes to energy is not a Fed about to cut into a crude market trading near $88. A Bank of Canada projecting 0.7% growth is not a Bank of Canada about to hike. The consensus is asking for a convergence that neither institution has given anyone a reason to expect.
Why the tariff narrative keeps mispricing this pair
None of this means the tariffs are trivial. They are not. Three presidential proclamations dated 20 July 2026 imposed additional duties "not to exceed 50%" on Canadian alcoholic beverages, dairy cheeses, and motor vehicles and parts, framed as an offset to what the administration called Canadian discrimination. A subsequent proclamation of 18 August 2026 pushed implementation from 19 August to 22 August while negotiations continued. Section 232 duties on steel and aluminium have sat at 50% since June 2025. Softwood lumber carries 10%.
The error is not in believing the tariffs exist. The error is in believing the currency has not already absorbed them.
Tariff risk on Canada has been continuously repriced since February 2025. Eighteen months of headlines, proclamations, suspensions and reinstatements have given the market ample opportunity to discount the exposure, and the trade data suggests the discount overshot. Exports to the United States rose 0.3% in June 2026, a fifth consecutive monthly increase. Metal exports rose 16.5%. The one export line that fell hard was crude, down 11.1% month over month, and Statistics Canada attributes that to lower prices rather than to volume or to any tariff.
So the marginal tariff headline now moves USD/CAD less than the market expects, while the marginal rate headline moves it more. That asymmetry is what the 1.33–1.38 consensus is under-weighting. It is forecasting a currency that trades on trade policy. The tape says this one trades on carry.
Oil is helping Canada less than the WTI screen suggests
There is a second thing the consensus glosses over, and it lives in the gap between the barrel Canada sells and the barrel the screen quotes.
Canada does not receive WTI. It receives Western Canadian Select, and the discount is the real terms-of-trade variable. Alberta's own data shows how much of the 2026 crude rally leaked away in that discount.
| Month | WTI (US$/bbl) | WCS (US$/bbl) | Differential |
|---|---|---|---|
| Aug 2025 | 64.86 | 53.70 | 11.16 |
| Dec 2025 | 57.97 | 46.45 | 11.52 |
| Mar 2026 | 91.38 | 75.85 | 15.53 |
| May 2026 | 102.13 | 83.14 | 18.99 |
| Jun 2026 | 84.81 | 65.90 | 18.91 |
| Jul 2026 | 80.46 | 67.16 | 13.30 |
Source: Government of Alberta oil price series, monthly averages.
Read the May and June rows together. WTI averaged above $100 in May, and the differential widened to nearly $19, its widest in the twelve months shown. The mechanism is unglamorous: when the WTI price rips, Canadian heavy barrels compete for finite pipeline and refinery capacity, and the discount widens to clear the market. Canada captures the upside at a haircut, and the haircut grows precisely when the headline looks best.
That is why USD/CAD made its cycle high in June with WTI in the eighties. It is also why the loonie's traditional petro-currency beta has been an unreliable guide all year, and why we treat oil as a modifier of the rate story rather than a driver in its own right. Traders who used the same framework on other commodity currencies this cycle will recognise the pattern from our AUD/USD forecast.
The picture
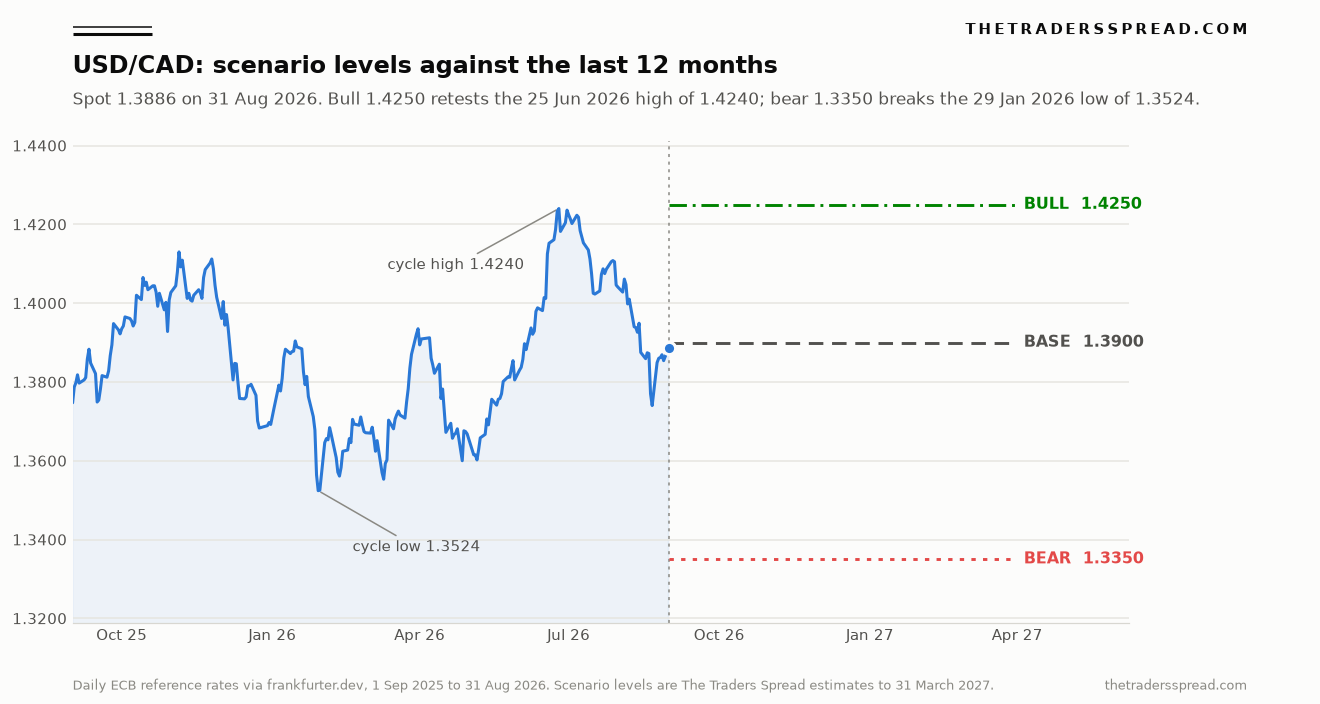
Twelve months of daily ECB reference rates put the structure plainly. The pair has spent the year inside 1.3524 to 1.4240, a 716-pip band, and spot at 1.3886 sits at roughly the midpoint. Our bull case of 1.4250 is not a breakout call in any dramatic sense. It is a retest of a high the pair already printed ten weeks ago, and it clears that high by ten pips.
The bear case asks for considerably more. To reach 1.3350 the pair must break the 29 January low of 1.3524 and then extend 174 pips beyond it, into territory USD/CAD has not visited in this cycle. Both numbers sit on the correct side of live spot: bear 1.3350 is 536 pips below 1.3886, or −3.86%; bull 1.4250 is 364 pips above, or +2.62%. The asymmetry in required effort is the point. One scenario needs a re-run of something that just happened; the other needs a regime change.
| Scenario | Level | Move vs 1.3886 | What it requires |
|---|---|---|---|
| Bull | 1.4250 | +2.62% | Fed holds through December; BoC holds or cuts; carry gap intact |
| Base | 1.3900 | +0.10% | Both banks on hold, range persists, oil stable near $85–90 |
| Bear | 1.3350 | −3.86% | Fed signals cuts at the September SEP; BoC turns hawkish; gap compresses below 100bp |
Three dates that will settle this
The horizon is not abstract. It has a calendar, and the first entry lands the day after this is published.
2 September 2026 — Bank of Canada. The next scheduled interest rate announcement, named as such at the foot of the July release. A hold with unchanged language is the base case and confirms the carry gap. Any hint that the Bank sees inflation at 3.0% as more persistent than transitory would be the first genuine crack in the bull thesis.
3 September 2026 — Statistics Canada. The trade file is the tell. June's surplus with the United States had already narrowed to $10.0 billion from $11.1 billion, and a second consecutive narrowing would be the first hard evidence that tariffs are finally biting the aggregate rather than a handful of sectors.
15–16 September 2026 — FOMC, with a Summary of Economic Projections. This is the one that matters most, and it is the single largest risk to our call. The dot plot will show whether the three July dissenters have company or have been isolated. A median dot showing two cuts by mid-2027 compresses the differential on impact and puts 1.3350 in play far faster than the tape currently implies. The same dot plot drives every G10 carry pair, which is why the mechanism we set out in our USD/JPY forecast applies here with the signs unchanged.
RelatedGBP/AUD Forecast: 1.9600 Bull Case vs 1.8400 Bear Case
The call
Base case 1.3900, roughly where the pair trades, with a 50% weight. The range has held for twelve months, both central banks have told you they intend to sit still, and the path of least resistance for a mid-range pair with a wide, stable carry gap is to keep paying that carry.
Bull case 1.4250, 30%. This is the contrarian leg and it sits above the 1.33–1.38 band the sell side has clustered in. It does not require anything exotic. It requires the Federal Reserve to hold through the October and December meetings while the Bank of Canada does the same, which is what a chair who sees no restrictive financial conditions and a governor who calls his own rate appropriate have both described — the outcome both institutions have described as their intention. Add a September dot plot that keeps the funds rate above 3.50% through 2027, and the pair retests 1.4240 without needing a new story.
Bear case 1.3350, 20%. The Fed pivots at the September projections, the differential compresses toward 100 basis points, and Canadian data firms enough that the 2 September hold reads as the end of the easing cycle rather than a pause within it. In that world 1.3524 gives way and the January low becomes resistance.
What would change our mind. Three things, each falsifiable. A September SEP median showing more than one 2026 cut would break the carry premise outright and we would drop the bull case. A weekly close below 1.3524 would invalidate the range framework we have built the base case on. And a WCS differential sustained above $19 while WTI holds above $85 would tell us Canadian terms of trade are deteriorating faster than the rate story can offset, which would argue for a higher bull target, not a lower one. Track the pair against the rest of our coverage on the USD/CAD market page and the broader markets dashboard.
Frequently asked questions
What is the USD/CAD forecast for the rest of 2026?
Our base case is 1.3900, close to the 1.3886 spot rate of 31 August 2026, with a bull case at 1.4250 and a bear case at 1.3350 out to the end of Q1 2027. The base case assumes both the Federal Reserve and the Bank of Canada hold through their remaining 2026 meetings, keeping the policy differential near 137.5 basis points.
Why is the USD/CAD bull case above the bank consensus?
Most published bank forecasts sit in a 1.33–1.38 band, which requires the Fed–Bank of Canada rate gap to compress. Neither central bank has signalled the move that would cause that. The Fed held in July with three members voting for a hike; the Bank of Canada called its 2.25% rate appropriate. A gap that neither side intends to close is a gap that keeps paying.
Do US tariffs on Canada weaken the Canadian dollar?
Less than most people assume at this stage. Tariff risk has been repriced continuously since February 2025, and the June 2026 trade data showed Canadian exports to the United States rising for a fifth consecutive month, with motor vehicle exports up 2.4%. The Bank of Canada describes the impact as concentrated in specific industries rather than economy-wide.
How much does the oil price move USD/CAD?
Less reliably than the correlation textbooks suggest. WTI monthly averages rose roughly 70% between January and May 2026 while USD/CAD rose 5.3% from its January low to its June high. Part of the explanation is the WCS discount, which widened to nearly $19 a barrel in May and June, so Canada captured the crude rally at a meaningful haircut.
What is the WCS–WTI differential and why does it matter for the loonie?
It is the discount at which Western Canadian Select trades to the WTI benchmark, driven by quality and by pipeline capacity. It stood at US$13.30 a barrel in July 2026 against a twelve-month range of roughly $11 to $19. It matters because it determines how much of any crude rally actually reaches Canadian terms of trade, and it tends to widen when WTI is strongest.
What would invalidate this USD/CAD view?
A weekly close below 1.3524, the 29 January 2026 low, would break the range structure underpinning the base case. A September FOMC projection showing more than one 2026 cut would remove the carry argument behind the bull case. Either would move us toward the bear scenario.
This article is analysis and information only. It is not investment advice, a recommendation, or an offer to transact in any instrument. Foreign exchange and CFD trading carries a high risk of loss and capital is at risk. Prices and levels cited were accurate at the time of writing and may since have changed.