

In Cameron Parish, Louisiana, the Cheniere Sabine Pass liquefaction trains sit across a channel of brown water, flaring, and every molecule they load comes out of the same Gulf Coast plumbing that stores Natural Gas in hollowed-out salt caverns a few counties away. Those caverns are the fastest-cycling storage in the American system. They fill in days and empty in days, which is why traders read them first. At 10:30 a.m. on 27 August the US Energy Information Administration published its weekly count for the week ending 21 August, and the salt line read 248 billion cubic feet, down 20 Bcf on the week. Salt caverns always hand some gas back in late summer. They have never handed back this much: the 69 Bcf drained since 17 July is the deepest five-week drawdown for that window in the entire EIA salt series back to 2010, against an average of 32.
The headline number in the same report looked comfortable: 3,184 Bcf in the ground across the Lower 48, a full 167 Bcf above the five-year average of 3,017. Comfort and the salt line disagree, and the gap between them is the whole trade.
Here is what nobody has put side by side. EIA's own August Short-Term Energy Outlook forecasts a record 3,985 Bcf in storage at the end of October 2026. Getting from 3,184 to 3,985 in the ten reporting weeks that remain requires an average injection of 80.1 Bcf every single week. The last two weeks delivered 16 and 15. The five-year average for that same stretch of calendar is 71.9 Bcf a week, so even a perfectly normal autumn lands at roughly 3,915, below the agency's own number. Run the last four weeks forward instead and the season peaks near 3,434. That 550 Bcf spread is not a rounding error. It is the difference between a glut and a scramble, and the market is currently priced for the glut.
Key facts
- Front-month NYMEX Henry Hub (October 2026) traded $2.938/MMBtu on 1 September 2026 — NYMEX NG1! delayed quote, corroborated at $2.94 on Rigzone's price board the same morning.
- Working gas in storage was 3,184 Bcf on 21 August 2026: 167 Bcf above the five-year average, but 30 Bcf below the same week last year — EIA Weekly Natural Gas Storage Report, released 27 August 2026.
- South Central salt-cavern stocks fell to 248 Bcf, down 20 Bcf on the week and 9.2% below a year ago. The 69 Bcf drained since 17 July is the deepest such stretch since the salt series began in 2010 — EIA weekly regional series.
- The last three weekly injections ran +36, +16, +15 Bcf against five-year averages near +30 for the comparable weeks — EIA weekly series, 7 to 21 August 2026.
- EIA cut its 3Q26 Henry Hub forecast by 50 cents to $2.87/MMBtu and expects prices below $3.00 until November — August 2026 STEO.
- The January 2027 contract already settles at $3.948, and February at $3.601 — NYMEX, 1 September 2026.
- Henry Hub cash printed $30.72 on 23 January 2026 and $2.54 on 24 April 2026. Both are this calendar year — EIA daily spot series.
The salt caverns are telling a different story from the headline
EIA splits the South Central region into salt and non-salt. Non-salt is depleted reservoir storage, slow to fill and slow to draw. Salt is the opposite: engineered caverns leached out of underground domes, cycling multiple times a season, sitting physically next to the Gulf Coast's power plants and its LNG export docks. When the Gulf Coast needs gas quickly, salt is where it comes from.
Salt stocks have fallen every week since mid-July. On 17 July they stood at 317 Bcf. Five weeks later, 248.
The seasonal draw itself is unremarkable. The size is not. Across the sixteen years EIA has broken salt out separately, the average change over that stretch of calendar is minus 32 Bcf, and the deepest previous reading was minus 61 in 2023. The 14 and 21 August prints of minus 18 and minus 20 are, together with a single week in August 2025, the three largest weekly salt draws the series has ever recorded in that month. Salt now sits only 2.1% above its five-year average while the national number sits 5.5% above, and South Central working gas of 1,061 Bcf is 5.9% below where it stood a year ago.
Three things can pull gas out of Gulf Coast salt in August. Power burn during a hot month. Feedgas nominations from the liquefaction plants. And basis traders monetising a cavern when the prompt month is worth more than the carry. EIA does not disaggregate the cause in the weekly report, so anyone claiming to know which one dominated is guessing. What is not a guess is the direction, the persistence, and the fact that the injection season has roughly ten weeks left to run.
What the forward curve has already priced, and what it has not
The NYMEX strip does the seasonal arithmetic honestly. October at $2.938, November at $3.066, December at $3.524, January 2027 at $3.948, February at $3.601. That shape is a textbook winter premium: a dollar and a cent from the front month to the January peak, then backwardation into February as the market assumes the cold passes.
| Contract | Price ($/MMBtu) | vs October front month |
|---|---|---|
| October 2026 (front) | 2.938 | — |
| November 2026 | 3.066 | +4.4% |
| December 2026 | 3.524 | +19.9% |
| January 2027 | 3.948 | +34.4% |
| February 2027 | 3.601 | +22.6% |
Source: NYMEX Henry Hub futures, 1 September 2026.
Read that table again with the storage arithmetic in mind and the mispricing becomes specific rather than vague. The curve prices a normal winter drawn from a comfortable inventory. It does not price a season that peaks at 3,400 Bcf instead of 3,985. Nor does it price the possibility that the peak arrives early, in the first week of November rather than the fourth.
The January contract at $3.948 matters for a second reason: it means our $4.20 bull case is not a 43% leap of faith. Measured against the January contract, $4.20 is 6.4% higher. Most of the distance from the front month to the bull case is calendar, not conviction, and the market has already walked it.
The arithmetic that decides this winter
Storage forecasting reduces to two numbers: where the season peaks, and how much the winter takes out. Both are measurable.
Since 2021, the average build from the 21 August print to the seasonal peak has been 796 Bcf, arriving somewhere between 7 November and 24 November. The average draw from that peak to the end-of-March trough has been 2,012 Bcf, with a range from 1,577 in the mild 2023/24 winter to 2,274 in the cold 2024/25 one. Combine those and the four scenarios line up cleanly.
| End-October peak scenario | Implied peak (Bcf) | End-March 2027, average draw | End-March 2027, cold draw |
|---|---|---|---|
| EIA August STEO | 3,985 | 1,973 | 1,711 |
| Five-year injection pace | 3,915 | 1,903 | 1,641 |
| Last four weeks' pace | 3,434 | 1,422 | 1,160 |
| Last two weeks' pace | 3,339 | 1,327 | 1,065 |
Sources: EIA weekly working gas series 2010–2026 and August 2026 STEO; five-year draw average 2021/22 to 2025/26, calculated by The Traders Spread.
The bottom two rows are the reason this article exists. An end-March carryout of 1,160 Bcf would be the lowest since 2019, when the trough was 1,107. A carryout of 1,422 would undercut 2022's 1,382 only narrowly and would still be the second-tightest reading in eight years. Prices do not stay at $2.90 while that is happening. They did not in January 2026, when Henry Hub cash printed $30.72 on the 23rd and the February contract traded at $4.875 on the 21st, up $1.76 in a week.
None of this requires an exotic weather assumption. It requires the injection deficit of the last month to persist for half of the remaining season.
Who is on the other side of the trade
The bear case is not stupid, and it starts with production. EIA's August STEO puts 2026 US dry gas output at a record 111.19 Bcf/d, rising to 116.04 Bcf/d in 2027, against domestic consumption of 92.03 Bcf/d. New Permian takeaway is arriving. Producers who were flaring or shutting in volumes at Waha have started bringing them back as pipeline capacity comes online, according to Aegis Hedging. Supply, in short, is not the constraint the bulls sometimes pretend.
The counterargument is that the marginal barrel of American gas is getting harder to reach even as demand compounds. Kristy Kramer, Head of LNG Strategy and Market Development at Wood Mackenzie, framed the supply side plainly in July: "Power sector demand alone is calling for an additional 17 bcfd by the mid-2030s, and the highest-quality acreage is already in production." That is a structural claim, not a winter one, but it changes how much slack a trader should assume the system carries when something goes wrong.
Something is already going wrong in Europe. EU inventories are running at their weakest into a heating season in two decades, and the shortfall gets solved by bidding for the same US cargoes that load at Sabine Pass and Cameron. Warren Patterson, commodities strategist at ING, put a number on the risk in a note on 27 August: "At the current rate, it will be difficult for the EU to hit even the lower storage target of 75% ahead of the heating season. This raises the prospects of forced buying, increasing upside risk for gas prices."
Forced buying in Europe is feedgas demand in Louisiana. That is the transmission channel, and it is the one EIA implicitly assumed away when it cut its price forecast partly on the basis of reduced LNG feedgas demand. The agency's own export numbers pull the other way: 17.4 Bcf/d of LNG exports in 2026, rising to 18.6 Bcf/d in 2027, with Mexico's Energia Costa Azul adding 0.4 Bcf/d of nominal capacity after its first cargo on 8 July.
The energy complex is not pricing any of this in isolation. Our read on the Strait of Hormuz blockade odds covers the geopolitical leg, and the same risk premium that had Brent at $92.31 on Rigzone's board on 1 September has a gas expression that is far less well covered.
The disconfirmation case
Take the other side seriously for a paragraph.
Injections collapse for boring reasons all the time. A hot August raises power burn, then September cools and the caverns refill at 90 Bcf a week, which is exactly what happened in 2022, when the comparable stretch delivered 922 Bcf between 19 August and 28 October. If that repeats, storage tops 3,900, EIA's record forecast is roughly right, and the front month spends October and November grinding between $2.50 and $2.90. A mild winter on top of that takes the March carryout above 2,200 Bcf, and by February the 2027 strip is trading with a two in front of it. Henry Hub cash has been at or below $2.10 on 155 separate days since the start of 2023, most recently on 19 November 2024. The bear level is not a fantasy price; it is a price this market printed within the last two years.
The second disconfirmation is simpler. Weather is genuinely unforecastable at a four-month horizon, and the storage arithmetic above cannot tell you which of the two draw columns applies. It tells you the range of outcomes has widened, which is a different and more useful claim.
The call
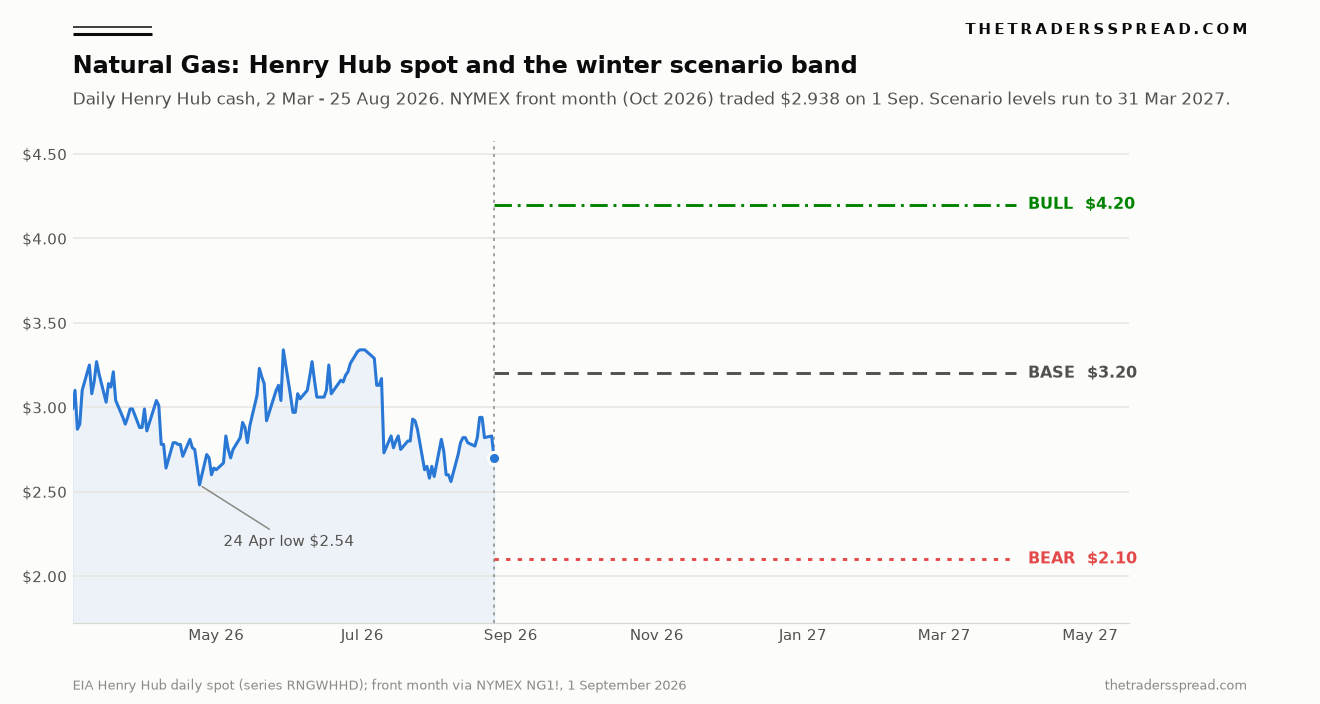
Live spot on the NYMEX front month was $2.938/MMBtu when this article was priced at 08:38 UTC on 1 September 2026, and $2.923 on a re-pull thirteen minutes later. Both scenario levels sit on the correct side of it, and the arithmetic is explicit:
RelatedAntimony Price Prediction: 112,000 Yuan Bull vs 94,000 Bear
- Bear $2.10 < spot $2.938 < bull $4.20
- Bull: 4.20 ÷ 2.938 − 1 = +43.0%, and only +6.4% against the January 2027 contract at $3.948
- Bear: 2.10 ÷ 2.938 − 1 = −28.5%
Base case, $3.20, roughly 50% likely. Injections partially normalise, the season peaks near 3,750 to 3,900 Bcf, and an average winter draws the carryout to somewhere near 1,800. That is a market clearing between the November and December contracts, close to EIA's 2027 annual forecast of $3.31 and its 2026 figure of $3.44.
Bull case, $4.20, roughly 30% likely. The injection deficit persists into October, the peak lands under 3,600, and either a cold December or European forced buying arrives on top of it. The prompt contract does not need to reach $4.20 in October; the level is a winter print, and the January contract is already at $3.948 without any of this being true yet.
Bear case, $2.10, roughly 20% likely. Injections snap back toward the 2022 pace, storage sets the record EIA is forecasting, and the winter is mild. Shoulder season does the rest.
What would change my mind, in order of how quickly it would do it. Two consecutive injections above 60 Bcf would kill the bull case outright, because the required run-rate for a tight peak no longer works after that. Salt stocks turning higher for three straight weeks would remove the mechanism entirely. And the 9 September STEO is the single cleanest test available: if EIA holds its 3,985 Bcf end-October forecast after seeing the 15 Bcf print, the disagreement is real and datable, and the next four storage reports settle it. Watch the weekly regional series rather than the headline, because the salt line moves first.
FAQ
What is the current Natural Gas price?
The NYMEX Henry Hub front-month contract for October 2026 traded at $2.938/MMBtu on 1 September 2026. EIA's daily cash series last printed $2.70 on 25 August, and the cash quote has averaged $2.944 since 1 June. Cash and futures diverge by a few cents most days; the futures price is the one the scenarios in this article are measured against.
Why does the salt-cavern number matter more than total storage?
Salt-dome caverns in the South Central region cycle far faster than depleted-reservoir storage and sit next to Gulf Coast power plants and LNG export terminals. They respond to demand within days, so they register a change in the physical balance weeks before the national aggregate does. Salt fell 20 Bcf in the week to 21 August while the national total still rose 15 Bcf.
How does European storage affect US Natural Gas prices?
Europe covers a storage shortfall by bidding for spot LNG cargoes, and a large share of the available cargoes load on the US Gulf Coast. Higher European prices raise the netback on American exports, which raises feedgas nominations at the liquefaction plants, which pulls gas out of the same South Central storage the domestic market relies on.
What would make the $4.20 bull case fail?
Two consecutive weekly injections above 60 Bcf, a seasonal peak above 3,850 Bcf, or a December that runs warmer than normal across the Midwest and Northeast. Any one of those puts enough gas in the ground that a $4.20 winter print stops being a reasonable expectation.
Is EIA's record 3,985 Bcf forecast likely to be revised?
The August STEO was published before the 16 and 15 Bcf injections were reported. The next edition lands on 9 September 2026 and is the first opportunity to revise. A cut in that figure would confirm the gap between the forecast and the run-rate; holding it unchanged would mean EIA expects a sharp reacceleration in September.
How does this compare with the rest of the commodities desk?
Gas is the only major commodity where the physical balance is measured and published every Thursday, which makes it unusually falsifiable. Our copper scenarios, uranium scenarios and gold scenarios rest on inventories, contracting cycles and flows that report monthly at best. Live prices for all of them sit on the markets page.
Analysis and information only. This article is not investment advice, and nothing in it is a recommendation to transact in Natural Gas, futures, ETFs or any related instrument. Commodity markets carry substantial risk and capital is at risk. Prices, storage figures and forecasts are accurate as at the dates cited and will change.