

NY Harbor ultra-low sulfur diesel, the futures contract the screen still labels heating oil, last traded at $4.4608 a gallon at 07:00 UTC on 6 October 2026. Having tracked the Harbor contract through the autumn stock build, I am using a week that did not refill the system: US distillate stocks finished 25 September at 105.180 million barrels, only 4.381 million above the 22 May low of 100.799 million, against a 21.276 million barrel rebuild between 23 May and 12 September 2025. November is not the winter. At the same hour January 2027 last traded at $4.233 and March 2027 at $4.0301, a 43.1 cent backwardation from the front month into the end of heating season. The scenarios below are for the front-month continuation on 29 January 2027. They are not a hold-to-expiry call on November, and they are not a crude forecast.
The weekly tables do not read like a footnote to crude. Central Atlantic distillate, PADD 1B, the region that takes New York Harbor barrels, was 9.302 million barrels in the week ending 25 September, 36.1% below a year earlier and 49.3% below the week ending 27 September 2024. Gulf Coast distillate was 43.897 million barrels, only 2.3% under last year. In that same week commercial crude stocks rose 0.9 million barrels, to 427.3 million, which the EIA summary put 2% above the five-year average. Distillate fell. The curve splits the same way. November heating oil over January is a $9.57 a barrel backwardation. November WTI over January WTI is $2.18. About $7.39 of that slope sits in the distillate contract, not in crude.
- November 2026 NYMEX heating oil last traded at $4.4608 a gallon at 07:00 UTC on 6 October 2026, 1.9% under the 5 October close of $4.5452. The bar showed 1,344 contracts, against full sessions of 52,505 to 61,416 on 30 September, 2 October and 5 October. Source: Yahoo Finance HO=F, 6 October 2026.
- January 2027 last traded at $4.233 at 06:58 UTC and March 2027 at $4.0301 at 06:55 UTC. Backwardation is 22.8 cents to January and 43.1 cents to March. Source: Yahoo Finance, 6 October 2026.
- US distillate stocks were 105.180 million barrels in the week ending 25 September, down 2.251 million on the week and 14.9% below 123.577 million a year earlier. The summary rounds the draw to 2.3 million barrels and puts stocks 14% below the five-year average. Source: EIA Weekly Petroleum Status Report, 30 September 2026.
- Central Atlantic distillate was 9.302 million barrels, down 0.696 million on the week and 36.1% on the year. New England was 2.547 million, down 36.8%. Gulf Coast was 43.897 million, down 2.3%. Source: EIA WPSR table 6, 30 September 2026.
- The November ULSD crack against November WTI was $2.35 a gallon, or $98.76 a barrel, at 07:00 UTC. EIA's corrected September STEO puts the 2026 distillate crack at $1.57 a gallon and 2027 at $1.25. Source: Yahoo Finance, 6 October 2026, and EIA STEO, 9 September 2026.
- Four-week distillate product supplied averaged 3.8 million barrels a day, up 5.2% on the year. Distillate production that week was 5.0 million barrels a day. Imports averaged 153,000 barrels a day. Source: EIA WPSR summary, 30 September 2026.
Where the barrels are, and where they are not
The national total is tight. It is not the number that explains the Harbor contract.
Jimmy Troderman, principal contributor to EIA's 5 October note, put that week 13% below the five-year average. The summary says 14%. The level is on table 6. The history of WDISTUS1, next release 7 October, shows the rebuild that did not happen. From the 22 May low of 100.799 million barrels, stocks rose 4.381 million by 25 September. The best September week was 11 September, at 107.859 million. In 2025 the rebuild from 23 May (103.408 million) to 12 September (124.684 million) was 21.276 million barrels.
New England is down 48.8% from late September 2024 as well. East Coast barrels are scarce. Gulf Coast barrels are not.
The contract is the ultra-low sulfur barrel. US stocks at 15 ppm and under were 94.389 million barrels, down 1.974 million on the week and 16.2% on the year. Central Atlantic 15 ppm stocks were 8.874 million, down 37.3% on the year and 49.9% versus late September 2024.
Refineries ran 16.3 million barrels a day of crude that week, down 554,000, at 92.5% of capacity, after a third quarter Troderman put at 95%, the heaviest since 2019. Imports of 153,000 barrels a day were about 4% of product supplied.
Propane went the other way in the same release. Propane and propylene inventories rose 1.8 million barrels and stood 20% above the five-year average, a reversal of the draw covered here on 27 September. Heating fuel is not one inventory.
The Gulf Coast is not tight. The Harbor region is. A forecast that starts from the crude stock build skips the geography this contract delivers into.
What the board already charges
The $4.4608 figure is a live last at 07:00:03 UTC, not a settlement. The bar ran from $4.4432 to $4.5429 on 1,344 contracts. The 5 October close was $4.5452. The continuous ticker and the November code printed the same last. No second vendor returned a quote, so the anchor is Yahoo.
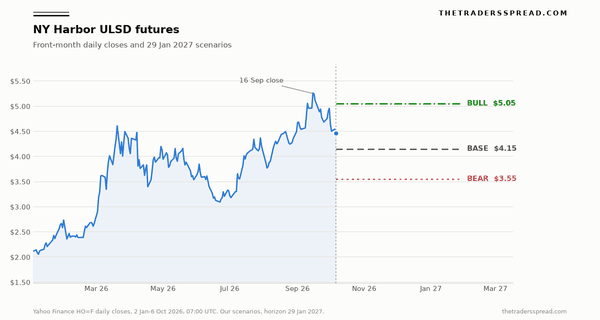
From the 2 January close of $2.1151 the last trade is up 110.9%, and from the 6 October 2025 close of $2.2443 it is up 98.8%. The highest close was 16 September at $5.2465. On 30 September the high was $5.4275 and the close was $4.9569. The contract is down 10.0% from that close and 17.8% from that high.
| Contract | Last | UTC | $ per barrel | Same-month WTI | Crack, $ per barrel |
|---|---|---|---|---|---|
| Nov 2026 | $4.4608 | 07:00 | 187.35 | $88.59 | 98.76 |
| Dec 2026 | $4.3178 | 06:59 | 181.35 | $87.42 | 93.93 |
| Jan 2027 | $4.233 | 06:58 | 177.79 | $86.41 | 91.38 |
| Feb 2027 | $4.135 | 06:55 | 173.67 | not pulled | not pulled |
| Mar 2027 | $4.0301 | 06:55 | 169.26 | not pulled | not pulled |
| Apr 2027 | $3.9127 | 06:46 | 164.33 | not pulled | not pulled |
March is already the skeptic. At $4.0301 it sits $18.09 a barrel under November, and the January crack is still $2.18 a gallon. That is a premium for prompt barrels. A cold-winter rerating would lift the back. It has not.
EIA cash prices stop at 25 September. Harbor ultra-low sulfur diesel spot was $4.949 that Friday, and the separate No. 2 heating oil spot was $4.739. The future closed at $4.6847, under both. The ULSD spot peaked at $5.365 on 16 September. Yahoo still prints the name "Heating Oil." No Harbor spot has been published since that Friday, so today's basis is unknown.
The crack has already compressed. On 30 September, ULSD at $4.9569 against WTI at $90.42 was a $117.77 a barrel crack. This morning's $98.76 is about $19 narrower. The older comparison that holds crude roughly still is 29 May: the future at $3.5373, WTI at $87.36, crack near $1.46 a gallon. On 30 June WTI was $69.50, so that lower close was a crude move.
Dutch TTF, marked here on 30 September, clears a different set of tanks. It is not a stand-in for the Harbor strip above.
A warm East, and a maintenance calendar
Anthony Artusa, forecaster on the National Weather Service Climate Prediction Center discussion issued at 8:30 a.m. EDT on 17 September 2026, wrote: "El Niño is strengthening, with a greater than 90 percent chance of a very strong event this fall and winter." The same note said: "The October-November-December (OND) 2026 Temperature Outlook favors above normal temperatures for much of Alaska as well as most areas west of the Rockies, nearly all areas east of the Mississippi River, and the northcentral states in-between."
New England and the Central Atlantic sit east of the Mississippi. Above-normal temperatures for October through December are a lighter heating-demand call at the start of the season, not a statement about January. CPC said this outlook is superseded on 15 October. Until then, the official guidance leans against a cold open in the region whose tanks are the empty ones.
The September Short-Term Energy Outlook, forecast completed 3 September and published 9 September, describes the other half of the calendar. Distillate output typically falls in autumn maintenance while harvest demand rises. "Low inventories may also contribute to higher prices for residential heating oil in the Northeastern United States," EIA wrote. The retail series is not back. The Heating Oil and Propane Update still carried an off-season note on 6 October. There is no current residential heating-oil price to set beside $4.4608.
The two lines argue. Artusa's map, if it verifies, caps early-season burn. EIA's maintenance line says output usually dips while tanks should be filling, and this year they barely filled. March at $4.03 against November at $4.46 looks more like the weather outlook than like a market bracing for a worse January.
September's script versus the print
EIA's September outlook said US distillate inventories would drop below 100 million barrels in September and stay under the five-year low through much of 2027. The same day's press release moved the breach to October and called it the first such print since 2003. No September week in the file is under 100 million. The four were 106.274, 107.859, 107.431 and 105.180. The September sentence missed. The October sentence is still open. The next weekly report, for the week ending 2 October, is dated 7 October.
The crack path is more careful than the inventory sentence. After correcting a table that had briefly labeled gasoline cracks as distillate, EIA put the distillate crack at $1.57 a gallon for 2026 and $1.25 for 2027. It also said average diesel cracks would exceed $2 a gallon from August through November, then ease into mid-2027. Our $2.35 future-minus-WTI crack sits in that window and is not Troderman's measure. His chart is Harbor spots minus Dated Brent. He wrote that spreads "were highest for distillate fuel oil and second highest for jet fuel because the disrupted refining activities in Russia, China, and the Middle East supplied large shares of these fuels to global markets."
He also wrote: "U.S. distillate fuel supplies have become tight because of high exports to markets in short supply, as well as higher costs for importing regions, such as the U.S. East Coast." The IEA Oil Market Report of 11 September put US diesel and gasoil above $200 a barrel in early September, 94% above pre-war levels, and Gulf net exports of those fuels at 390,000 barrels a day in August, just over a quarter of the pre-war pace. Combined Gulf and Russia net exports were 1.6 million barrels a day lower than in February. It also forecast world oil demand down 2.5 million barrels a day in 2026, with the losses in middle distillates.
Natural gas, in that same STEO, is the mirror image: 3,969 billion cubic feet on 31 October, 5% above the five-year average. Natural gas enters winter with a surplus. Harbor ULSD enters it with a regional deficit. When this was filed, the STEO page still showed the 9 September edition, with the next release listed as 6 October. A later edition can move the crack path. It cannot rewrite the 25 September stock table.
RelatedNovember Rough Rice Fell 0.9% to $16.36 Last Friday
Base, bull, and bear into 29 January
Base case, $4.15, for the front-month continuation on 29 January 2027. That is about 8 cents under January at $4.233 and about 1.5 cents over February at $4.135. The path is November's premium fading. On this morning's WTI of $88.59, $4.15 is a $2.04 a gallon crack, about $85.71 a barrel, still above EIA's $1.57 full-year figure. Bias is neutral. It is not a collapse, and it is not a return to the September highs.
Bull case, $5.05, above the $4.4608 spot. A late-January front month near the 18 September close of $5.0578 means the winter contracts have to be marked up by about 80 cents. On flat WTI that is a $2.94 crack, wider than this morning and back toward the roughly $2.80 cracks of 16 and 30 September. It needs another Central Atlantic draw, and a CPC update that drops the warm-East call. The $5.4275 wick on 30 September is not the target. The close that day was $4.9569.
Bear case, $3.55, below the $4.4608 spot and just above the 29 May close of $3.5373, when WTI was $87.36 and the crack was near $1.46 a gallon. Our level is about $1.44 a gallon, or $60.51 a barrel, if crude stays put. June's lower close was a crude move, with WTI at $69.50, so it is the wrong analogue. $3.55 also sits about 36 cents under April 2027 at $3.9127. EIA's 2027 crack of $1.25 a gallon on today's WTI is $3.36, which we are not assuming by late January.
What changes it is dated. On 7 October, another Central Atlantic draw on the scale of the 0.696 million barrels already lost, or larger, makes $4.15 look low. A build that lifts PADD 1B toward 12 million barrels does the opposite. On 15 October, if CPC drops the warm-East call, the demand headwind in the base case weakens. A trade back through the 30 September close of $4.9569 means the fade failed. That invalidation, rounded to $4.96, sits against an entry reference of $4.46 and a base target of $4.15. Conviction is 3 out of 5.
Questions the tape raises
Is this a WTI forecast with a different label?
No. November heating oil is quoted in dollars per gallon. At 42 gallons per barrel, $4.4608 is $187.35. November WTI at $88.59 is used only for the crack, $98.76 a barrel. Central Atlantic distillate is down 36.1% on the year and the Gulf Coast only 2.3%. The scenarios are for the Harbor continuation on 29 January 2027.
Why is the future near $4.46 when it was $2.24 a year ago?
The 6 October 2025 close was $2.2443, so the move to $4.4608 is 98.8%. From the 2 January close of $2.1151 it is 110.9%. Behind that sits a failed summer rebuild and Central Atlantic stocks about half of late September 2024. The IEA had US diesel and gasoil above $200 a barrel, $4.76 a gallon, in early September. The future is now $187.35 a barrel, back under that line, and still about double last October.
Why doesn't your crack match EIA's $1.57?
Ours is November ULSD times 42, minus November WTI: $2.35 a gallon at 07:00 UTC on 6 October. EIA's $1.57 is the 2026 annual average distillate crack, and $1.25 is 2027, from a table corrected after a gasoline figure was mislabeled. The same outlook said average diesel cracks would exceed $2 a gallon from August through November. Today's prompt number is inside that window. Troderman's spreads use Harbor spots minus Dated Brent. Three definitions, not one statistic.
Does backwardation mean a cold winter is priced?
No. November at $4.4608 against March at $4.0301 is a premium for prompt barrels, not a bid for late winter. A cold-winter rerating would lift January and March. They have not. Artusa's 17 September outlook, a greater than 90 percent chance of a very strong El Niño and above-normal temperatures favored east of the Mississippi for October through December, leans against a cold start. CPC updates that map on 15 October.
What would knock out the $4.15 base case?
The 7 October stock report and the 15 October CPC update. Another large Central Atlantic draw makes $4.15 look low. A build that closes part of PADD 1B's 36% year-on-year gap makes November's premium the soft part of the board. If CPC drops the warm-East call, that demand headwind fades. A trade through the 30 September close of $4.9569 means the fade failed.
Why is the bull case $5.05 and not the $5.43 spike?
The $5.4275 print on 30 September was an intraday high. The close was $4.9569, and the future has since traded to $4.4608. The bull case is a late-January front month near the 18 September close of $5.0578. That requires the winter contracts, now $4.233 and $4.135, to be repriced. On flat WTI it is also a $2.94 crack, wider than this morning's $2.35. It is the stock deficit getting worse, not a one-day wick coming back.
This is analysis, not a recommendation. NY Harbor ultra-low sulfur distillate futures move several percent in a session, the 6 October figure is a live electronic last trade rather than a settlement, and the next inventory report is dated 7 October. Capital is at risk. Nothing here is an instruction to take a position.