

Gold did not have a bad week. That is the first thing to unlearn about a metal that just gave back 3.4% in five sessions and still closed August with its largest monthly gain since January. Spot XAU/USD changed hands at $4,456.40 an ounce on 29 August 2026 at 10:40 UTC, up roughly 10% on the month and 29.8% on the year, and yet the tape reads as a failure because of where that number sits: 1.4% below its own 200-day moving average, having closed 3.4% above it three sessions earlier. One Friday erased a month of technical repair without erasing a month of price.
Here is the part almost nobody is pricing. Through the same August in which bullion added about 10%, the equities that dig it out of the ground added roughly three and a half times as much. The VanEck Gold Miners ETF (GDX) closed 28 August at $99.65, up 34.5% since 31 July; the junior miners fund GDXJ closed at $128.80, up 35.0%, against GLD's +10.1% over the identical window, on our own calculation from stockanalysis.com daily closes. Single names went further still — Eldorado Gold up 51%, Hecla Mining up 44% — while, as mining.com reported on 28 August, "gold enters September up about 4% in 2026, still the laggard next to its own miners." A 24-point performance gap between a metal and the companies whose only product is that metal is not sentiment. It is operating leverage repricing, and it is the single most useful input into a gold price prediction for the remainder of 2026, because equity holders are underwriting a higher long-run gold price than the futures curve is.
Key facts
- Spot gold $4,456.40/oz, pulled live 29 August 2026 at 10:40 UTC — api.gold-api.com.
- Gold's August gain was about 11%, its best month since January; the metal still trades roughly 16% below the record set in late January — mining.com, 28 August 2026.
- Comex December gold fell as much as 3.2% to $4,515.30 on Friday, a swing of $173 from the overnight high of $4,688 — mining.com, 28 August 2026.
- Spot sits 1.4% below the 200-day moving average (~$4,521) and 5.9% above the 50-day (~$4,208), our calculation from GLD closes scaled to spot, 28 August 2026.
- August performance: GLD +10.1%, GDX +34.5%, GDXJ +35.0%; trailing twelve months GLD +29.8%, GDX +62.5%, GDXJ +67.0% — our calculation, stockanalysis.com data to 28 August 2026.
- "Bullion-backed ETFs last week added the most gold since January" — mining.com, 28 August 2026.
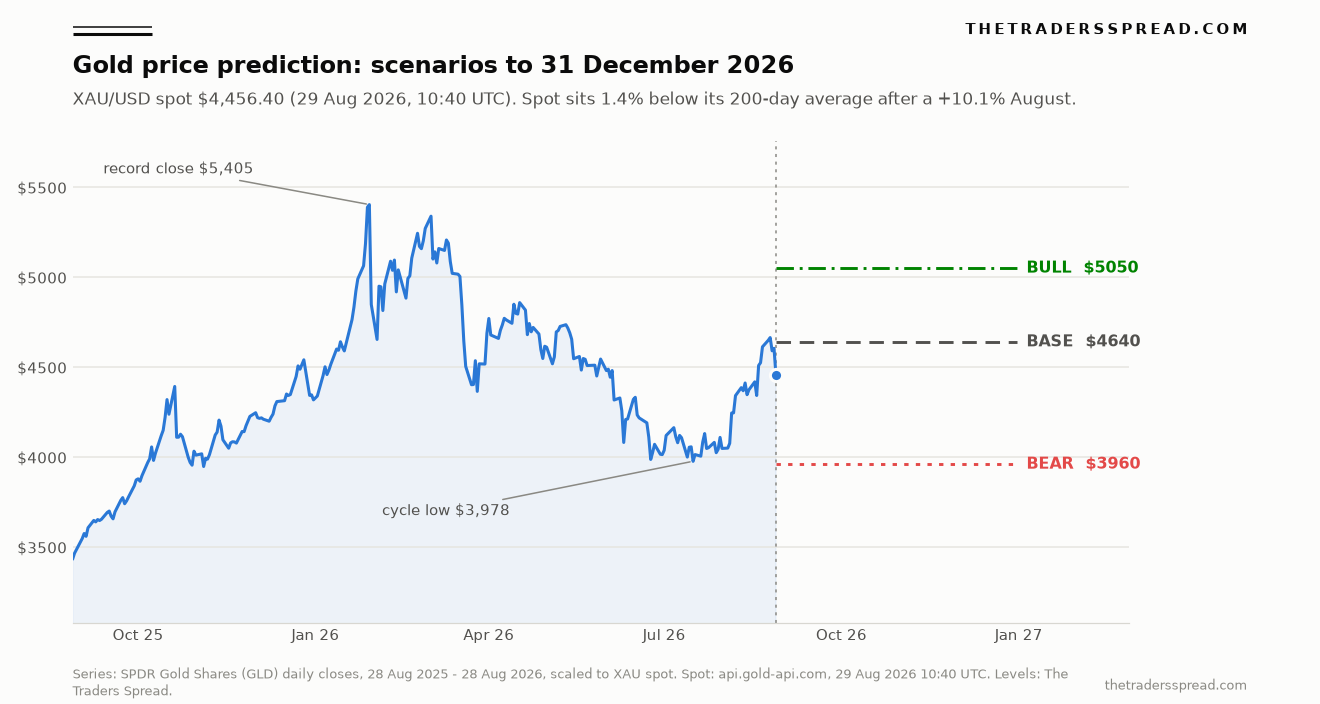
- Scenario levels to 31 December 2026: bull $5,050 (+13.3% above spot), base $4,640 (+4.1% above spot), bear $3,960 (−11.1% below spot).
Why this gold price prediction starts with the miners, not the metal
A gold miner is a leveraged claim on the gold price minus a largely fixed cost base. When bullion rises 10%, an operator holding all-in sustaining costs flat earns 10% of revenue against an unchanged cost line, which lands in the margin as a far larger percentage. That is why mining equities habitually amplify metal moves in both directions. What makes August 2026 unusual is the size of the amplification, and that it happened while the metal was still repairing damage from a brutal first half.
Run the arithmetic on the two ETFs. GDX rose 34.5% in August against GLD's 10.1% — a beta of roughly 3.4 to the metal over the month. Over the trailing twelve months the same pair reads +62.5% against +29.8%, a beta closer to 2.1. Miners have not simply tracked gold with more volatility; they have re-rated relative to it, and the re-rating happened in a single month.
Three things drove it, and each is verifiable. First, the operational news flow turned. Eldorado Gold, up 51% in August, began crushing first ore at its Skouries project in Greece ahead of output later this quarter. Agnico Eagle gained 41% having reported record quarterly free cash flow of more than $1.3 billion and having kept its 2026 guidance intact despite losing 370,000 ounces to a pit wall failure at Canadian Malartic. Second, a long-running structural overhang cleared: Newmont and Barrick Mining settled their Nevada dispute during the month, with Newmont paying its partner $1.95 billion in a deal that folds Fourmile into their joint venture and opens the way for Barrick's planned initial public offering of its North American gold assets by year end. Third, physical demand showed up in the funds — bullion-backed ETFs added the most gold since January in the week to 28 August.
Set that against the metal's own technical position and the tension is obvious. Gold closed 25 August at roughly $4,665, a full 3.4% above its 200-day average. Three sessions later it closed at $4,456.40, 1.4% below that same average. The equity market spent August underwriting a structurally higher gold price; the futures market spent one afternoon taking the metal back under its own trend line. Readers tracking the same divergence across the industrial complex will recognise the pattern from our copper price prediction, where the physical market and the paper market have also been telling different stories.
What actually broke the week: a Jackson Hole debut
The proximate cause was a speech. Federal Reserve chairman Kevin Warsh used his Jackson Hole debut on 28 August to warn that inflation is not slowing significantly and that, unless policymakers become confident that it is, the central bank has "work to do." He told the Kansas City Fed's symposium that the 2% inflation goal is a "firm and fixed" target and that short-term interest rates remain "the predominant tool" for achieving the Fed's mandate.
The dollar rose on the remarks and Comex December gold fell as much as 3.2% to $4,515.30 an ounce, a $173 swing from the overnight high of $4,688 and the metal's worst session in six weeks. Markets had gone into the speech pricing "roughly one-in-three odds of an increase next month," according to mining.com; the repricing that followed is covered in detail in our report on the September Fed decision and the jump in hike odds. Higher policy rates are conventionally negative for a metal that pays no interest, and the mechanism worked exactly as advertised.
Warsh also did something less widely noted. He pushed back at the US Treasury's intervention in the bond market — the buyback expansion that revived the debasement trade and helped power gold's August rally in the first place. "Unconventional policies to spur economic activity may suit genuine crises but should otherwise be used sparingly, if at all," he said. That is a central bank chairman publicly distancing himself from the fiscal authority's balance-sheet activism, and it matters more to a twelve-month gold price prediction than one afternoon of futures selling.
Not everyone reads the August surge as something that needs unwinding. Adam Hamilton, publisher of the Zeal Intelligence newsletter, argues the opposite in an essay published the same day: "The key to understanding gold's huge August is realizing it is not an anomalous spike in need of a mean reversion, but a mean reversion itself out of an earlier anomaly." His supporting number is the one that matters here — entering August, gold languished 9.7% under its 200-day average after a 26.3% drawdown, and two weeks earlier had recorded its most oversold close in 9.6 years relative to that baseline.
Gold price prediction: the data, the chart and the scenario levels
The chart below plots a year of gold, built from SPDR Gold Shares (GLD) daily closes scaled to the live XAU spot of $4,456.40, with the three scenario levels projected to 31 December 2026. The shape is the metal's; the level is anchored to the live quote.
Now put the metal beside the equities that produce it. Every ETF percentage below is calculated from the same closing series to 28 August 2026, so the comparison is like for like.
| Instrument | August 2026 | 2026 to date | Trailing 12 months |
|---|---|---|---|
| Gold, via SPDR Gold Shares (GLD) | +10.1% | +3.2% | +29.8% |
| VanEck Gold Miners (GDX) | +34.5% | +16.2% | +62.5% |
| VanEck Junior Gold Miners (GDXJ) | +35.0% | +13.2% | +67.0% |
| Eldorado Gold | +51% | n/a | n/a |
| Hecla Mining | +44% | n/a | n/a |
| Newmont | +36% | n/a | n/a |
| Barrick Mining | +24% | n/a | n/a |
ETF figures: our calculation from stockanalysis.com daily closes to 28 August 2026. Single-name August figures: mining.com, 28 August 2026.
Two readings fall out of that table that a headline percentage will not give you. The first is that the miner premium is overwhelmingly an August event: year to date GDX leads GLD by 13 points, but in August alone it led by 24. Whatever re-rated, re-rated fast. The second is that the junior fund did not lead the senior fund by much — 35.0% against 34.5% — which is not what a pure speculative melt-up looks like. In a sentiment-driven miner rally the juniors typically run away from the seniors. They did not. That is more consistent with margin arithmetic and cash-flow news than with retail chasing.
Where does that leave the levels? Spot $4,456.40 sits 5.9% above the 50-day average at roughly $4,208 and 1.4% below the 200-day at roughly $4,521. The 2026 closing low was $3,978 on 16 July, the June low was $3,988 on 24 June, and the record close was $5,405 on 29 January. August's highest close, $4,665 on 25 August, is the level to beat on the way up. Those five numbers frame everything below.
The structural tension: a central bank and a Treasury pulling different ways
Gold's August rally did not begin with the Federal Reserve. It began with the US Treasury. On 19 August the Treasury announced it would at least double buyback operations for longer-dated securities, to at least $4 billion per operation, and by 24 August senior officials had signalled that the Treasury General Account — with a balance of roughly $967 billion — could help fund those purchases. Traders read that as quantitative-easing-adjacent, even though the Treasury cannot create money the way a central bank can, and gold rose 3.9% on the announcement day alone.
The context is a benchmark ten-year yield that had climbed to 4.72% by the end of July from 3.96% earlier in the year, against a federal debt stock of about $40.1 trillion. Long rates that will not fall are a fiscal problem before they are a monetary one, and a Treasury that intervenes to manage them is doing something that historically belongs to the central bank. That is the debasement trade in its 2026 form.
Warsh's Jackson Hole language is best understood as the Federal Reserve declining to be enlisted. A chairman who says unconventional policy should be used "sparingly, if at all" and that short-term rates are "the predominant tool" is drawing an institutional boundary. For gold, that boundary cuts both ways. A Fed that refuses to monetise the fiscal problem is hawkish at the margin, which is a headwind. A Fed and a Treasury visibly disagreeing about who owns the long end of the curve is precisely the sort of institutional friction that central-bank reserve managers have been buying gold against for three years. The same policy split is doing visible work across the majors — our USD/JPY forecast tracks the dollar side of the identical trade, and the precious complex's internal spreads are dissected in our note on silver's August advance.
Worth stating plainly, because the hike narrative is doing heavy lifting in gold commentary this week: rate-hike cycles have not historically been fatal for bullion. Hamilton's dataset of the thirteen Federal Reserve tightening cycles since 1971 — three or more consecutive hikes with no intervening cut — shows gold averaging a 26.3% gain across the exact spans of those cycles, with an average 48.4% gain in the eight where it rose and an average 9.0% loss in the five where it fell. The asymmetry is why a single hawkish speech is a poor foundation for a twelve-month view.
The call: base, bull and bear to 31 December 2026
All three levels are measured against live spot of $4,456.40, pulled 29 August 2026 at 10:40 UTC.
Base case — $4,640, which is 4.1% above spot. This is roughly the spot-equivalent of the overnight Comex high of $4,688 that was rejected on Friday, and just under August's best close of $4,665. It assumes gold reclaims its 200-day average, holds the August breakout, and spends the fourth quarter consolidating the year's mean reversion rather than extending it. It is the outcome consistent with miners being approximately right about margins and the metal simply catching up slowly. Probability we would attach: around 45%.
RelatedRhodium Price Forecast: $11,000 Bull Case vs $7,500 Bear
Bull case — $5,050, which is 13.3% above spot. Roughly half the round trip back to January's $5,405 closing record. It needs two of three things: continued ETF accumulation at August's closing pace, a Federal Reserve that hikes once and signals it is done, or further Treasury balance-sheet activism that reopens the debasement trade. A full retest of $5,405 would be 21.3% above spot and sits outside our central range. Probability: around 30%.
Bear case — $3,960, which is 11.1% below spot. This is the base of the entire August rally — beneath the 24 June low of $3,988 and the 16 July closing low of $3,978 — and it is where the metal returns if a September hike is delivered and followed by hawkish guidance. The staging posts on the way down are the 50-day average at about $4,208, which is 5.6% below spot, and the 3 August low near $4,051, which is 9.1% below spot. Probability: around 25%.
What would change this view. On the upside, a weekly close back above $4,665 with the 200-day reclaimed would retire the bear case as a base case and shift weight to $5,050. On the downside, two consecutive weekly closes beneath the 50-day at $4,208 would invalidate the August breakout entirely, and the miner divergence would then have to be read as an equity-market error rather than a leading indicator. The cleanest disconfirmation of the whole thesis is narrower: if GDX gives back its August outperformance while the metal holds, the operating-leverage story was noise, and the metal's own 200-day becomes the only signal worth watching. More cross-asset work sits on our markets desk.
Frequently asked questions
What is the gold price prediction for the end of 2026?
Our base case is $4,640 an ounce by 31 December 2026, 4.1% above the live spot of $4,456.40 pulled on 29 August 2026. The bull case is $5,050, 13.3% above spot, and the bear case is $3,960, 11.1% below spot and at the base of the August rally. Those are scenarios with attached probabilities of roughly 45%, 30% and 25%, not forecasts of a single outcome.
Why did gold fall on 28 August 2026?
Federal Reserve chairman Kevin Warsh told the Kansas City Fed's Jackson Hole symposium that inflation is not slowing significantly and that the central bank has "work to do." The dollar rose, and Comex December gold fell as much as 3.2% to $4,515.30 an ounce — a $173 swing from the overnight high of $4,688 and the worst session in six weeks, according to mining.com.
Why did gold miners outperform gold so heavily in August 2026?
Operating leverage plus company-specific news. A gold producer's costs are broadly fixed, so a 10% move in the metal lands disproportionately in margin. On top of that, Eldorado began crushing first ore at Skouries, Agnico Eagle reported record quarterly free cash flow above $1.3 billion, and Newmont settled its Nevada dispute with Barrick for $1.95 billion. GDX rose 34.5% against GLD's 10.1%.
Is gold overbought after its best month since January?
Not on the standard measure. Gold closed 28 August 1.4% below its 200-day moving average, having entered the month 9.7% below it. Adam Hamilton of Zeal Intelligence notes that over the last five calendar years extreme overbought conditions have not begun until gold traded at least 18% above that baseline. August was a recovery from a 26.3% drawdown, not an extension of a high.
What level invalidates the bullish gold scenario?
Two consecutive weekly closes below the 50-day moving average at roughly $4,208 — 5.6% under spot — would break the August structure. Below that, the staging posts are the 3 August low near $4,051 and then the bear level at $3,960, which marks the base of the entire August advance and the July closing low region.
Does a Federal Reserve rate hike automatically mean lower gold?
History says no. Across the thirteen Fed tightening cycles since 1971, gold averaged a 26.3% gain over the exact spans of those cycles, rising in eight of them for an average 48.4% and falling in five for an average 9.0%, on Zeal Intelligence's data. Hikes reliably hurt gold over days and weeks through the futures market; they have not reliably hurt it over full cycles.
Disclaimer
This article is analysis and information only. It is not investment advice, a recommendation, or an offer to transact in any instrument. Prices, levels and probabilities are estimates made on the date of publication and will change. Trading gold, gold derivatives and mining equities carries risk, including the risk of losing more than your initial outlay. Capital at risk.