

"The House is settled" is the sentence doing the most work in political-market commentary this month, and the number people cite for it is wrong twice over. US House control 2026 is not trading at 87.5% on Polymarket. The Democratic leg trades at 87.5 cents and the Republican leg at 13.5 cents, and those two sum to 101.0%. Strip the overround out proportionally, which is what we do before quoting any probability on this desk, and the market's actual price on a Democratic House is 86.6%, with 13.4% on Republicans holding. The missing cent is the least of it. The real problem is what the flat tape is taken to mean. The Democratic leg closed at 87.5 cents on 9 August and closed at 87.5 cents on 8 September, and the standard deviation across those thirty-one daily closes was 0.66 of a cent. Commentators have read that stillness as consensus. It reads more like absence.
Here is what the price actually is. Polymarket runs a separate, much thinner market on the national House popular vote, and its thirteen margin buckets de-vig to an expected Democratic margin of 7.70 points. We then pulled the raw poll database that Silver Bulletin publishes underneath its generic-ballot average and computed the average ourselves: across the 25 surveys whose fieldwork ended on or after 9 August 2026, the influence-weighted margin is D+5.67 and the unweighted mean is D+5.47. That gap is the article. The 86.6% is not a forecast of 435 separate races. It is one bet on one variable, and the variable is currently priced about two points friendlier to Democrats than the polling that is supposed to underwrite it.
Key facts
- The two live legs quote 87.5 cents and 13.5 cents, summing to 101.0%; de-vigged that is 86.6% Democratic and 13.4% Republican — Polymarket Gamma API, 8 September 2026
- The Democratic leg closed at 87.5 cents on both 9 August and 8 September, with a 0.66-cent standard deviation across the thirty-one daily closes between them — Polymarket CLOB price history, 8 September 2026
- 82.0% of the $574,588 visible bid book sits between 84 and 87 cents; the entire book between 84 and 60 cents holds $4,825 — Polymarket CLOB order book, 8 September 2026
- Cook rates 205 seats Democratic-favoured, 209 Republican-favoured and 21 Toss Up, so Democrats need 13 of the 21 and Republicans need 9 — Cook Political Report House ratings, retrieved 8 September 2026
- If the 21 toss-ups were independent coin flips, Democrats would reach 218 only 19.2% of the time; 86.6% requires each one to be a 70.6% Democratic favourite — The Traders Spread calculation, 8 September 2026
- The market's popular-vote ladder de-vigs to an expected margin of D+7.70 against our own 30-day poll average of D+5.67 — Polymarket Gamma API and Silver Bulletin poll database, model date 7 September 2026
- Four separate Polymarket routes to a Democratic House price at 86.3%, 86.6%, 87.1% and 88.7% after de-vigging — The Traders Spread calculation, 8 September 2026
The vig, the dead legs and the date
Start with the instrument itself, because it is stranger than the headline suggests. The event carries nine legs, not two. Seven of them are called Party A through Party F and Other, they carry zero volume, no quoted price, and a stale end date of 11 July 2025. They are structural leftovers from how the market was scaffolded in July 2025, and they are the reason the two live legs are allowed to sum above 100 without the platform flagging an obvious arbitrage. A trader reading the front page sees 87.5 and 13.5 and reasonably assumes they add to 101 because of the spread. They add to 101 because the book was built to hold nine outcomes and only ever traded two. The headline House market has turned over $10,274,230 since it opened, split $5,869,066 on the Democratic leg and $4,405,164 on the Republican one. Links to Polymarket are affiliate links, from which The Traders Spread may earn a commission at no cost to you.
The resolution date checks out, which is not something we assume. Polymarket's endDate field on this event reads 3 November 2026, and Polymarket routinely clones that field from a sibling market, so we tested it against the statute rather than against the platform. The federal general election falls on the first Tuesday after the first Monday in November. In 2026 the first day of November is a Sunday, the first Monday is the 2nd, and the first Tuesday after it is the 3rd. The field is right. There are 56 days between this article and resolution.
Where the stillness comes from
We pulled the live order book on the Democratic leg at the same moment we pulled the price, and the shape of it explains the flat tape better than any theory about consensus does.
The best bid is 87 cents for 3,239 shares, about $2,818 of notional. The best offer is 88 cents for 24,027 shares. Below the touch, the bid side stacks up fast and then falls off a cliff: 101,745 shares at 86 cents, 140,268 at 85, and 311,738 at 84. Add those four levels together and you get $471,407, which is 82.0% of the entire $574,588 visible bid book sitting inside a three-cent band. Now look at what is underneath. Between 84 cents and 60 cents, across a 24-cent range, the whole book holds $4,825. Not $4.8 million. Four thousand eight hundred and twenty-five dollars.
That is what a pinned price looks like. A seller with half a million dollars of yes exposure can hit the bids down to 84 cents and barely register. The next five thousand dollars of selling takes the print to 60. The 0.66-cent standard deviation over the last month is not thirty-one days of the market agreeing with itself; it is thirty-one days of nobody needing to find out where the real clearing level is. We made the same observation about a much smaller book in our note on the 2028 Democratic nomination market, and the mechanism scales: depth concentrated at the touch produces stability that dissolves the moment anyone tests it.
The offer side is the mirror image and worth its own sentence. There is $2,281,116 of ask notional against $574,588 of bid, and $2,003,220 of that sits as a single resting wall at 99 cents. Strip that wall out and the two sides are roughly balanced. Nobody is defending 87.5 with size. They are defending 84.
Cook counts 21 toss-ups. The market counts one.
The Cook Political Report's House ratings, which we retrieved on 8 September 2026 from a page last published on 3 September, break the chamber down like this: 184 Solid Democrat, 12 Likely Democrat and 9 Lean Democrat, for 205 seats rated in the Democrats' favour; 21 Toss Ups; then 7 Lean Republican, 20 Likely Republican and 182 Solid Republican, for 209 rated in the Republicans' favour. Two hundred and eighteen is the majority. So Democrats need 13 of the 21 toss-ups and Republicans need 9.
Of those 21 toss-ups, 5 are currently held by Democrats and 16 by Republicans. Erin Covey, the Cook Political Report's Editor for the U.S. House of Representatives, wrote on 3 September that "a dozen of the 37 competitive House districts (those rated Toss Up, Lean Republican and Lean Democrat) are at least 20% Hispanic," and that fourteen Republicans are personally defending toss-up seats. Fourteen incumbents plus the two open Republican toss-ups, AZ-01 and MI-10, reconciles exactly to sixteen, and 21 plus 7 plus 9 reconciles exactly to her 37 competitive districts. The ratings and the commentary are internally consistent, which is more than can be said for how the market is being described.
Now run the arithmetic that nobody running the "settled" line has run. If those 21 races were genuinely independent coin flips, the probability that Democrats take at least 13 of them is 19.2%. To get from there to 86.6%, every single one of Cook's toss-ups has to be a 70.6% Democratic favourite, at which point it is not a toss-up and Cook would have rated it Lean D. The market is not pricing race-level uncertainty at all. It has collapsed 435 contests into a single national-swing variable and is trading that.
Polymarket agrees with this reading of itself, incidentally. On the Balance of Power grid, which has turned over $11,188,557 and is the largest midterm market on the platform, the conditional probability of a Democratic Senate given a Democratic House is 59.2%, while the conditional probability of a Democratic Senate given a Republican House is 7.1%. Chambers with completely different maps, classes and candidates move together because both are downstream of the same national number.
Four routes, one number
There are four separate ways to extract a Democratic-House probability from Polymarket, and we ran all of them, de-vigging each ladder proportionally before reading anything off it.
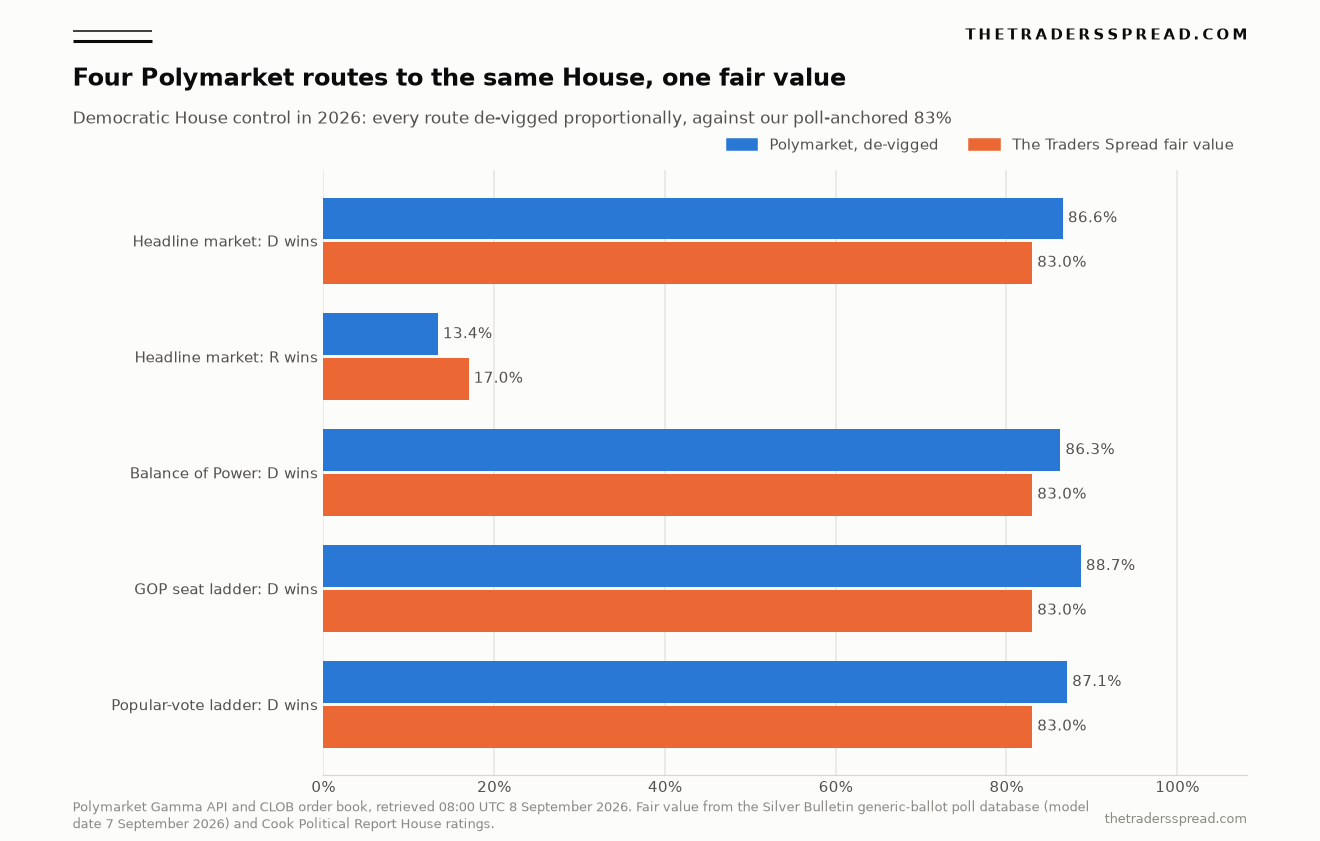
| Route | Volume | Raw legs sum to | De-vigged P(Democratic House) |
|---|---|---|---|
| Headline House market | $10,274,230 | 101.0% | 86.6% |
| Balance of Power grid | $11,188,557 | 100.8% | 86.3% |
| Popular-vote margin ladder | $131,725 | 105.4% | 87.1% (reconstructed) |
| Republican seat-count ladder | $291,267 | 107.0% | 88.7% |
All prices retrieved from the Polymarket Gamma API at 08:00 UTC on 8 September 2026. The popular-vote figure is reconstructed by taking each de-vigged margin bucket and applying a conditional probability that Democrats convert that margin into a majority.
The cluster is tight. Twenty-one million dollars of turnover across two large markets produces 86.6% and 86.3%, a third of a point apart, and the two thin ladders land inside two and a half points of them. That consistency is real and we are not going to pretend otherwise. Anyone claiming the headline price is dramatically wrong has to explain why four independent constructions agree.
The interesting disagreement is inside the seat ladder. Its ten buckets carry a 107.0% overround, the fattest on the board, and after de-vigging they put 62.8% on Republicans finishing the night with 204 seats or fewer. Cook's ratings give Republicans a floor of 209 if they lose every toss-up and hold everything rated Lean R or better. So the market's modal path is not "Democrats sweep the toss-ups." It is "Democrats sweep the toss-ups and then take five or more seats Cook currently rates as Republican-favoured." That is a genuinely aggressive view, priced in the thinnest corner of the complex.
The two points that make the whole difference
The popular-vote ladder is where the assumption lives. De-vigged, its modal bucket is a Democratic win by 8 to 10 points at 26.1%, it puts 75.8% on a margin of six points or better, and its probability-weighted expected margin is D+7.70.
Against that, our own average of the last month of fieldwork is D+5.67. The individual polls range from HarrisX at R+2 among likely voters in late August to Angus Reid Global at D+9 among adults in mid-August, with the most recent entry, Focaldata's 28 August to 2 September likely-voter survey of 1,837 respondents, at D+7. Silver Bulletin's own published average stood at D+6.6 on 24 August, and its likely-voter-adjusted variant at D+7.6.
Model the margin as normally distributed with a three-and-a-half point standard deviation, which is roughly the historical September-to-election error on generic-ballot averages, and apply the same conditional-majority curve. Centre it on the market's D+7.70 and you get 87.9%, which is the market price and confirms the internal consistency. Centre it on the likely-voter-adjusted D+7.6 and you get 87.7%. Centre it on Silver Bulletin's headline D+6.6 and you get 82.1%. Centre it on our own mixed-population D+5.67 and you get 75.9%.
Twelve points of fair value swing, produced entirely by the choice of turnout screen, 56 days before anyone votes. That is the number the flat tape is hiding. Charlie Cook, who founded the report that bears his name, argued on 23 June that "in midterms the table is set as early as the preceding year" and that "it's unlikely that anything will change the fundamental dynamics between now and the Nov. 3 election." He is probably right about the direction. He is not making a claim about a 12-point band of pricing uncertainty inside a market quoting to the half-cent.
The call
Our fair value on a Democratic House is 83%. The market, de-vigged, is 86.6%. That puts the price above our fair value by 3.6 points, and we are recording it that way.
The reasoning is not that Democrats are unlikely to win the House. They are clearly favoured, and every route we ran says so. The reasoning is about which turnout screen the price has already adopted. The market's implied national margin of D+7.70 sits at the very top of the defensible range, matching the likely-voter-adjusted average rather than the broader one, and likely-voter screens eight weeks out have historically been the least stable input in the whole exercise. Weighting the four anchors, with more on the population-mixed average than on the screens that flatter the out-party, lands at 83%.
Related2026 Balance of Power: Democrats Sweep at 62.5 Cents
Base case, at roughly 83%: the national margin comes in somewhere between D+5 and D+8, Democrats take the great majority of Cook's 21 toss-ups, and the chamber changes hands with somewhere between 220 and 232 seats. Bull case for the yes leg, around 25%: the margin runs D+10 or better, the seat ladder's aggressive read is vindicated, and Republicans finish below 200. Bear case, around 17%: the margin compresses toward D+3, which is inside one standard deviation of today's average, and the toss-ups break the way toss-ups usually break in a normal year, which is close to evenly. That is the scenario the 84-cent shelf in the order book is not equipped to absorb.
What would change our mind. A generic-ballot average that consolidates above D+7 across three or more September polls with likely-voter screens would move fair value to 86% or above and put us in line with the market. A Cook ratings revision that moves five or more toss-ups into the Lean D column would do the same by lifting the Democratic floor above 210. In the other direction, resolution of the outstanding map questions against Democrats, with Missouri's new map still priced at only 21.5% to be used, or an October generic-ballot reading inside D+4, would take fair value into the seventies. We are watching the 84-cent bid shelf as the tell: if it thins before the polls move, the price will follow the book rather than the news.
FAQ
Does 87.5 cents mean an 87.5% chance?
No. The two live legs on this event sum to 101.0%, so the quoted cents carry the platform's overround. De-vigged proportionally, the Democratic leg is 86.6% and the Republican leg 13.4%. On thinner ladders the distortion is larger: the Republican seat-count market sums to 107.0%, so its raw prices overstate every bucket by roughly seven per cent.
Why does the seat-count market disagree with the headline market?
It de-vigs to 88.7% for a Democratic House against the headline market's 86.6%. The gap comes from where the money is. The headline market has turned over $10.27m; the seat ladder has turned over $291,267 across ten buckets. Thin markets carry wider spreads and fatter overrounds, and their implied probabilities drift further from the consensus price.
Is the 3 November 2026 resolution date reliable?
We checked it rather than trusting the field, because Polymarket end dates are frequently copied across sibling markets. Federal general elections fall on the first Tuesday after the first Monday in November. In 2026, 1 November is a Sunday and 2 November is the first Monday, so 3 November is correct. Fifty-six days separate this piece from resolution.
What are the seven zero-volume legs on the event?
They are labelled Party A through Party F and Other, carry no quoted price, no liquidity and an end date of 11 July 2025, the day the event was created. They are scaffolding from a multi-party template and never traded. Their presence is why two live legs can quote to 101% without the platform treating it as a pricing error.
How much would it cost to move this price?
Less than the headline volume suggests. On 8 September the whole visible bid book on the Democratic leg was $574,588, of which $471,407 sat between 84 and 87 cents. Below 84 cents and down to 60, the book held $4,825 in total. Roughly half a million dollars of selling reaches 84; a further five thousand reaches 60.
Does the Senate market tell you anything about the House?
A great deal, and that is the point. On the Balance of Power grid, a Democratic Senate is 59.2% likely if Democrats take the House and 7.1% likely if they do not. Two chambers with different maps and different candidate classes are priced as near-copies of one another because both are functions of the same national swing.
For context on how we handle overround and thin books elsewhere on this desk, see our work on Fed rate-cut pricing for 2026, on the government shutdown market, and on Brazil's presidential race, where a similarly confident headline number sat on a similarly narrow book.
This article is analysis and information, not financial or investment advice. Prediction-market contracts can resolve worthless and capital is at risk. Prices, order-book depth and polling averages quoted here were retrieved on 8 September 2026 and change continuously. Do your own research and consider your own circumstances before acting on anything you read here.