

The two-year rate differential is treated as the master variable for EUR/USD. On a year of evidence it is not doing the work.
On 10 February 2026 the gap between the US two-year Treasury yield and the euro area AAA two-year spot rate stood at 1.421 percentage points, and spot traded at 1.1894. On 25 August the gap stood at 1.420 points, and spot traded at 1.1662. One basis point of differential. Two hundred and thirty-two pips of spot.
The relationship has not inverted. It has re-based.
Regress five-day changes in the two-year spread against five-day changes in spot across the 246 overlapping observations since 3 September 2025 and the correlation comes out at −0.105. Stretch the window to ten days and it reaches −0.218; to twenty days, −0.239; to forty, −0.294; to sixty, −0.445. The sign holds throughout, so a widening dollar advantage does still pull the pair lower. But the explanatory power is a pure function of horizon, and at the horizon most spot books actually run it rounds to noise. The spread sets a drift over two months and accounts for about one per cent of the variance over a week. Pricing the September central bank calendar off the differential means pricing a variable that will not resolve inside the holding period.
Key facts
- EUR/USD spot 1.1578, and a 90-day range of 1.1340 to 1.1699 — ECB euro foreign exchange reference rates, 2 September 2026
- US two-year Treasury 4.39%, euro area AAA two-year spot rate 2.876%, spread 1.514 points — FRED and the ECB Data Portal, 1 September 2026
- ECB deposit facility 2.25%, raised from 2.00% with effect from 17 June 2026 — the first increase since September 2023, per the ECB key interest rates series
- Fed funds target range 3.50–3.75%, held on 29 July 2026 by 9–3, with three presidents preferring a 25bp increase — FOMC statement, 29 July 2026
- Euro area headline HICP 3.3% in August, up from 2.9% in July, energy at 14.3% — Eurostat flash estimate, 1 September 2026
- Non-commercial CME futures accounts net short 36,352 euro contracts, the 14th percentile of the range since January 2024 — CFTC Commitments of Traders, 25 August 2026
- Twenty-one-day realised volatility 3.64% annualised, against 5.43% over the full year — author's calculation on ECB reference rates
The spread explains two-month moves and almost nothing shorter
Run the sixty-day regression and the beta is −410 pips per percentage point of spread widening. That is a usable number. It also carries an R-squared of 0.20, which means four fifths of a two-month move in EUR/USD comes from somewhere other than the two-year gap.
The level relationship is weaker still. Correlation between the spread and spot in levels across the same year is −0.284.
Two things follow. The differential is a slow variable, so it belongs in a quarterly frame rather than a weekly one. And the constant in the relationship has moved: the same 1.42 spread bought 1.1894 in February and 1.1662 in August, which is a repricing of the euro's risk premium rather than a repricing of the rate gap.
The table below is the current state of the two curves.
| Instrument | Euro area | United States | Gap (bp) |
|---|---|---|---|
| Policy rate | 2.25% (deposit facility) | 3.625% (target midpoint) | 137.5 |
| Overnight benchmark | 2.188% (€STR) | 3.63% (EFFR) | 144.2 |
| Two-year government | 2.876% (AAA spot) | 4.39% (Treasury) | 151.4 |
| Two-year over overnight | +68.8bp | +76.0bp | 7.2 |
| Headline inflation | 3.3% (Aug HICP flash) | 3.7% (Jun PCE, staff estimate) | −40 |
| Real policy rate | −1.05% | −0.08% | −97 |
Sources: ECB Data Portal and Eurostat for the euro leg; FRED, the FOMC statement of 29 July 2026 and the accompanying minutes for the dollar leg. Rate observations 1–2 September 2026. One caveat on the two-year row: these are government spot rates, not OIS, so a slice of the 151bp gap is term premium rather than expected policy.
Both curves are priced for tightening, and by nearly the same amount
The euro area two-year sits 68.8bp above €STR. The US two-year sits 76.0bp above EFFR.
Seven basis points separate the two forward paths. Neither curve prices cuts.
This is the part of the setup that most 2026 commentary has not caught up with. The framing inherited from last year had the ECB finished cutting, the Fed still holding cuts in reserve, and the gap compressing toward the euro. It died on 17 June, when the Governing Council raised the three key rates by 25 basis points and ended a cutting cycle that had run from 4.00% down to 2.00% between June 2024 and June 2025. The deposit facility has stood at 2.25% since. At the meeting on 23 July the Council held, restated that it "is committed to setting monetary policy to ensure that inflation stabilises at its 2% target in the medium term", and confirmed it is not pre-committing to a particular rate path.
The Fed side is symmetrical and louder. Three regional presidents, Beth M. Hammack of the Cleveland Fed, Neel Kashkari of Minneapolis and Lorie K. Logan of Dallas, voted against the July hold because they "preferred to raise the target range for the federal funds rate by 1/4 percentage point at this meeting". The minutes of that meeting also record that participants judged inflation to have "remained elevated", with total PCE at 4.1% in May and an estimated 3.7% in June.
Both central banks are therefore hedging against an upside inflation surprise rather than against a growth accident. That is a different regime from the one the consensus 2026 forecasts were built in, and it is why convergence has stopped happening: over 2026 the US two-year has climbed 92bp and the euro area two-year 76.6bp, so the spread is 15.4bp wider than it was on 2 January rather than narrower.
The euro's real policy rate is a full point worse than the dollar's
Deflate both policy rates by current headline inflation and the picture flips.
The euro area real policy rate is −1.05%. The US real policy rate is −0.08%. Ninety-seven basis points of real-rate disadvantage sits on the euro even though the nominal gap is only 137.5bp.
That asymmetry is the strongest euro-positive argument available, because it defines how much repricing the front end still has to do. The euro area curve prices 68.8bp of tightening over two years against a real policy rate a full point below zero. If the Governing Council decides the August print is more than an energy pass-through, the September and October meetings hold more upside surprise than the market has embedded, and a 25bp repricing of the euro leg alone is worth roughly 100 pips at the sixty-day beta.
The counter is that this inflation is the wrong kind. Energy ran at 14.3% year on year in August against 10.3% in July, while services decelerated to 3.0% from 3.3%. A net energy importer facing that mix is absorbing a terms-of-trade shock: nominal rates rise, the real income of the bloc falls, and the currency has historically weakened through the episode rather than strengthened. The ECB itself framed the June increase around an energy outlook standing "well above the levels recorded prior to the conflict in the Middle East".
Both readings are live. They resolve on the composition of the September HICP, not on the headline.
Carry costs a long euro position 167 pips a year
Covered interest parity off €STR at 2.188% and SOFR at 3.66% puts the three-month forward at 1.1620, the six-month at 1.1662 and the twelve-month at 1.1745. Long EUR/USD pays those points away.
Forty-two pips a quarter. A hundred and sixty-seven over a year.
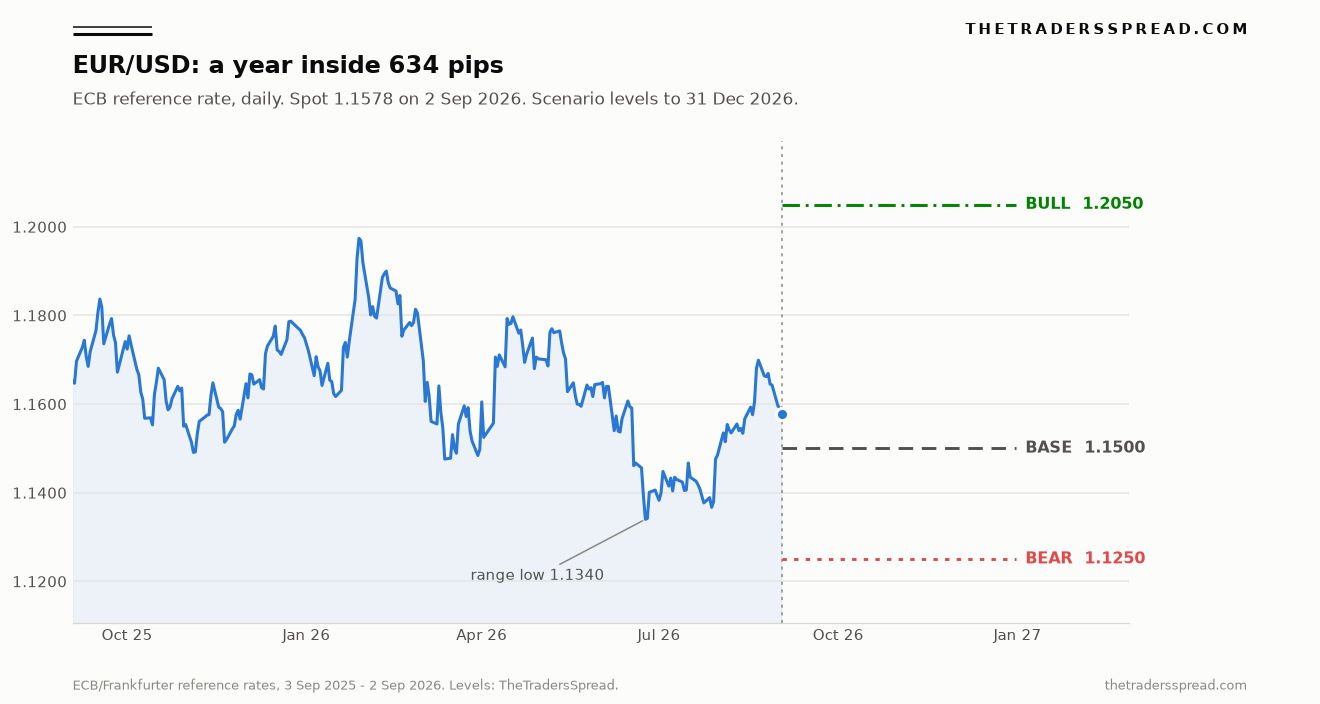
Set that against the range. The pair has covered 634 pips top to bottom in twelve months and 359 pips in the last ninety days, so a year of carry consumes a quarter of the annual range and just under half of the recent one. A directional euro long has to be right on timing as well as direction before the roll is paid for, which is the same structural problem that shapes the USD/JPY book from the opposite side and the mirror image of the position described in our USD/CHF work, where the dollar is the high-yielder against a franc paying nothing.
Positioning tells the second half of the story. Non-commercial accounts on CME held a net long of 30,158 euro contracts on 23 June, flipped short through July to a trough of −72,447 on 28 July, and had covered back to −36,352 by 25 August. Spot went from 1.1367 on 28 July to 1.1662 on 25 August across that cover, so the 36,095-contract reduction moved the pair 295 pips. The rally was a positioning event.
What matters now is that the base is no longer extreme. At the 14th percentile of the range since January 2024 the market is short, but the peak long of 180,305 contracts on 10 February and the trough of −75,573 in December 2024 both sit a long way from here. The squeeze fuel that produced the August move has largely been spent.
Realised volatility corroborates the compression: 3.64% annualised over twenty-one days against 5.43% over the year, a suppression that also runs through GBP/USD and the dollar-bloc crosses covered in our USD/CAD analysis.
RelatedGBP/AUD Forecast: 1.9600 Bull Case vs 1.8400 Bear Case
The call
Base case, 50%: the range holds into year-end and EUR/USD spends the quarter between 1.1400 and 1.1750, closing near 1.1500. The two central bank meetings that matter land within a week of each other: the Governing Council on 9–10 September, hosted in Berlin by the Bundesbank, and the FOMC on 15–16 September. Both are priced to hold. Both carry a hawkish tail. Symmetrical hawkish tails on a pair with a 151bp differential and negative carry produce chop, not trend.
Bear case, 30%: 1.1250. This needs the energy shock to read as a terms-of-trade transfer rather than a policy trigger, so the euro area curve stalls near 2.90% while the US two-year keeps grinding toward 4.60% on the strength of the three July dissents. The spread widens 30bp, the sixty-day beta delivers around 120 pips, and the residual comes from the carry roll and the loss of the short base that powered August.
Bull case, 20%: 1.2050. This needs the September HICP to show the energy shock leaking into services, forcing the euro area two-year through 3.10% while the Fed's hawkish minority stays a minority. It also needs the risk premium that opened between February and August to close, and that premium is the part of the move nobody can size in advance.
What would change this read. A euro area two-year above 3.10% with services HICP accelerating rather than decelerating would move the bias up. So would a net short position rebuilding past 70,000 contracts, which would restore the squeeze fuel. In the other direction, a US two-year above 4.60% with the September dot plot showing a majority for a hike would take the bear case to base. A close above 1.1699 that holds a week would invalidate the range framing entirely and force a rebuild.
The honest summary is that conviction here is low by construction. A pair whose primary macro anchor explains a fifth of its two-month variance, sitting mid-range with volatility at the year's floor and a hundred and sixty-seven pips of annual carry against a long, is not offering a clean directional trade. It is offering a range with two hawkish central banks stapled to the middle of it.
FAQ
Why does a wider US-euro rate gap not push EUR/USD lower on the day?
Because the relationship operates on a two-month clock. Correlation between spread changes and spot changes is −0.105 at five days and −0.445 at sixty. Daily and weekly moves in the pair are dominated by positioning, flow and risk premium, and the differential only asserts itself once those wash out over a quarter.
What does the ECB's June 2026 hike change for the pair?
It ends the convergence thesis that underpinned most 2026 euro forecasts. With the deposit facility at 2.25% and the euro area two-year at 2.876%, the curve now prices further tightening rather than cuts, on both sides of the Atlantic. The spread is 15.4bp wider than it was in January, not narrower.
Is the euro a funding currency at these levels?
It remains the low-yielder, and the forward curve reflects that: twelve-month EUR/USD forward points run about +167 pips, so a long euro spot position pays away roughly 1.44% a year against the range it trades in. That is a meaningful drag on any medium-term euro-bullish position held through the roll.
How stretched is euro positioning right now?
Moderately short and less stretched than a month ago. CFTC data put non-commercial accounts at a net short of 36,352 contracts on 25 August, recovered from −72,447 on 28 July. That is the 14th percentile of the range since January 2024, so the market leans short without being crowded there.
Which September data point matters most?
The services component of the euro area September HICP. Headline is being carried by energy at 14.3%, which the Governing Council can treat as a pass-through. Services decelerating to 3.0% is what allows a hold. A services reacceleration is the single release that would force the euro area two-year materially higher and reprice the pair.
Does low realised volatility argue for a breakout?
Not on its own. Twenty-one-day realised volatility at 3.64% against 5.43% over the year makes optionality cheap, but compression can persist for months in a pair with symmetrical central bank risk. The two September meetings are the nearest scheduled catalysts capable of breaking it.
Disclaimer
This article is analysis and information, not investment advice, and it is not a recommendation to buy or sell any instrument. Foreign exchange and CFD trading carries substantial risk and capital is at risk. Levels, probabilities and scenarios reflect the author's reading of publicly available data at the time of writing and may be wrong. Readers should conduct their own research and consider their circumstances before acting.