

The Bank of Japan raised its policy rate to 1.25% on Friday 18 September, and AUD/JPY rose 1.5% on the day. Those two facts should not sit together. A central bank tightening is supposed to lift its currency, and the yen is the funding leg of one of the oldest carry trades in the market. Instead the European Central Bank's reference fix for the cross went from 110.76 on 17 September to 112.42 on 18 September, and it was still 112.25 at Monday's fix. At 06:41 UTC on Tuesday the CNBC quote showed 112.16. The pair is now 15.1% above its level of a year ago and only 2.3% under the 114.89 fix of 28 August, the highest in the ECB-derived series since 1999. The yen got a rate hike and lost ground anyway. This forecast sets out why, and what would have to change for that to reverse.
Here is the number almost nobody quotes. On 1 January the gap between the Reserve Bank of Australia cash rate (3.60%) and the BoJ call rate (0.75%) was 2.85 percentage points. When Friday's hike takes effect on 24 September the gap will be 3.10 points, because the RBA has lifted rates by 75 basis points this year against the BoJ's 50. Two Japanese hikes and the carry spread is wider, not narrower. That is the whole contradiction in one line, and it is why the cross has spent 167 of the 184 fixes this year above its July 2007 carry-trade peak of 107.46.
- BoJ raised the uncollateralized overnight call rate target from around 1.0% to around 1.25% by a 7-2 vote, effective 24 September, with both dissenters preferring no change — Bank of Japan statement, 18 Sep 2026
- RBA cash rate target stands at 4.35% after hikes in February, March and May, unchanged on 11 August — RBA cash rate table, read 22 Sep 2026
- AUD/JPY ECB reference cross 112.25 on 21 Sep, up 6.8% from 105.06 on 2 Jan and 15.1% from 97.49 on 22 Sep 2025 — ECB reference rates via Frankfurter, retrieved 22 Sep 2026
- Japan's Ministry of Finance sold dollars for yen worth ¥11.73 trillion across 30 April, 4 May and 6 May, and a further ¥15.40 trillion between 30 July and 26 August — Ministry of Finance intervention releases, 7 Aug and 28 Aug 2026
- BoJ Board member Kazuyuki Masu put the nominal neutral-rate estimates at 1.1% to 2.5%, which leaves the new 1.25% policy rate at the bottom of the range — Masu speech in Fukui, 10 Sep 2026
- The RBA Monetary Policy Board next meets on 28 and 29 September — RBA board meeting schedule, read 22 Sep 2026
The arithmetic Friday's hike did not change
AUD/JPY is priced off two short rates and one mood. The short rates set the rate differential, which is what a holder of Australian dollars funded in yen collects each night through the rollover. The mood decides whether anyone wants to hold that position at all. When the BoJ moved to 1.25%, the differential compressed by 25 basis points on paper, from 3.35 to 3.10 points. That is a real loss of carry, about 7.5% of the annual income on the trade.
The statement itself took the sting out of it. Two of nine Board members voted against. According to the BoJ's own note, Toichiro Asada argued that with core CPI "below 2 percent recently" it could not be said the economy was strong, and Ayano Sato argued that developments "did not appear to have substantially accelerated." A hike with two dissents for doing nothing is a hike that tells the market the next one is not close.
Look at the forward language too. The Bank said it will "continue to raise the policy interest rate," but it will "consider the timing and pace of adjustment" against the Middle East shock, AI-related demand and "developments in foreign exchange rates." There is no date and no path. The core CPI range it cited, 1.5% to 2.0%, sits at or below target.
Australia runs the other way. Headline and underlying inflation were both "around or a little above 3½ per cent" over the past year, in the Governor's own count, against a 2 to 3% target band. Unemployment is 4.5%. There is no Australian argument for cutting, and there is a live argument for another hike.
So the carry did shrink on Friday. It shrank by less than the RBA's 2026 hikes had already added, and the dissent vote told holders the shrinking would be slow. A carry trader reads that as more time to collect, and the fix shows the market read it that way.
Above the 2007 peak: the chart and five precedents
The chart below plots the daily ECB-derived AUD/JPY cross from 1 December 2025 to 21 September 2026 with the three BoJ decisions and the first Ministry of Finance intervention marked, and our scenario levels projected to 31 December.
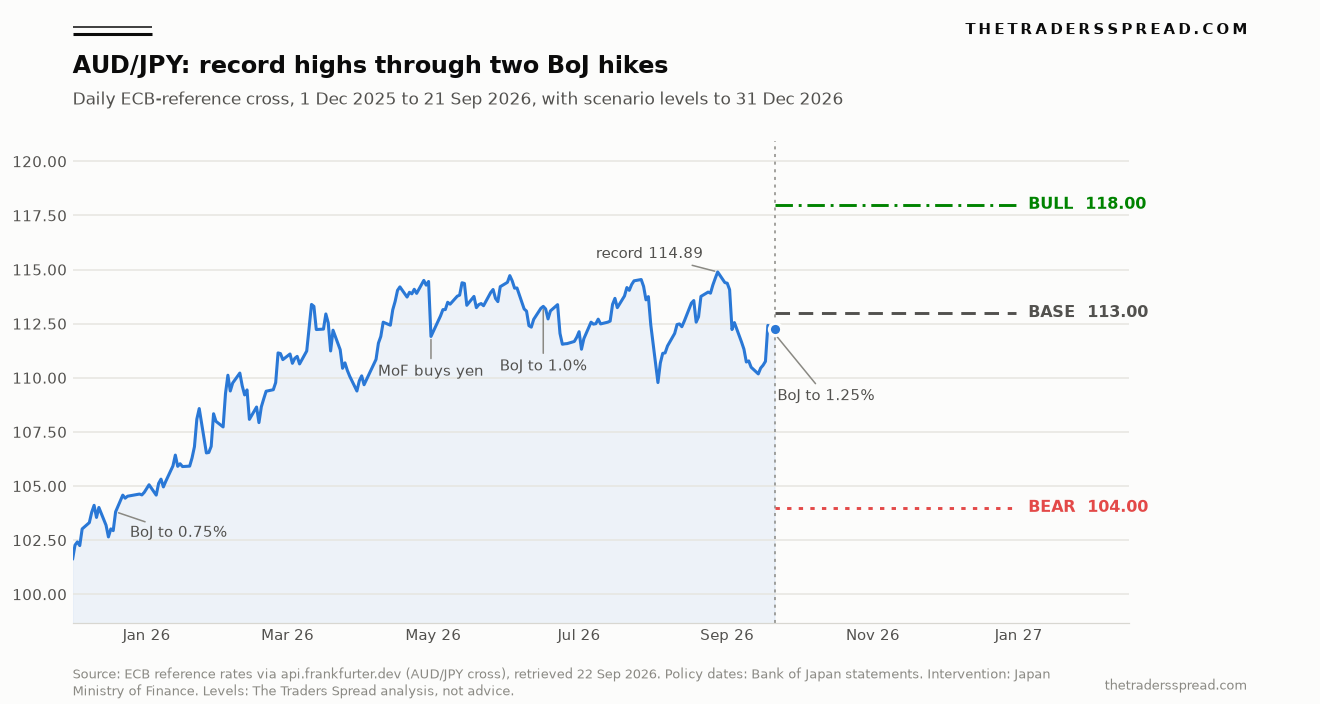
Two things stand out. The cross has climbed through every Japanese hike of this cycle, and the one sharp break in the line (late July into early August) came from risk appetite, not from Tokyo's policy rate. The pair fell from a 114.54 fix on 27 July to 109.78 on 3 August, a 4.2% slide in five sessions, then climbed back to the 114.89 record fix on 28 August.
The table sets the Friday move against the four earlier BoJ hikes since mid-2024. The day change runs from the previous ECB fix to the fix on decision day. The BoJ announces around midday Tokyo, hours before the 14:15 CET fix, so the fix captures the reaction.
| BoJ decision | New call-rate target | Prior fix | Decision-day fix | Day change | Five fixes later |
|---|---|---|---|---|---|
| 31 Jul 2024 | 0.25% | 101.21 | 97.84 | -3.33% | 96.51 (-4.64%) |
| 24 Jan 2025 | 0.50% | 97.98 | 98.73 | +0.77% | 96.39 (-1.62%) |
| 19 Dec 2025 | 0.75% | 102.94 | 103.81 | +0.85% | 104.59 (+1.60%) |
| 16 Jun 2026 | 1.00% | 113.21 | 113.30 | +0.08% | 112.05 (-1.02%) |
| 18 Sep 2026 | 1.25% | 110.76 | 112.42 | +1.50% | pending |
Source: ECB reference rates via api.frankfurter.dev, AUD base, JPY quote, retrieved 22 Sep 2026. Decision dates from Bank of Japan statements.
Only one of five hikes knocked the cross down on the day, and that was July 2024, when the hike landed on a crowded, leveraged market that unwound through the following week. Since then the pattern has flipped: Tokyo tightens, the yen weakens. Friday's +1.5% was the largest decision-day gain in the set.
For readers holding a longer frame, the 2007 comparison matters. The ECB-derived cross peaked at 107.46 on 20 July 2007, at the height of the pre-crisis carry boom. It first fixed above that level on 1 July 2024 and has lived above it for most of 2026. Our USD/JPY forecast covers the dollar leg of the same yen story. The cross is the purer read on carry because it strips out the Federal Reserve.
Tokyo's ¥27 trillion answer
If the BoJ will not defend the yen with rates, the Ministry of Finance has shown it will do so with reserves. Its releases record ¥11.73 trillion of dollar sales on 30 April, 4 May and 6 May, then ¥15.40 trillion more in the four weeks to 26 August. The daily breakdown for the second tranche comes with the quarterly release. Between 29 June and 29 July the ministry did nothing.
The first operation worked for about a week. The AUD/JPY fix fell from 114.45 on 29 April to 111.91 on 30 April, a 2.2% drop. By 7 May it was back at 113.49.
The second tranche bought less. It coincided with the late-July slide, but the cross made its record fix of 114.89 on 28 August, two days after the period the ministry reported. Intervention is sold dollars, bought yen. It hits AUD/JPY only through the dollar-yen leg and does nothing about the Australian rate.
Masu drew the line between the two institutions plainly in Fukui on 10 September. "Foreign exchange policy falls under the jurisdiction of the government, and the Bank does not set its policy interest rate to respond directly to changes in foreign exchange rates," said Kazuyuki Masu, Member of the Policy Board at the Bank of Japan. He added in the same passage that "the impact of the yen's depreciation on prices has become more pronounced than in the past and warrants close attention."
That second sentence is the hawkish seed in an otherwise gradual BoJ. If imported inflation from a weak yen pushes core CPI "clearly above 2 percent," which the Bank's own attachment projects from the second half of fiscal 2026, the gradualism ends. Masu's own framing treats central bank intervention by the ministry and rate policy as separate tools. On that reading the ministry's next monthly release, expected around month-end on the pattern of the 31 July and 28 August releases, is the more immediate risk to the cross.
Sydney meets on 28 September, and it matters more than Tokyo
The BoJ's next move is months away on any reading of Friday's vote. The RBA's is six days away. That asymmetry is the core of the bull case.
Governor Michele Bullock gave the House of Representatives economics committee a clear hint on the same day the BoJ hiked. "Developments since then suggest that although growth in the Australian economy is slowing, some of these upside risks to inflation appear to be materialising," said Michele Bullock, Governor of the Reserve Bank of Australia, referring to the risks the Board flagged in August. On firms passing on higher input costs she warned that if those effects become embedded, "inflation could prove more persistent and require a stronger policy response."
The August statement already carried the tightening bias. The Board said it would do what was necessary "including increasing the cash rate target further if upside risks materialise." A month later the Governor told Parliament those risks appear to be materialising. A fourth 2026 hike to 4.60% would take the differential back to 3.35 points, exactly where it stood before Friday, and erase the BoJ move in a single meeting.
There are brakes on the Australian side, and they belong in any honest forecast. Housing prices have fallen in most capital cities and new housing loans have declined. Labour market conditions have eased a little more than expected, per the August statement. The Board held in June and again in August, when it said it wanted to assess how the economy is evolving after three hikes. A hold next week with a hawkish statement is at least as likely as a move, and a hold with softer wording would let air out of the cross quickly.
For the dollar-bloc context, our AUD/USD forecast tracks the Australian leg against the Fed, which hiked to 3.75% to 4.00% on 16 September.
How this carry trade breaks
The bear case does not need Japan to hike faster. It needs holders to want out at the same time. July 2024 is the template: a modest BoJ hike to 0.25% met positioning that was too long, and the cross lost 4.6% in five fixes.
Three triggers could do it again. The RBA's August minutes described the unwinding of highly leveraged positions in some AI-related equities, and a broader equity drawdown would hit the Australian dollar as a risk currency while pulling yen home. The Middle East conflict, which both central banks cite as the main source of their inflation problem, has a resolution scenario that drops oil and removes the RBA's reason to stay tight. And a third Ministry of Finance operation, sized like the first, could be timed into thin liquidity for maximum effect.
Watch the level, too. The cross topped out at 114.50 on 27 April, 114.54 on 27 July and 114.89 on 28 August. Three failures inside half a yen make that zone resistance. A break of the 109.78 fix low of 3 August would signal that the carry bid has gone. Readers comparing yen crosses can see how we framed the same risk in GBP/JPY and EUR/JPY, where the differential is narrower and the cushion thinner. The mechanics of the carry trade are the same across all of them. AUD/JPY simply pays the most.
RelatedGBP/AUD Forecast: 1.9600 Bull Case vs 1.8400 Bear Case
The call: AUD/JPY to 31 December 2026
Spot for this forecast is 112.16, the CNBC AUD/JPY quote at 06:41 UTC on 22 September, with the ECB reference fix of 21 September at 112.25 as the daily anchor.
Base case, 50%: 113.00 at year-end, inside a 109 to 115 range. The RBA holds or hikes once, the BoJ stays on hold until at least January, and the 3.10-point differential keeps paying. The 114.89 record gets retested, and the ministry's presence near 115 caps it. The base level sits 0.75% above spot.
Bull case, 25%: 118.00. The RBA hikes to 4.60% on 29 September and signals more, oil stays high enough to keep the BoJ gradual, and risk assets hold up. A clean break above 115 would leave no nearby fix history as resistance. 118.00 is 5.2% above spot.
Bear case, 25%: 104.00. A leveraged unwind in equities, a ceasefire that drops oil and lets the RBA pause for good, or a large intervention on a thin day. 104.00 takes the cross back to where it traded when the BoJ went to 0.75% in December. That is 7.3% below spot, a wider band than the bull case because unwinds move faster than carry accrues.
Net, the tilt is modestly bullish with low conviction: the probability-weighted year-end level is about 112, and the edge in the base case comes from the carry, not from price. Our reference entry is 112.16, the working target is a retest of 115.00, and the case is invalidated by a daily fix below 108.50, which would put the cross under its August low with room to run.
What would change my mind: a BoJ Summary of Opinions for September showing more members than Masu pushing for speed, or a Japanese core CPI print clearly above 2%. Either would bring the next hike forward to October and flip the base case lower. On the other side, an RBA hike with guidance for another would push the bull probability above the base.
AUD/JPY forecast: frequently asked questions
Why did AUD/JPY rise when the Bank of Japan raised rates?
The BoJ hike to 1.25% cut the carry by 25 basis points, but two of nine Board members voted for no change and the Bank gave no timetable for the next move. The market read that as a slow path. The RBA had already added 75 basis points in 2026, so the differential of 3.10 points stays wider than the 2.85 points on 1 January.
Is AUD/JPY at a record high?
On the ECB-derived daily reference cross, the 114.89 fix of 28 August 2026 is the highest since the series began in 1999, above the 107.46 peak of July 2007. Intraday dealer quotes can print higher; CNBC shows a 52-week high of 114.99. At 112.16 on 22 September the cross is about 2.3% below that record fix.
Has Japan intervened to support the yen in 2026?
Yes. Ministry of Finance releases show ¥11.73 trillion of dollar sales on 30 April, 4 May and 6 May, and ¥15.40 trillion between 30 July and 26 August. None took place from 29 June to 29 July. The first tranche knocked the AUD/JPY fix down 2.2% in a day, but the cross recovered within a week and set its record after the second.
When is the next RBA decision and why does it matter for AUD/JPY?
The RBA Monetary Policy Board meets on 28 and 29 September. Governor Bullock told Parliament on 18 September that upside inflation risks appear to be materialising. A hike to 4.60% would take the AUD/JPY rate differential back to 3.35 points, fully offsetting the BoJ move. A hold with softer language would weaken the carry case.
What level would invalidate the bullish tilt?
A daily fix below 108.50. That would put AUD/JPY under the 109.78 fix low of 3 August and signal that holders are exiting the carry trade rather than collecting it. The bear case at 104.00, roughly the December 2025 level, becomes the working scenario if that break coincides with an equity drawdown or another large intervention.
Disclaimer
This article is analysis and opinion, not investment advice or a recommendation to trade any instrument. Forex and CFD trading carries a high risk of loss because of leverage, and you can lose more than your initial deposit with some providers. Past price behaviour, including reactions to central bank decisions, does not predict future results. Your capital is at risk.