

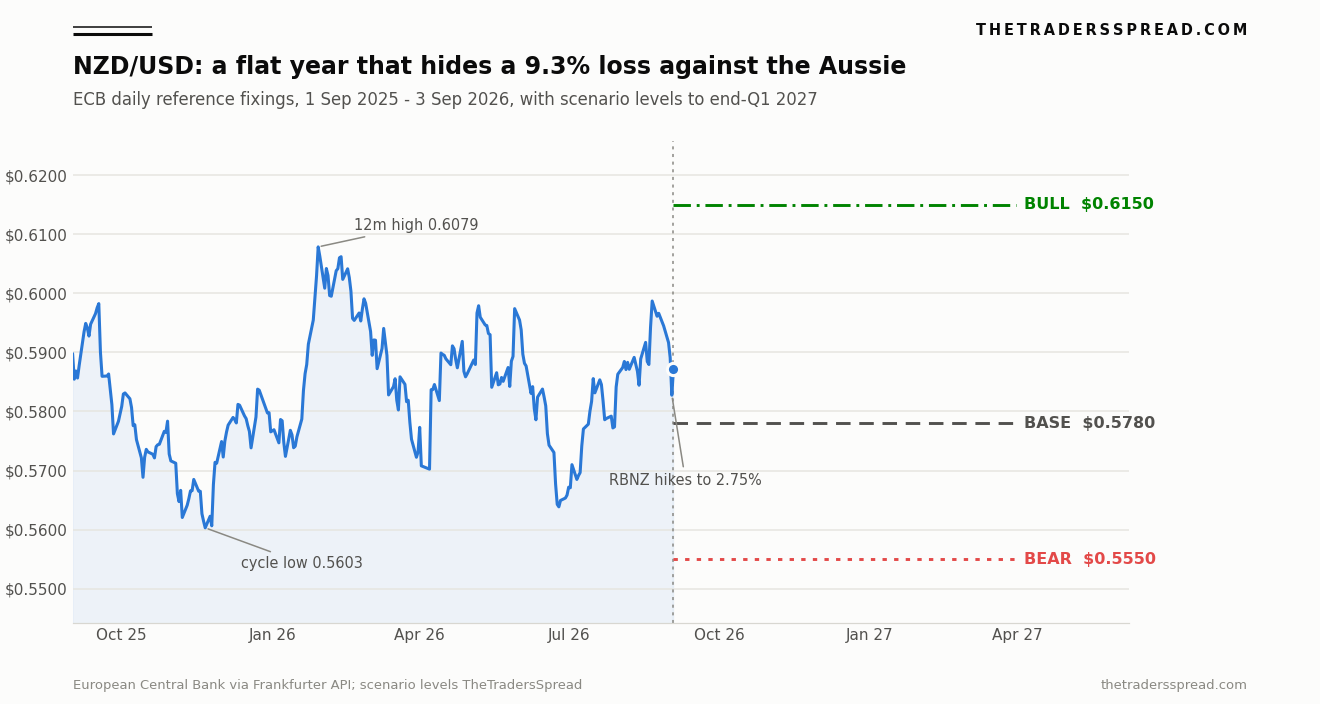
Having tracked NZD/USD since the Reserve Bank of New Zealand was still cutting toward 2.25%, the number I keep returning to is not the price but the distance travelled to get back to it. On 1 September 2025 the pair fixed at 0.58979. On 3 September 2026 it fixed at 0.58721. In between sat an oil shock out of the Middle East, an inflation spike to 4.1%, a 3-3 split vote at the Reserve Bank, and two rate hikes. The net move over twelve months is 26 pips, or minus 0.44% (European Central Bank reference fixings, retrieved via the Frankfurter API on 4 September 2026). As I write, the live quote on Swissquote's public feed is 0.58828 bid / 0.58832 ask, timestamped 08:20 UTC on 4 September 2026.
A flat year is not a quiet year.
Here is what the flatness is hiding. Over those same twelve months the New Zealand dollar fell 9.34% against the Australian dollar, from 0.90042 to 0.81633. Over the same window AUD/USD rose 9.82%, from 0.65501 to 0.71932. Those are my own calculations from the ECB fixing series, and they say something the NZD/USD chart cannot: the kiwi has been in a sustained, one-directional decline against the currency it is most often traded alongside, and the only reason that decline is invisible in the dollar pair is that the dollar was falling at almost exactly the same rate. Two large moves, opposite signs, near-identical magnitude, netted out into a straight line. If the US dollar stops falling, the netting stops, and what is left is the kiwi leg on its own.
Key facts
- NZD/USD live quote 0.58828 / 0.58832, 08:20 UTC 4 September 2026 — Swissquote public BBO feed, retrieved this session
- ECB daily reference fixing 0.58721 for 3 September 2026, a once-daily fix rather than a tradable tick — European Central Bank via Frankfurter
- RBNZ Official Cash Rate raised 25bp to 2.75% on 2 September 2026, a second consecutive hike — RNZ, 2 September 2026
- Federal funds target range 3.50%–3.75%, unchanged since the 17 June 2026 meeting; next decision 15–16 September — Federal Reserve
- RBA cash rate 4.35%, held on 11 August 2026, leaving Australia 160 basis points above New Zealand — ABC News, 11 August 2026
- New Zealand unemployment 5.6% in the June 2026 quarter, up from 5.4%, the highest in eleven years — Stats NZ, 5 August 2026
- GDT Event 411 on 1 September 2026 lifted the price index 0.9%, a fourth straight rise, at an average winning price of US$3,910 per tonne — HighGround Dairy
The hike that made the kiwi cheaper
On 2 September the Monetary Policy Committee raised the OCR to 2.75%. The kiwi fell.
That is not the paradox it looks like. Markets had already priced the hike, and had gone further, pricing a faster sequence and a terminal rate somewhere near 3.5%. What arrived instead was a materially unchanged OCR track and language about gradualism. The committee wrote that "the committee judges that gradually removing monetary stimulus is appropriate to return inflation to the 2 percent target mid-point while supporting growth and employment," and that guidance did the damage. On the ECB fixings the pair went from 0.58910 on 1 September to 0.58275 on 2 September, a drop of 0.64 US cents, before recovering to 0.58721 the following day.
Imre Speizer, New Zealand strategist at Westpac, called it "a slightly dovish hike" and told Reuters that "markets expected maybe a higher track and the market pricing was well above the track anyway." His read on the sequencing was blunt: "Our arithmetic implies no-go in October, but a December hike." The two-year swap rate fell three basis points to 3.7001% on the day even as longer maturities pushed to five-month highs, which is the shape you get when a curve prices less near-term tightening and more eventual inflation.
The inflation picture behind the decision is genuinely two-handed. Headline CPI ran at 4.1% in the June quarter, 2.1 percentage points above the top of the band, almost all of it imported through fuel after the conflict in the Middle East. Strip vehicle fuels out and the committee's own arithmetic gives a very different answer: "Excluding vehicle fuels, annual CPI inflation decreased to 2.9 percent in the June quarter. Most measures of core inflation are within the 1 to 3 percent target band." A central bank hiking against a shock it describes as temporary, in an economy it describes as recovering unevenly, is a central bank with limited appetite for a long sequence.
Jarrod Kerr, chief economist at Kiwibank and a long-standing opponent of tightening into a soft domestic economy, was content with the outcome. "We like it," he told RNZ. "Given where we've been, and where we're likely to go, slightly lower interest rates that don't move above a neutral setting, is good news." He expects one further move to 3% and then a long pause. Mark Smith, senior economist at ASB, reads the same statement more hawkishly: "We expect 25 basis point hikes in October to 3.0 percent and December, with the OCR ending the year at 3.25 percent, which we adjudge to be at broadly neutral levels."
What the Antipodean spread says that NZD/USD does not
New Zealand and Australia get traded as one bet more often than either deserves. This year that habit has cost people money, because the two central banks are 160 basis points apart and moving on different clocks. The RBA has been sitting at 4.35% since well before the RBNZ started hiking; Governor Michele Bullock's framing on 11 August was "we're staying put, but staying put with a very clear focus on watching how the data come in," with the door explicitly open to further increases. The RBNZ, meanwhile, has climbed 50 basis points from 2.25% and is still 160 short of Australia.
AUD/NZD closed at 1.2250 on 3 September. Its twelve-month range is 1.1102 to 1.2265. The cross is sitting 15 pips off a one-year high and above every fixing it printed between June and August, a window in which it averaged 1.2076.
The comparison below makes clear that NZD/USD is the least informative of the three prices involved.
| Measure (4 September 2026) | New Zealand | Australia | United States |
|---|---|---|---|
| Policy rate | 2.75% | 4.35% | 3.50%–3.75% |
| Last move | +25bp, 2 Sep 2026 | Hold, 11 Aug 2026 | Hold, 29 Jul 2026 |
| Next scheduled decision | October 2026 | 29 Sep 2026 | 15–16 Sep 2026 |
| Currency vs USD, 12 months | −0.44% | +9.82% | n/a |
| Two-year market rate | 3.70% (swap, 2 Sep) | n/a | 4.34% (Treasury, 3 Sep) |
Readers who followed our AUD/USD forecast will recognise the asymmetry immediately. That piece was written about a currency sitting 160 basis points above New Zealand on policy, with a domestic economy the RBA still describes as tight. The kiwi has neither. Treating the two as a single Antipodean expression of dollar direction is precisely the trade that lost 9.34% on the cross over the last year.
Price the cross first, then decide separately what the dollar does. NZD/USD collapses two independent judgements into a single number that tells you neither.
Where the two-year gap actually sits
Carry is the mechanism most retail commentary on this pair gets wrong, because it looks at the policy rate rather than the market rate.
New Zealand's two-year swap printed 3.7001% on 2 September, per Reuters. The US two-year Treasury yield closed at 4.34% on 3 September, according to the US Treasury daily par yield curve. Those are not identical instruments, so the exact gap is arguable. The sign is not. At the two-year point, New Zealand pays roughly 60 basis points less than the United States, even after two consecutive RBNZ hikes.
Now run the same comparison across 2026. The US two-year yield was 3.47% on 2 January and 4.34% on 3 September, a rise of 87 basis points. The OCR over the same period rose 50 basis points, from 2.25% to 2.75%. New Zealand tightened, and still went backwards relative to the United States at the tenor that actually drives a six-month currency view. That is the cleanest explanation for why the pair has not fixed above 0.6000 since 18 February 2026. Three rallies since then stalled at 0.59789 in May, 0.59740 at the start of June and 0.59869 in late August, each of them short of the handle.
The US calendar therefore carries more weight over the next fortnight than the New Zealand one. The FOMC meets on 15–16 September with a fresh Summary of Economic Projections attached; the RBNZ does not reconvene until October. A dot plot that ratifies the front-end pricing embedded in that 4.34% two-year yield does more to the pair than anything Wellington is scheduled to say.
The dairy floor almost nobody prices
Dairy is the input a generic forecast page skips, and it is the one genuinely New Zealand-specific variable in the pair. Fonterra's farmgate milk price feeds directly into rural cash flow, regional spending, and the export receipts that anchor the terms of trade.
The GlobalDairyTrade auction on 1 September, Event 411, lifted the GDT price index 0.9%. That was the fourth consecutive increase. The average winning price came in at US$3,910 per tonne across 157 registered bidders, 115 of whom won product. Whole milk powder, the contract that dominates the farmgate calculation, slipped 0.1% to US$3,585 per tonne. Skim milk powder rose 5.3% to US$3,695. Cheddar fell 6.6% to US$3,503.
The composition matters more than the headline. A 0.9% index gain built on a flat whole milk powder price and a strong skim milk powder print is a stabilisation signal, not a rally signal. It came after a three-auction slump in July that pushed Fonterra to trim its opening 2026/27 farmgate forecast midpoint to NZ$9.25 per kilogram of milksolids, and the four-auction recovery since has put a floor under that number rather than lifting it.
Four consecutive auction gains have not stopped the kiwi falling against the Aussie. That tells you the terms-of-trade channel is currently being overwhelmed by the rate channel, which is exactly the condition under which a dairy improvement fails to show up in the exchange rate. It is also why I would treat any sharp GDT decline as more dangerous to the bear case than a GDT rally is helpful to the bull case: the market is already ignoring the good news, so only bad news carries information.
What the consensus misses
Consensus positioning around this pair runs on a straightforward chain: the RBNZ is hiking, therefore the kiwi appreciates. Three things break that chain.
The first is the labour market. Unemployment reached 5.6% in the June quarter, up from 5.4% in March and the highest reading in eleven years. A central bank tightening into an eleven-year high in unemployment is tightening on borrowed time.
The second is that New Zealand's second-quarter GDP has not been published yet. It is due later this month. Every major bank forecast a contraction: Westpac at minus 0.1% quarter on quarter, BNZ at minus 0.2%, ASB at minus 0.3%. The RBNZ raised rates on 2 September into a quarter it cannot yet see the national accounts for, and the committee's own words concede the point when they describe growth in that quarter as "lacklustre." If the print lands at the weak end, the October meeting becomes a very different conversation.
The third is China. Second-quarter GDP grew 4.3% year on year, the weakest since late 2022 and below the 4.5%–5% official target, with the shortfall concentrated in domestic demand while exports surged. New Zealand's export book is weighted toward exactly the part of the Chinese economy that is soft: food, protein, consumer staples. An export-led Chinese recovery that leaves household consumption flat is not a recovery New Zealand gets paid for. Compare that with the transmission we described in our USD/CAD forecast, where the commodity channel runs through energy and reacts to a different Chinese variable entirely.
None of that makes the bull case impossible. It makes it conditional, and the condition is a weaker US dollar rather than a stronger New Zealand economy. Our EUR/USD forecast and our USD/JPY forecast set out that dollar view in more detail; the kiwi is a high-beta expression of it, not an independent bet.
RelatedNZD/CHF Forecast: 0.4790 Bull Case vs 0.4560 Bear Case
The call: base, bull and bear to end-Q1 2027
Spot reference for everything below is 0.58830, the Swissquote mid at 08:20 UTC on 4 September 2026. Realised volatility on the ECB fixing series runs at 8.2% annualised over twelve months and 7.4% over the last three, so the ranges below are wide relative to recent behaviour by design.
Base case, 45%: 0.5700–0.5950, drifting toward 0.5780 by end-Q1 2027. The RBNZ delivers one more hike, most likely in December rather than October, and stops near 3.00%. The Fed holds or delivers a single move. The two-year gap stays negative for New Zealand, the dairy floor holds without improving, and the pair keeps stalling short of 0.6000 as it did in May, June and August. Under this path nothing dramatic happens and the kiwi simply loses a little more ground on the crosses while looking stable against the dollar.
Bear case, 33%: 0.5550. This needs two of three. New Zealand's Q2 GDP prints at or below minus 0.3%, pushing the October meeting to a hold and collapsing the December hike out of the curve. Or the September FOMC dot plot ratifies the 4.34% two-year yield, widening the gap further. Or a GDT auction breaks the four-event recovery and puts Fonterra's NZ$9.25 midpoint back under review. The level itself sits below the 21 November 2025 cycle low of 0.56031, so reaching it requires a genuine break rather than a range extension.
Bull case, 22%: 0.6150. The path runs through Washington, not Wellington. It needs the US front end to reprice lower, which closes the two-year gap without New Zealand doing anything, plus the ASB track proving right and the OCR reaching 3.25% by December. Technically it has to clear 0.5987, then the 0.60785 high of 29 January, then the 0.6092–0.6119 resistance cluster mapped by ActionForex on 31 August. Sustained dairy strength through the spring auction calendar would make the move easier but is not sufficient on its own.
What would change my mind. A close above 0.6000 that holds for a full week would tell me the correlation with the US front end has broken; at that point the bear weighting comes off. On the other side, an AUD/NZD break above 1.2265 with the RBA on hold would tell me the market is pricing an RBNZ pause before the data confirms it, and I would move the bear probability above the base case. A Q2 GDP print at or above zero would push me toward the ASB track and lift the bull weighting by roughly ten points.
Frequently asked questions
What is the current NZD/USD rate?
The live quote on Swissquote's public feed was 0.58828 bid and 0.58832 ask at 08:20 UTC on 4 September 2026. The European Central Bank's daily reference fixing for 3 September was 0.58721. The two differ because the ECB rate is a once-daily fixing published for reference and accounting purposes, not a tradable price, so it will not match a broker quote at any given moment.
Why did the New Zealand dollar fall after the RBNZ raised rates?
The 25 basis point hike to 2.75% on 2 September was fully priced before the meeting, and markets had gone further, pricing a terminal rate near 3.5%. The RBNZ published a broadly unchanged OCR track and emphasised gradualism. Rate expectations were revised down rather than up, and the currency followed the expectations, not the headline decision.
How does the RBNZ compare with the RBA right now?
The RBNZ's Official Cash Rate is 2.75% after two consecutive hikes. The RBA's cash rate is 4.35% and has been on hold since 11 August 2026. That 160 basis point gap in Australia's favour is the main reason the New Zealand dollar has lost 9.34% against the Australian dollar over the past twelve months while barely moving against the US dollar.
Does the GlobalDairyTrade auction move NZD/USD?
It can, though the channel is currently weak. GDT Event 411 on 1 September lifted the index 0.9%, a fourth straight gain, yet the kiwi has continued to underperform on the crosses. Dairy sets the terms of trade and Fonterra's farmgate payout, so a sustained slump would matter, but interest rate differentials are dominating the exchange rate at present.
What are the key technical levels on NZD/USD?
On ActionForex's 31 August read of the intraday series, support sits at 0.5849, the 38.2% retracement of the 0.5625 to 0.5987 leg, with the November 2025 fixing low of 0.56031 beneath it. Resistance runs 0.5987, then 0.5993, then a cluster at 0.6092–0.6119. The pair has not fixed above 0.6000 since 18 February 2026.
What is the next scheduled event for the pair?
The FOMC meets on 15–16 September 2026 with an updated Summary of Economic Projections, and New Zealand's June quarter GDP is due later in September. The RBNZ does not meet again until October, immediately before the general election, with a final 2026 decision in December. Over the next fortnight the US calendar carries more weight for this pair than the New Zealand one.
Disclaimer
This article is analysis and information only. It is not financial advice, an offer, or a recommendation to transact in any currency, instrument or product. Scenario levels, probabilities and invalidation points describe how this desk frames a market, not what any reader should do. Foreign exchange and CFD trading carries a high risk of loss and capital is at risk.