

GBP/JPY lost 7.72 yen in five trading sessions. The cross fixed at 216.72 on 1 September 2026 and at 209.00 on 8 September, a fall of 3.56%, and over exactly those five sessions sterling did not weaken at all: GBP/USD went from 1.3531 to 1.3546, a rise of 0.11%. The entire move came from the other leg, where USD/JPY dropped 3.66% from 160.16 to 154.30. Both series are European Central Bank reference rates, retrieved from frankfurter.dev on 9 September 2026. What that arithmetic means is simple and slightly uncomfortable for anyone holding this pair as a view on Britain. In the first week of September, GBP/JPY was not a sterling instrument. It was a yen instrument wearing a sterling label, and the label had stopped carrying information.
That is measurable, and the measurement is worse than the anecdote suggests. Decomposing the daily log returns of GBP/JPY into its two component legs over the twenty sessions to 8 September, the USD/JPY leg accounts for 91.4% of the cross's realised variance and the GBP/USD leg for 8.6%. The correlation between GBP/JPY and USD/JPY daily returns over that window is 0.91; against GBP/USD it is 0.21. Widen the window and the sterling content grows back, but only slowly: 16.3% over sixty sessions, 26.1% over the full year. A trader who models this cross as a British asset with a Japanese funding cost has the weights inverted. For the present regime it is a yen position with a sterling coupon attached, and the coupon is the part about to get smaller.
Key facts
- GBP/JPY fixed at 209.00 on 8 September 2026, inside a twelve-month range of 197.83 (2 October 2025) to 219.14 (16 July 2026) — ECB reference rates via frankfurter.dev, retrieved 9 September 2026.
- Bank Rate has been 3.75% since December 2025; the MPC held 6–3 on 29 July 2026, with Megan Greene, Catherine L Mann and Huw Pill voting to raise it to 4% — Bank of England, 30 July 2026.
- The Bank of Japan's policy rate is 1.00%, lifted from 0.75% in June 2026, and Kyodo reported on 8 September that the Bank plans 1.25% at its 17–18 September meeting.
- Japan's Ministry of Finance spent a record ¥15.4 trillion (about $98bn) supporting the yen between 30 July and 26 August 2026, after a coordinated operation with the United States on 31 July — CNBC, 3 September 2026.
- Large speculators lifted net-short yen exposure by 29,900 contracts to 92,200 by Tuesday 1 September — Matt Simpson, StoneX, 7 September 2026.
- UK CPI ran at 2.9% in July 2026, up from 2.6% — ONS, 19 August 2026. Japan's headline rate was 1.9%, its highest of the year — CNBC, 21 August 2026.
- Twenty-session realised volatility in GBP/JPY was 3.3% annualised on 1 September, the lowest of the past twelve months, and 8.8% two sessions later — desk calculation on ECB reference rates.
Two air pockets, both stamped in Tokyo
GBP/JPY has fallen through a trapdoor twice in six weeks, and neither time did anything happen in Britain.
The first was 31 July into 3 August. The cross went 218.15, 215.06, 211.05 across three fixes, and the cause was on the record within hours: Washington joined Tokyo in buying yen. A Reuters photograph from 31 July showed US Treasury Secretary Scott Bessent's notepad reading "Buy Japanese Yen (JPY) $5-10 bil." The Ministry of Finance then kept going alone, and its published total for the month to 26 August came in at ¥15.4 trillion, the largest four-week defence of the yen ever recorded. The previous record, ¥11.73 trillion in the month to 27 May, had already been set this year. Two records inside one summer is not a policy of last resort. It is a policy.
The second trapdoor was 2–3 September, and it was not intervention. On 3 September GBP/JPY fell 2.17% in a single session, the largest one-day move in the pair in twelve months, on a day when the Ministry of Finance appears to have been absent. Takuji Okubo, chief economist at Japan Macro Advisors, told CNBC that a stealth operation of that size would be out of character: "I do not think [the Ministry of Finance] has done this kind of small stealth intervention in recent history. So it is probably just a reaction to BOJ Governor Ueda's comment cementing the high likelihood of a BOJ rate hike in September." Chris Turner, global head of markets at ING, read it the same way from the plumbing, citing "the lack of dislocation in the FX electronic matching systems at the time."
The distinction matters for anyone carrying this cross into the second half of September. Intervention is a level defence: it spends reserves to buy time and it decays. A repricing of the Bank of Japan's terminal rate changes the discount factor that holds GBP/JPY at 209 rather than 190, and it does not decay. Board member Hajime Takata said on 2 September that the Bank should move "nimbly" against rising inflation, hinting at a cadence faster than its recent semiannual pace. Japan's vice finance minister for international affairs, Atsushi Mimura, said the same week that authorities were "neither satisfied nor reassured" and "remain on a state of heightened alert." One official was talking about the price. The other was talking about the rate. Only the second changes what this pair is worth.
The differential is shrinking. The volatility is not.
Strip the narrative away and GBP/JPY is a spread trade with a variance problem.
The gross policy-rate differential is 275 basis points: Bank Rate at 3.75%, the BoJ at 1.00%. Set that against what the pair actually does. Twenty-session realised volatility closed at 9.0% annualised on 8 September, which puts the carry-to-volatility ratio at 0.31. In the first half of this year, with the BoJ still at 0.75% and twelve-month realised volatility running at 7.5%, the same ratio was 0.40. If the Bank of Japan delivers 1.25% on 18 September and volatility stays where it is, the ratio drops to 0.28. The position gets thinner from both ends at once, which is not how carry trades normally die. Usually the funding leg tightens while the asset leg cuts. Here both central banks are leaning the same way and the question is only which one leans harder.
| Window | Policy gap | Realised vol (annualised) | Gap ÷ vol |
|---|---|---|---|
| H1 2026 (BoE 3.75% / BoJ 0.75%) | 300 bp | 7.5% | 0.40 |
| 8 September 2026 (3.75% / 1.00%) | 275 bp | 9.0% | 0.31 |
| If BoJ moves to 1.25% on 18 September | 250 bp | 9.0% | 0.28 |
Policy rates from the Bank of England and Bank of Japan; realised volatility computed on ECB reference rates via frankfurter.dev, 9 September 2026. The gross policy gap is not the realised roll, which depends on tenor and venue. Retail rollover on a cross like this is usually a good deal worse, and worth reading off a broker's published swap schedule: our Eightcap review found a firm that publishes none at all.
There is a second reading of the volatility number that is easy to get backwards. On 1 September the twenty-session window printed 3.3%, the quietest GBP/JPY has been in a year, and plenty of desks would have logged that as a shift toward calm. It was an artefact. The window had rolled past the 3 August intervention gap, and the fortnight it then contained was the flattest of the summer. Two sessions later a single 2.17% day pushed the same measure to 8.8%. Nothing in the underlying distribution improved between 25 August, when the reading was 9.2%, and 1 September, when it was 3.3%. A twenty-day window on a pair whose risk arrives in discrete two-yen jumps measures whether the last jump has aged out, not how much risk is left.
Who was on the other side on 1 September
The positioning data gives that week a shape.
In the Commitments of Traders report published on 7 September, StoneX market analyst Matt Simpson recorded that large speculators had increased net-short yen exposure by 29,900 contracts, to 92,200, by the Tuesday. That is the biggest short in months, assembled in the days immediately before the yen's sharpest rally of the year. The same report noted the first increase in net-short sterling exposure among large speculators and asset managers in five weeks. Both legs of GBP/JPY were being sold by the same cohort in the same week.
Read that alongside the 3.3% volatility print and the picture is uncomfortably tidy. Maximum short yen, minimum measured risk, on the same day, at 216.72. Forty-eight hours later the pair was 6.15 yen lower.
None of this claims that positioning predicts direction. It does not, and the same data has been short yen for most of a decade while the yen weakened. What it does say is that the marginal buyer of GBP/JPY at 217 was leveraged, that the marginal seller at 210 was the same account closing out, and that the pair's downside is a liquidity event rather than a valuation adjustment. Our GBP/USD forecast made the opposite argument three days before this move: cable's problem was that nothing was happening at all, with realised volatility at 3.8%. That diagnosis has held. Cable moved 0.11% while the cross moved 3.56%.
Thirty hours in September
The Monetary Policy Committee announces at noon London time on Thursday 17 September. The Bank of Japan announces on Friday 18 September. The two decisions that set this cross land inside about thirty hours of one another, for the first time this cycle, and the market's confidence in the two is wildly asymmetric.
Sterling side: less than four basis points of tightening is priced into 17 September, roughly a 15% chance of a move, with 24.3 basis points priced by the 17 December announcement and 36 by 4 February. The three dissenters from July are still there. August CPI lands at 7am on Wednesday 16 September, the morning before the vote, and July's print had already climbed to 2.9% from 2.6%. The Committee's July language was that it "stands ready to act as necessary to ensure that CPI inflation remains on track to meet the 2% target in the medium term." That commits to nothing in either direction.
Yen side: as of the morning of 3 September, investors were pricing a 98% chance of a Bank of Japan increase. Japan's inflation is the awkward part of that case. Headline ran at 1.9% in July, core at 1.8%, core-core at 1.9%, all below target, with the subsidy programme run by Prime Minister Sanae Takaichi's administration holding the number down. Wholesale inflation was 7.2% in the same month, electricity charges the largest contributor. Krishna Bhimavarapu, APAC economist at State Street Investment Management, argued the rise to 1.9% "strengthens our conviction that the BOJ's next move is likely to be a rate hike in September." The Bank has said core inflation should accelerate "clearly above" 2% from the second half of its 2026 fiscal year.
Then a gap. Japanese markets close for three days straight after the meeting for the Silver Week holidays, and Deutsche Bank analysts flagged those thin conditions as exactly where an intervention would be most efficient. A hike, a holiday and a market on intervention watch does not produce orderly two-way trade in a yen cross.
Britain's own dated risk sits further out. Chancellor John Healey delivers his first Budget on 28 October alongside an Office for Budget Responsibility forecast. That is the most plausible route by which the GBP/USD leg starts mattering to this cross again.
What is 209.00 actually worth?
The chart below sets the last twelve months of GBP/JPY against the three scenario levels this desk is working to.
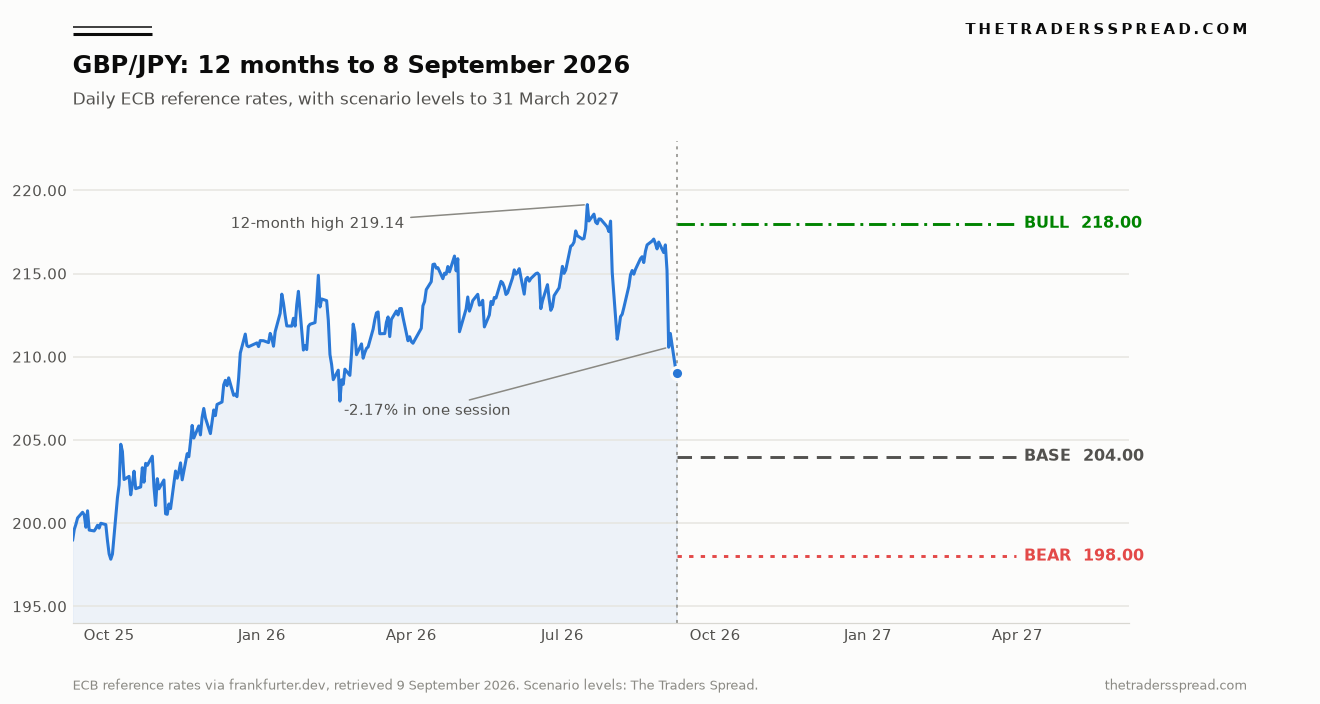
Now the longer lens, because a twelve-month range flatters this pair badly. Across the 2,558 daily ECB fixes from 9 September 2016 to 8 September 2026, GBP/JPY averaged 163.54 and its median was 153.31. Spot at 209.00 sits at the 93rd percentile of that decade. Take only the pre-2022 portion, before the Bank of Japan's differential blew out, and the average is 143.34. The pair is 46% above the level at which it traded through the years when the policy gap was small.
That premium is not a mispricing to be arbitraged, and no honest read says the cross should return to 143. It is the capitalised value of a rate differential that has been large and stable. What it establishes is what holds 209 up, and therefore where the sensitivity sits: a cross trading 46% above its own structural average on the strength of a 275 basis point gap has a lot of price attached to each basis point, and the gap is now moving in one direction for the first time in four years. Our USD/JPY forecast from late August argued that the dollar leg's fate rested on whether Washington picked up the phone a second time. It did, and USD/JPY has since traded through the 157.50 base case in that piece.
RelatedGBP/NZD Forecast: 2.42 Bull Case vs 2.24 Bear Case
Year-to-date, the pair has done nothing. It fixed at 210.96 on 2 January and 209.00 on 8 September, down 0.93%, having been up 3.9% in mid-July. All the drama has been round-trip, which is what a carry trade looks like in the months before it stops working: the level holds while the cost of holding it rises.
The call
Base case, 204.00 (48% probability). The Bank of Japan delivers the 25 basis points that are already priced, the Monetary Policy Committee holds 6–3 or 7–2, and the differential compresses to 250 basis points without either committee producing a surprise. GBP/JPY grinds down 2.4% from 209.00 over the next two quarters as the roll gets thinner and the realised volatility of holding the position stays near 9%, with the summer lows around 211 becoming resistance rather than support. Horizon: 31 March 2027.
Bear case, 198.00 (30% probability). A test of the 197.83 low of 2 October 2025, 5.3% below spot. The path is a Bank of Japan that moves faster than semiannually, as Takata has suggested it should, combined with the Ministry of Finance using the Silver Week holiday window. Add a soft UK August CPI on 16 September that removes the three hawks from the MPC's arithmetic, and both legs push the same way. This is the scenario in which the 91.4% variance share stops being a curiosity and becomes the whole story.
Bull case, 218.00 (22% probability). A return to the 16 July high area, 4.3% above spot. Two things have to happen. The BoJ hike is fully discounted at 98%, so the meeting itself is a sell-the-fact risk for the yen, and a hike delivered with dovish guidance about the pace would unwind a crowded long-yen trade that was built in a week. Then sterling has to contribute something of its own: a hot 16 September CPI print converting the July dissenters into a majority, or a 28 October Budget the gilt market reads as disciplined.
What would change my mind. Two triggers. If the twenty-session correlation between GBP/JPY and GBP/USD returns rises back above 0.50 while the correlation with USD/JPY falls below 0.70, the pair has re-acquired a sterling identity and every level here needs rebuilding around UK data. Separately, if the Bank of Japan holds on 18 September against a 98% market, the repricing runs the other way hard and 218.00 becomes the near-term magnet rather than the ceiling. Neither trigger is a level. Both are relationships, which is the right way to invalidate a call on a cross.
Frequently asked questions
What is the GBP/JPY rate right now?
GBP/JPY fixed at 209.00 on 8 September 2026, using European Central Bank reference rates retrieved via frankfurter.dev. That is 5.05% above the 198.96 fix of 9 September 2025 and 4.63% below the twelve-month high of 219.14 set on 16 July 2026. The twelve-month low is 197.83, from 2 October 2025.
Why did GBP/JPY fall so sharply in early September 2026?
Because the yen leg moved. Between 1 and 8 September the cross fell 3.56% while GBP/USD rose 0.11%; USD/JPY fell 3.66% over the same window. The driver was a repricing of Bank of Japan expectations after comments from Governor Kazuo Ueda and board member Hajime Takata, with markets moving to price a September increase at 98%.
Is GBP/JPY still a carry trade?
The gross policy-rate gap is 275 basis points, so the carry is real, but it is compressing. It was 300 basis points before the Bank of Japan moved to 1.00% in June 2026 and would be 250 after a September increase. Measured against twenty-session realised volatility of 9.0%, the gap-to-volatility ratio has fallen from 0.40 earlier this year to 0.31.
What are the key dates for GBP/JPY in September 2026?
UK August CPI at 7am on 16 September; the Bank of England decision at noon on 17 September; the Bank of Japan decision on 18 September, followed by three days of Japanese market closure for Silver Week. Further out, the UK Budget on 28 October 2026 is the first dated sterling-specific risk of the autumn.
Does Japanese intervention set a floor under the yen?
It sets a cost, not a floor. Japan spent a record ¥15.4 trillion between 30 July and 26 August 2026 and the yen's largest single-session gain of the year came afterwards, on a day when the Ministry of Finance was probably not in the market. As Chris Turner of ING put it, a sustainable rise in the yen "now probably requires a much more hawkish Bank of Japan and some new initiatives to encourage domestic investment in Japan."
Disclaimer
This article is analysis and information, not financial advice, and nothing in it is a recommendation to buy or sell any instrument. Foreign exchange trading carries a high risk of loss. Prices quoted are European Central Bank reference rates retrieved on 9 September 2026 and will have moved since. Capital is at risk.