

The first thing I open on a cotton morning is not a chart. It is the USDA Daily Spot Cotton Quotations PDF, because the back page prints the ICE settlements next to what gins in Lubbock and Memphis are actually being paid, and the gap between those two numbers tells me more than any candle. This morning's copy, dated 22 September, has December cotton settling at 82.87 cents per pound, down 0.55 on the day, while the seven-market average spot price sits at 77.69 cents, a basis of 517 points under the board. Eleven days ago the US Department of Agriculture cut the American crop by 3% and its ending stocks by 10%. On any desk I have worked, a cut like that is a bullish report. December has fallen 6.1% since the close the evening before it. When a supportive number meets a falling price, the question stops being about weather and starts being about who already owns the contract.
The answer sits in the Commodity Futures Trading Commission's data, and it is the piece of this story that most cotton coverage skips. On 3 March, managed money held a net short of 74,199 contracts in ICE No. 2 cotton. By 1 September that had flipped to a net long of 100,963, a swing of 175,162 contracts in six months. The funds had bought the drought, the smaller acreage and the world stock drawdown well before USDA wrote any of it down. After the peak, the selling has been shallow: the 15 September report shows 91,935 contracts net long, so only about 9% of the length has left while price has fallen 11% from its high. That is the overhang this forecast turns on.
- ICE December 2026 cotton settled at 82.87 cents per pound on 22 September, down from 83.42 the session before — USDA AMS Daily Spot Cotton Quotations, 22 Sep 2026
- USDA cut 2026/27 US production 3% to 13.20 million bales and ending stocks 10% to 3.60 million, with stocks-to-use at 26.1% versus 28.8% in August — WASDE, 11 Sep 2026
- Managed money moved from 74,199 contracts net short on 3 March to 100,963 net long on 1 September, then 91,935 net long on 15 September — CFTC disaggregated futures-only report, 15 Sep 2026
- Only 34% of the 15-state US crop was rated good to excellent in the week to 20 September, and 52% of the Texas crop was rated poor or very poor — USDA NASS Crop Progress, 21 Sep 2026
- Total US export commitments for 2026/27 reached 4.50 million bales by 10 September, 36.6% of USDA's 12.30 million bale export forecast — USDA AMS Weekly Cotton Market Review, 18 Sep 2026
- The Far Eastern A Index stood at 94.35 cents on 17 September, 12.18 cents over that day's December settlement of 82.17 — USDA AMS Weekly Cotton Market Review, 18 Sep 2026
Who bought the cotton rally before USDA priced it
Positioning is the first section here because it explains a price path that the fundamentals alone cannot. Look at the CFTC's disaggregated numbers week by week and the rally has two distinct phases.
From early March to mid-May, the move was a short squeeze. Managed-money shorts fell from 116,510 contracts on 3 March to 22,973 by 19 May, while their longs only roughly doubled, from 42,311 to 82,638. Covering did most of the lifting. The continuous front-month contract, which printed a closing low of 61.06 cents on 6 February, was above 84 cents by the start of May.
The second phase, from July into the end of August, was different. Shorts were already small, so the funds had to add fresh length. Managed-money longs went from 60,588 on 30 June to 115,804 on 1 September. Open interest rose from 305,708 to 383,730 over the same stretch. New money, not covering, carried the front month to its 31 August closing high of 93.14 cents.
Fresh length behaves differently from covered shorts. A short who covers is gone. A long who bought at 88 or 90 cents is still in the market, and every rally back toward those prices meets a seller who wants out flat.
The commercial side of the ledger shows who sold them that length. Producers, merchants, processors and users held 218,402 short contracts on 15 September against 51,999 long, a net short of 166,403. On 3 March the same category was net short 33,200. Merchants and growers have spent the summer hedging an expensive crop into a market that paid them to do it, and that hedge pressure does not go away because the crop got smaller. A smaller crop at a higher price still needs to be sold forward.
John Robinson, Professor and Extension Economist at Texas A&M AgriLife Extension, reads the smaller-scale positioning signals as friendlier than the headline fund number. In his Cotton Marketing Planner summary for the week to 11 September he wrote: "The recently falling certified stock levels could reflect improving commercial demand for U.S. cotton." He also noted that unfixed call sales had risen past unfixed call purchases, which he treats as mill buying still waiting to be priced. That is real, and it is one reason the bear case below stops at 72 cents rather than lower.
December cotton price data, the chart and the spread that matters
The chart below uses CNBC's continuous front-month series for shape, so the early months reflect the March 2026 contract and later months roll forward to December. The anchor print, 82.87 cents on 22 September, comes from the ICE settlement table that USDA's Agricultural Marketing Service republishes each trading day, and CNBC's own previous-close field matched it to the cent when I checked at 07:25 UTC today. Overnight trade on ICE had December at 82.80, 0.07 lower.
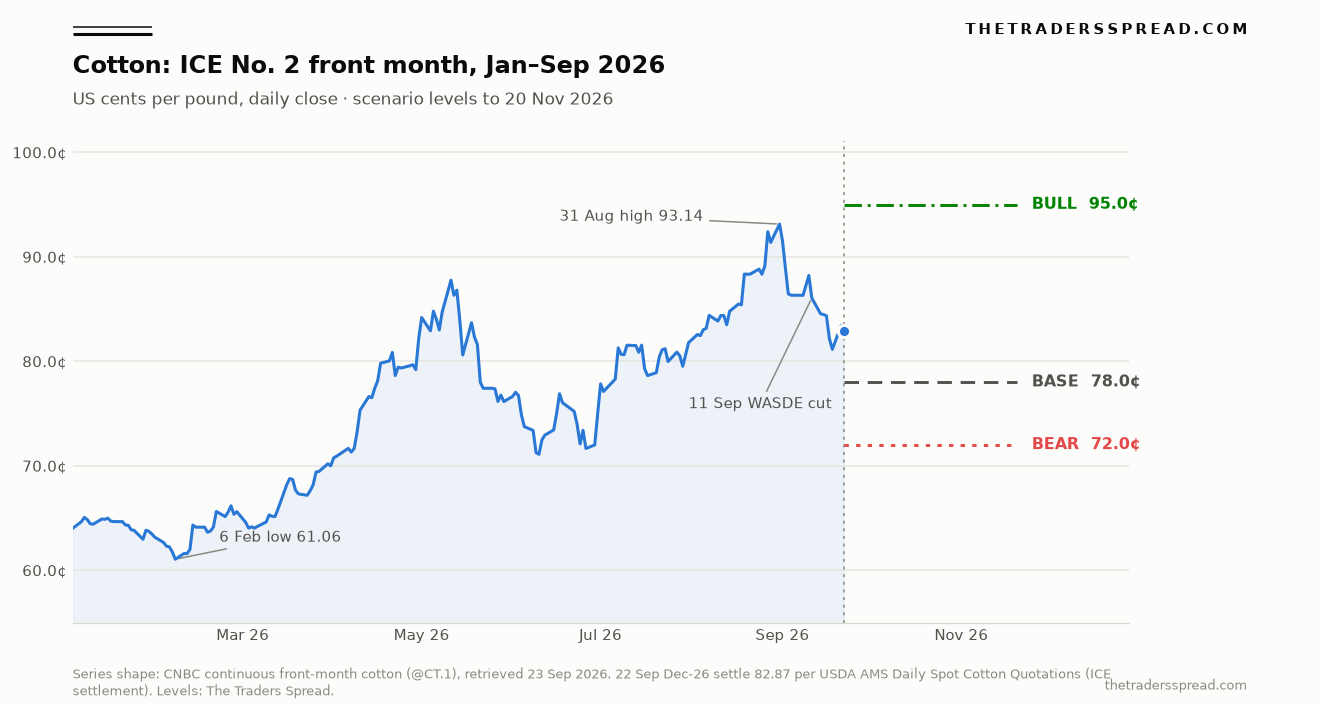
Using only the December 2026 contract removes the roll noise. On 13 January, USDA's report showed December 2026 settling at 69.29 cents. Against Tuesday's 82.87 that is a gain of 19.6% for the contract that will price this year's harvest. The front-month continuous series overstates the move, at 52.5% from the February low to the August high, because it stitches together contracts trading at different carry.
| Measure | Reading | Date | Source |
|---|---|---|---|
| ICE Dec-26 settlement | 82.87¢ | 22 Sep 2026 | USDA AMS |
| ICE Dec-26 settlement | 69.29¢ | 13 Jan 2026 | USDA AMS |
| 7-market average spot (41-4-34) | 77.69¢ | 22 Sep 2026 | USDA AMS |
| Spot basis to December | -517 points | 22 Sep 2026 | USDA AMS |
| Far Eastern A Index | 94.35¢ | 17 Sep 2026 | USDA AMS, Cotton Outlook |
| Adjusted World Price | 68.92¢ | 18 to 24 Sep 2026 | USDA FSA via AMS |
| USDA 2026/27 season-average farm price | 78¢ | 11 Sep 2026 | WASDE |
Two readings in that table pull against each other. The A Index, the benchmark for cotton delivered to Far Eastern mills, sat 12.18 cents over December futures on 17 September. That premium says international buyers are paying up for cotton, which is supportive for US prices over time. The Adjusted World Price, the Farm Service Agency's loan-programme number, is 68.92 cents, and with the loan deficiency payment at zero, the marketing-loan programme offers growers nothing at today's prices. A grower marketing 2026 cotton is exposed to the full distance between 82 cents and whatever the market decides the Texas crop is worth.
The 517-point negative basis matters too. In January the same seven-market spread was 371 points. A wider discount of spot to futures in a short-crop year is unusual, and I read it as merchants protecting themselves against the fund length on the board: they will pay the futures price minus a thick cushion, because they doubt the futures price.
Brazil's cotton exports are the counterweight USDA keeps raising
US cotton does not set the world price alone anymore. The September WASDE projects Brazil's 2026/27 production at 18.50 million bales and its exports at 15.50 million, both raised from August. The United States is projected at 13.20 million bales of production and 12.30 million of exports. On USDA's numbers, Brazil will ship 3.2 million bales more than America this season.
That is why the world balance sheet looked softer on 11 September than the US one. USDA took global production down by about 300,000 bales to 117.32 million, as cuts for the United States, Turkey and Pakistan outweighed gains in Brazil, the African Franc Zone and Kazakhstan. Yet world ending stocks were raised about 170,000 bales to 69.86 million because beginning stocks were revised higher. Across the year the picture is still tightening: world stocks fall from 75.31 million to 69.86 million bales, a 7.2% draw, with consumption steady at 122.92 million bales. Month on month, though, the number moved the wrong way for the bulls on the same day the US number moved their way.
For a mill in Vietnam or Bangladesh, a smaller Texas crop is a sourcing problem only if Brazilian and West African cotton cannot fill it. At a 15.50 million bale export programme, Brazil can fill a lot. Readers following the Brazil harvest across other ICE softs will recognise the pattern from our coffee coverage after StoneX raised its Brazil estimate: when the Southern Hemisphere delivers, US supply scares fade faster than the charts suggest.
Texas is losing its crop in real time
The bull case is not invented. It sits in the fields around Lubbock.
USDA's National Agricultural Statistics Service rated only 14% of the Texas crop good and 1% excellent in the week to 20 September. Seventeen percent was very poor and 35% poor. Oklahoma was worse on the poor line, at 60%. Across all 15 reporting states the good-to-excellent share slipped from 36% to 34% in a week, and the poor-to-very-poor share climbed from 34% to 35%. A year ago the same week showed 47% good to excellent. Harvest was 13% complete against an 11% five-year average, and in Texas it was 29% done, which means more of the damaged cotton is being stripped and weighed each week before USDA's October update.
Robinson's own reading of the regional reports was direct. "The latter descriptions support anecdotal evidence that the cotton crops in northwestern Texas are being damaged by current dryness and heat," he wrote in the same 11 September summary, adding that the rain had fallen over the eastern half of the Cotton Belt, "but still little where it is most needed in northwestern Texas."
USDA's September yield was 776 pounds per harvested acre, down from 798 in August and 852 a year earlier. Harvested area was cut to 8.16 million acres. If the Texas condition ratings are telling the truth, the October report has room to take the national yield lower again, and every 10 pounds per acre on 8.16 million harvested acres is roughly 170,000 bales. A cut toward 750 pounds would pull production near 12.75 million bales and ending stocks toward the low 3 millions.
Jack Scoville, Vice President at The Price Futures Group, pinned Monday's bounce on exactly that and one more factor. "Cotton was higher yesterday on stressful weather seen recently and on hopes for new demand from China due to the summit this week," he wrote in his Softs Report of 22 September. His chart levels for December put support at 80.40, 79.20 and 77.80 cents, with resistance at 84.00, 85.30 and 85.60.
What would break the bearish lean
Three things would make me wrong quickly, and they are worth stating before the numbers, because they are the reasons conviction here is low.
The first is exports. Net sales of 71,200 bales in the week to 10 September followed a week that Robinson described as improved "but nevertheless pretty poor", and total commitments at 36.6% of the full-year forecast leave a long way to run. A run of weekly sales above 200,000 bales would say the A Index premium is finally pulling business toward US origin, and it would reverse my read on the basis.
The second is China. A trade outcome that puts Chinese mills back into US cotton at scale would change the demand side of a balance sheet that currently assumes flat exports. I have no primary document on what, if anything, the summit Scoville mentions will produce, so it is a risk rather than an input.
The third is the October WASDE. The US grain desk saw what a USDA surprise can do in soybeans after the record crop estimate, and cotton is more exposed than most crops to a single-state revision. A production number at 12.5 million bales or lower would put stocks-to-use near 21% and bring the 93.14 high back into range.
The call: base 78, bull 95, bear 72 by 20 November
This forecast runs to 20 November 2026, ahead of the December contract's delivery period, and every level is measured against the 82.87-cent settlement of 22 September.
Base case, 50%: December trades down to about 78 cents. That is 5.9% below the settle and matches USDA's own 78-cent season-average farm price. The route is slow fund liquidation into a harvest that is running ahead of pace, with merchants still hedging and export sales only middling. Scoville's 79.20 and 77.80 supports would be tested.
RelatedEU Carbon Price Rises to €82.32 on the Q3 CBAM Print
Bull case, 20%: 95 cents. That is 14.6% above the settle and above the front month's 93.14 closing high and 93.74 intraday high from 31 August. It needs the October report to cut Texas hard enough to take production toward 12.5 million bales, plus evidence of export demand. With funds already long, a new high needs new buyers, so this is a lower-probability scenario even though the crop story supports it.
Bear case, 30%: 72 cents. That is 13.1% below the settle, back to the June congestion zone where the front month found support twice. It happens if the managed-money length that has barely moved starts to leave in size. At 91,935 net long, a return to the roughly 30,000 net long of late June would mean selling around 60,000 contracts into a market where commercials are already short.
The lean is bearish, with a conviction of 2 out of 5. The invalidation is a December close above 88.50 cents, which would take out the 88.22 close from 10 September, the last settle before USDA's report, and would tell me the market has accepted the smaller crop at higher prices rather than fading it.
What would change my mind before that level: a CFTC report showing managed money adding length on a down week, weekly export sales above 200,000 bales, or a NASS rating for Texas deteriorating past 60% poor to very poor. Any two of those together and I would move to neutral.
For readers building a wider view across the row crops, our corn price prediction works from the same WASDE release, and the sugar price prediction covers the other ICE soft where Brazil sets the marginal barrel.
Cotton price FAQ
What is the current cotton price?
ICE No. 2 cotton for December 2026 delivery settled at 82.87 cents per pound on Tuesday 22 September, according to the ICE settlement table in USDA's Daily Spot Cotton Quotations. Overnight trade had it at 82.80 at 07:15 UTC on 23 September. The US seven-market average spot price for base-quality cotton was 77.69 cents on 22 September.
Why did cotton fall after USDA cut the US crop?
USDA cut production 3% on 11 September, yet December closed that day 2.16 cents lower. Funds had already built a net long of 100,963 contracts by 1 September, so the supportive news was priced in. Buyers were exhausted, and the report gave existing longs a reason to take profit rather than a reason to add.
What is the bull case for cotton?
The bull case of 95 cents rests on the Texas crop. With 52% of Texas cotton rated poor or very poor on 20 September, USDA's October report could cut national yield below September's 776 pounds per acre. Production near 12.5 million bales, combined with stronger export sales or Chinese buying, could push December past the front month's 93.74 high from 31 August.
What is the bear case for cotton?
The bear case of 72 cents assumes managed money unwinds its remaining 91,935-contract net long. Commercial hedgers are already net short 166,403 contracts, export commitments stood at 36.6% of USDA's forecast on 10 September, and Brazil is projected to export 15.50 million bales, which gives mills a ready alternative to US origin.
How does Brazil affect cotton prices?
On USDA's projections Brazil is the largest cotton exporter. USDA puts 2026/27 Brazilian exports at 15.50 million bales against 12.30 million for the United States. When Brazilian supply is ample, a smaller US crop tightens the US balance sheet without tightening the world one to the same degree, which caps how far ICE futures can rally on American weather alone.
When is the next major cotton catalyst?
The next USDA World Agricultural Supply and Demand Estimates report in October is the main scheduled catalyst, because it will carry the first yield update after most of the Texas damage has been assessed. Weekly NASS crop condition ratings on Mondays, CFTC positioning on Fridays and weekly export sales on Thursdays fill in the gaps before that release.
Disclaimer: This article is market analysis and commentary for information only. It is not investment advice or a recommendation to trade any instrument. Futures and CFDs are leveraged products and you can lose more than your initial capital. Past price behaviour does not predict future results. Scenario levels and probabilities reflect the author's judgement as of 23 September 2026 and may change without notice.