

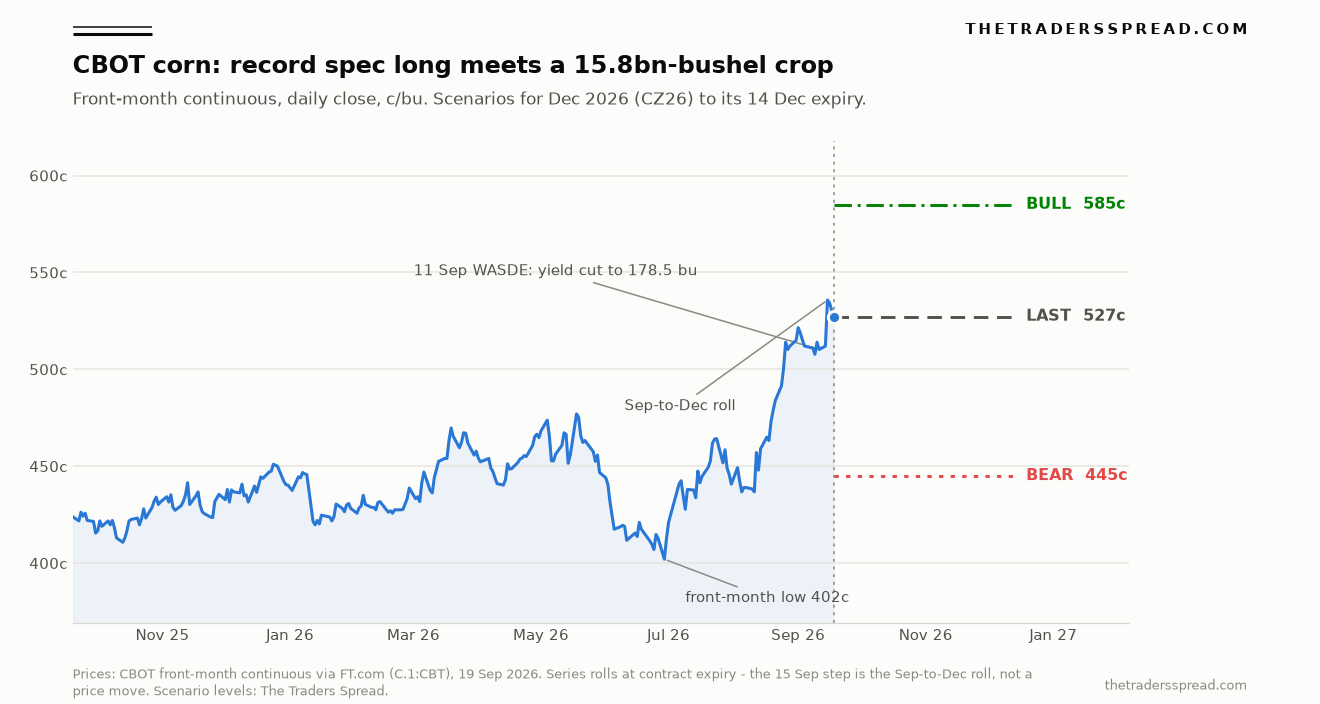
The question the corn market is actually pricing is not whether the 2026 US crop got smaller. USDA settled that on 11 September. The live question is whether 1.567 billion bushels of carryout is tight enough to keep the largest speculative long in the history of the contract solvent through harvest. Corn closed Friday 18 September at 527.25 cents a bushel on the December 2026 contract, down 3.25 cents on the day, with 942,310 contracts of open interest still standing. That price sits 30.6% above the contract's June low and 4.1% below the high it made on 2 September. Both of those facts matter, and they point in opposite directions. One says the fundamental case worked. The other says it stopped working two weeks ago, while the money kept arriving.
Here is the part that is not in the commentary. The Commodity Futures Trading Commission's disaggregated report for 15 September puts managed money net long 414,460 contracts of CBOT corn. That is the largest net long in the entire disaggregated series, which begins on 13 June 2006 and now runs to 1,058 weekly observations. No week in twenty years has been bigger. And it was built after the price stopped making highs: the December contract peaked at 549.75 cents on 2 September, and managed money added a further 13,457 contracts net between 1 and 15 September while the contract gave back 22.5 cents. The position topped out later than the price did. That sequencing, not the balance sheet, is the risk in December corn.
Key facts
- December 2026 corn settled at 527.50 cents a bushel on Friday 18 September, last trade 527.25, on volume of 168,498 — CNBC exchange quote, read 06:55 UTC 19 September 2026
- Managed money net long 414,460 contracts as of 15 September, a record in a series starting 13 June 2006 — CFTC Disaggregated Commitments of Traders, released 18 September 2026
- 2026/27 US corn production cut 213 million bushels to 15.800 billion on a 2.2-bushel yield reduction to 178.5 bu/acre — WASDE-675, 11 September 2026
- Ending stocks lowered 86 million bushels to 1.567 billion, taking stocks-to-use to 9.68% from 11.52% a year earlier — WASDE-675, 11 September 2026
- Season-average farm price raised 30 cents in a single month to $4.80 a bushel — WASDE-675, 11 September 2026
- US corn rated good or excellent at 57% on 13 September, against 67% a year earlier; poor or very poor nearly doubled to 17% — NASS Crop Progress, released 14 September 2026
- Ethanol output 1,099 thousand barrels a day for the week ended 11 September, unchanged on the week — EIA weekly series, released 16 September 2026
What the September WASDE actually did to the balance sheet
The September report was a supply cut that USDA only half paid for on the demand side. Production fell 213 million bushels to 15.800 billion, almost all of it from yield: 178.5 bushels an acre against 180.7 in August, with harvested area shaved fractionally to 88.5 million acres. Beginning stocks came down 23 million bushels as well, on a larger export figure for the season just closed. Against that, USDA lowered total use by 150 million bushels, taking feed and residual down to 5.950 billion.
Exports were left alone at 3.275 billion bushels. Ethanol grind was left alone at 5.600 billion.
That combination is what produced the number the market traded. Ending stocks of 1.567 billion bushels against 16.180 billion of use puts stocks-to-use at 9.68%. A year ago the same ratio was 11.52%, and in 2024/25 it was 10.25%. So the US corn balance sheet tightened by 184 basis points in twelve months, and the entire tightening arrived in one report. USDA's own response was to raise the season-average price received by farmers by 30 cents to $4.80 a bushel, a large single-month revision by the standards of a forecast that normally moves in nickels.
The world picture moved the same way and by less. Global 2026/27 ending stocks came down to 272.10 million tonnes from 274.66 in August. Strip out China, whose stocks are not commercially available to anyone, and the number is 106.97 million tonnes against 124.23 million a year earlier, a 13.9% drawdown. Foreign production fell on India, Kenya and Russia, partly offset by the European Union. None of that is an emergency. It is a genuinely tighter year arriving after two loose ones, which is a different thing.
The position that got built on the way down
Corn's open interest on 15 September was 1,843,824 contracts. Managed money held 483,738 long and 69,278 short. The net, 414,460 contracts, is 2.07 billion bushels of notional corn, or roughly 13% of the crop USDA says the United States will harvest this autumn. It is a record, and the run into it was violent: net length went from 125,875 contracts on 11 August to 414,460 on 15 September, an increase of 288,585 contracts in five weeks.
The other side of that trade is the farm. Producers, merchants, processors and users were short 1,097,930 contracts against 327,624 long, so the commercial short alone accounted for 59.5% of all open interest. That is what a hedged 15.8-billion-bushel crop looks like when cash prices are the best they have been in two years and the bins are about to fill.
| CFTC report date | Managed money net (contracts) | Total open interest |
|---|---|---|
| 28 July 2026 | 126,776 | 1,736,827 |
| 11 August 2026 | 125,875 | 1,684,065 |
| 25 August 2026 | 317,448 | 1,707,706 |
| 1 September 2026 | 401,003 | 1,764,182 |
| 8 September 2026 | 414,459 | 1,803,323 |
| 15 September 2026 | 414,460 | 1,843,824 |
| 16 September 2025 | −81,497 | 1,529,796 |
Source: CFTC Disaggregated Commitments of Traders, futures only, CBOT corn contract code 002602, retrieved 19 September 2026 via the Commission's public reporting service.
Read the last two rows together. Twelve months ago the same cohort was net short 81,497 contracts. The swing is just under half a million contracts of directional length in a year, and the last two weekly readings are within one contract of each other, which is the signature of a position that has run out of buyers rather than one that is still being accumulated. Length that stops growing at a record while the underlying drifts lower is not a bullish confirmation. It is an inventory problem for the people holding it.
What the forward curve says about how long this lasts
Futures curves are opinion polls with money attached, and corn's is unusually legible right now.
| Contract | 18 Sep settle (c/bu) | Spread to prior month | Open interest |
|---|---|---|---|
| Dec 2026 | 527.50 | — | 942,310 |
| Mar 2027 | 541.50 | +14.00 | 394,356 |
| May 2027 | 548.25 | +6.75 | 160,065 |
| Jul 2027 | 551.00 | +2.75 | 165,606 |
| Sep 2027 | 522.50 | −28.50 | 62,161 |
Source: CNBC exchange quotes for CBOT corn contract months, settlement date 18 September 2026, read 06:55 UTC on 19 September 2026.
The old-crop months carry normally: 14 cents from December to March is storage and interest, and the carry then flattens into July as the market stops paying people to hold grain it will want. The informative number is the last one. September 2027, the first contract covering the 2027 harvest, settles 28.5 cents below July 2027. The market is saying plainly that it expects 2027 acres and 2027 yield to undo what 2026 did, and it is willing to sell that year at a discount today.
That view is not eccentric. A season-average farm price of $4.80 is a strong signal into the spring, corn competes for acres against a soybean crop that USDA has at a record, and the yield loss of 2026 was weather, not structural. Anyone underwriting the bull case in December corn is therefore underwriting a one-crop problem, priced by a curve that has already decided it is a one-crop problem. The trade has a clock on it.
What the field is actually reporting
NASS put the 2026 crop at 57% good or excellent on 13 September, down from 67% at the same point last year. Poor and very poor together reached 17%, against 9% a year earlier. The damage is regional and it is concentrated exactly where a bull would want it: North Dakota was 42% poor or worse, Colorado 50%, Kansas 35%. Illinois and Iowa, which carry the crop, were still respectable at 58% and 76% good-to-excellent.
Harvest itself is running slightly early. Eight per cent of the 18-state area was cut by 13 September against 7% a year ago and a 6% five-year average, with 42% of the crop mature versus a 38% norm. An early harvest into a record fund long is an awkward combination, because it front-loads the producer selling that has to clear before the market can find out what the crop really weighs.
On the demand side there is very little happening. EIA had ethanol production at 1,099 thousand barrels a day for the week ended 11 September, identical to the week before and inside the 956 to 1,196 band it has held all year. A grind that flat is why USDA felt able to leave the 5.600 billion-bushel ethanol number untouched while cutting everything else. Exports were also left unchanged at 3.275 billion bushels despite the smaller crop, which USDA attributed to steady demand rather than to any new buying. Neither leg of demand is currently doing anything the balance sheet has not already counted.
What consensus is missing, and what would prove it wrong
The consensus reading of September was simple: smaller crop, tighter carryout, higher price. It is correct as far as it goes, and December corn has already delivered on it, rising more than 30% from its June low. What that reading skips is that a fundamental case which is fully expressed in a record position is no longer an asset. It is a liability with a good story attached.
There is a real counterargument, and it deserves more than a sentence. Final yields have a habit of moving again. USDA's January Annual Crop Production report resurveys the crop after it is in the bin, and in a year with 17% of the crop rated poor or worse, the risk is genuinely two-sided rather than uniformly lower. If the final number lands near 174 or 175 bushels, another 250 to 300 million bushels come out of production, carryout heads toward 1.30 billion and stocks-to-use drops below 8.5%. That balance sheet does not trade at 527 cents. The complication is that January falls after the December contract expires on 14 December, so the December buyer is paying today for a report they will not be around to collect.
Three USDA WASDE reports land inside the contract's remaining life: 9 October, 10 November and 10 December. November is the one that carries weight, because it is the last full production estimate of the calendar year and the one that historically resets harvested-acreage assumptions. Between now and then the market has weekly Crop Progress, weekly export sales and a producer base that is 59.5% of open interest short and holding new-crop grain it has to move.
The call: 585 cents bull, 445 cents bear
Base case, and the most likely outcome at roughly 50%: December corn spends its remaining nine weeks between 490 and 545 cents without resolving anything. The balance sheet at 9.68% stocks-to-use justifies a price in the low 500s. The record long caps how much higher it can go without new information, and harvest selling caps how long it can stay near the top of that band. A market that has already moved 30% and then stalled for two weeks usually needs a fresh input, and the next one with real weight is 10 November.
Bull case, 585 cents, about 20%. This requires the October and November reports to keep cutting: yield toward 175, carryout under 1.40 billion, and an export programme that finally accelerates rather than merely holding. At 585 the contract would be 11% above Friday's close and 6.4% above its 2 September high, which means it would also need managed money to add to an already record position. That is possible. It is not the way to bet the base case.
RelatedAPI2 Coal Prediction: $150 Bull Case vs $85 Bear Case
Bear case, 445 cents, about 30%. Harvest confirms 178.5 or better, the November report stops cutting, and 414,460 contracts of net length start looking for the exit into a producer base that is already short 1.1 million contracts. A move to 445 would be a 15.6% decline and would still leave the contract 10% above its June low, so this is a position unwind rather than a collapse in the fundamentals.
What would change my mind: a December close above 550 cents. That is above the contract's 2 September high of 549.75, and it would mean the price is making new ground with the record long already in place, which breaks the divergence this whole argument rests on. On the other side, a weekly CFTC report showing managed money liquidating more than 75,000 contracts without the price breaking 500 would say the position is clearing in an orderly way and the balance sheet is holding the market up on its own.
For context on how the same USDA report landed elsewhere in the complex, see our coverage of the record 4.53 billion-bushel soybean crop, the competing feed-grain story in wheat's 43% year, and what cheaper feed has been doing to lean hog cash markets. Our approach to scenario levels on a cents-quoted contract is set out in the sugar prediction.
Frequently asked questions
Why quote the December 2026 contract rather than a continuous corn price?
Because the two are different instruments. A continuous front-month series splices contracts together at each expiry, and the September-to-December roll on 15 September created a 23.75-cent step that was not a price move at all. Every scenario level here is anchored to December 2026 itself, which settled at 527.50 cents on 18 September and expires on 14 December 2026.
What does 9.68% stocks-to-use mean in practice?
It is the ratio of ending stocks to total use, and it is the cleanest single measure of how much slack the balance sheet has. At 9.68%, the United States finishes the 2026/27 marketing year with about 35 days of demand in reserve. A year ago that figure was 11.52%. Tightening of that size in one report is what moved the season-average farm price forecast 30 cents in a month.
Is a record managed money long automatically bearish?
No. Records get broken, and positions can grow for months while prices rise. The signal here is narrower: the position reached its record after the price stopped making highs, and the last two weekly readings were within a single contract of each other. That combination describes a crowded trade with no marginal buyer, which is a different condition from a large position that is still expanding.
Which reports matter before the December contract expires?
USDA has confirmed WASDE releases on 9 October, 10 November and 10 December 2026. November carries the most weight because it is the last full production estimate of the year. Weekly NASS Crop Progress and weekly export sales fill the gaps, and the CFTC positioning data lands every Friday for the previous Tuesday.
Why are 2027 corn contracts trading below 2026?
September 2027 settled 28.5 cents under July 2027 on 18 September. That inversion at the crop-year boundary is the market's way of saying it expects the 2027 US crop to rebuild what 2026 lost, helped by a season-average price near $4.80 that pulls acres in next spring. The curve is pricing this as a single bad year, not a structural shortage.
How reliable is the September yield estimate?
Moderately. USDA revises yield through October and November and then resurveys the crop in the January Annual Crop Production report. With 17% of the crop rated poor or very poor on 13 September, against 9% a year earlier, the range of plausible final outcomes is wider than usual in both directions.
This article is analysis, not investment advice. Futures trading involves substantial risk and capital is at risk. Prices, positioning data and USDA estimates cited here were retrieved on 19 September 2026 and reflect the trading session of Friday 18 September 2026. Do your own research before acting on any market information.