

Having tracked the soybean crush margin through each of USDA's monthly supply reports this summer, I went into Friday's report expecting the yield number to decide the day. It did not. On 11 September the US Department of Agriculture raised its 2026 soybean crop to a record 4.535 billion bushels, trimmed projected ending stocks by 10 million bushels to 310 million and lifted its season-average farm price by 60 cents to $12.00 a bushel. November soybeans on the Chicago Board of Trade traded as high as $13.3525 during the session, a 52-week high for the contract, then settled at $12.965. That is a fall of 35.75 cents, or 2.68%, and the biggest one-day drop in CNBC's front-month series since 27 July. A report that cut stocks and raised USDA's own price forecast still produced a sharp fall. The reason sits inside the bean, not in the field.
Run USDA's own price forecasts through the standard crush arithmetic and soybean oil now supplies 50.7% of the value a processor extracts from a bushel, up from 44.3% in the 2024/25 marketing year. Biofuel will absorb 17.8 billion pounds of US soybean oil in 2026/27 on USDA's numbers, 53.8% of domestic use, while soybean oil exports shrink to 400 million pounds from 2.47 billion two seasons ago. Half of the bean now prices off fuel policy rather than food demand, and on Friday that half fell hardest: December soybean oil lost 3.11% against 1.15% for meal, even though USDA left its oil price forecast unchanged at 70 cents a pound.
Key facts
- USDA put 2026 US soybean production at a record 4.535 billion bushels, up 16 million from August, on a 52.8 bushel-per-acre yield — NASS Crop Production, 11 Sep 2026
- 2026/27 ending stocks were cut to 310 million bushels from 320 million, and exports raised by 25 million to 1.685 billion — WASDE-675, 11 Sep 2026
- The season-average farm price was raised $0.60 to $12.00 a bushel and the meal price $30 to $340 a short ton — WASDE-675, 11 Sep 2026
- November soybeans settled at $12.965, down 2.68% on the day, after touching $13.3525 — CNBC delayed quote, settlement 11 Sep 2026
- Front-month soybeans rose 14.0% in 21 sessions, from $11.6875 on 11 August to $13.3225 on 10 September — CNBC daily bars (@S.1), retrieved 13 Sep 2026
- China took 1.222 million tonnes of the 2.637 million tonnes of net 2026/27 US soybean sales in the week to 3 September — USDA FAS Weekly Export Sales, 28 Aug to 3 Sep 2026
- 58% of the soybean crop was rated good to excellent on 30 August, against 65% a year earlier — NASS Crop Production, 11 Sep 2026
What USDA changed on 11 September
The September World Agricultural Supply and Demand Estimates (WASDE-675) moved the US soybean balance sheet by small amounts in both directions. Harvested area rose 0.1 million acres to 85.9 million. The yield rose 0.1 bushel to 52.8. Together they added 16 million bushels of production. On the demand side, USDA left the crush at 2.78 billion bushels and raised exports by 25 million, which lifted total use by 26 million. Use grew faster than supply, so ending stocks fell.
| US soybeans, 2026/27 | August WASDE | September WASDE | Change |
|---|---|---|---|
| Area harvested (million acres) | 85.8 | 85.9 | +0.1 |
| Yield (bushels per acre) | 52.7 | 52.8 | +0.1 |
| Production (million bushels) | 4,519 | 4,535 | +16 |
| Crush (million bushels) | 2,780 | 2,780 | 0 |
| Exports (million bushels) | 1,660 | 1,685 | +25 |
| Ending stocks (million bushels) | 320 | 310 | -10 |
| Stocks-to-use | 7.0% | 6.8% | -0.2 pt |
| Season-average farm price ($/bu) | 11.40 | 12.00 | +0.60 |
Source: USDA WASDE-675, 11 September 2026. Stocks-to-use computed by The Traders Spread as ending stocks divided by total use.
A 6.8% stocks-to-use ratio is tighter than the 7.6% USDA now estimates for the 2025/26 year that ended on 31 August. On paper, that is a supportive report. USDA's own narrative says as much, describing "higher production and exports, and lower ending stocks compared to last month."
So why the fall? Futures had spent four weeks pricing a smaller crop than USDA delivered. The NASS Crop Production report released the same day records that 14 of 18 major states lost good-to-excellent ratings during August, that drought persisted through the northern and western Corn Belt, and that North Dakota had 29% of its soybeans rated poor or very poor. A market that bid November soybeans up 14% on that weather was positioned for a yield cut. It got a yield increase, and the part of the rally that rested on a smaller crop came out in one session.
Corn got the opposite treatment. USDA cut the corn yield 2.2 bushels to 178.5 and production by 213 million bushels to 15.8 billion, and raised its corn price forecast by 30 cents to $4.80. December corn still settled 0.66% lower at $5.3025. Both crops fell on the same day for different reasons: soybeans lost a weather premium, corn simply failed to extend its gains.
Fourteen per cent up, then 2.7% back
The chart shows CBOT soybeans from mid-March to Friday's settlement. The series is CNBC's continuous front-month contract, which ends on the November 2026 contract; each point is a daily settlement in dollars per bushel.
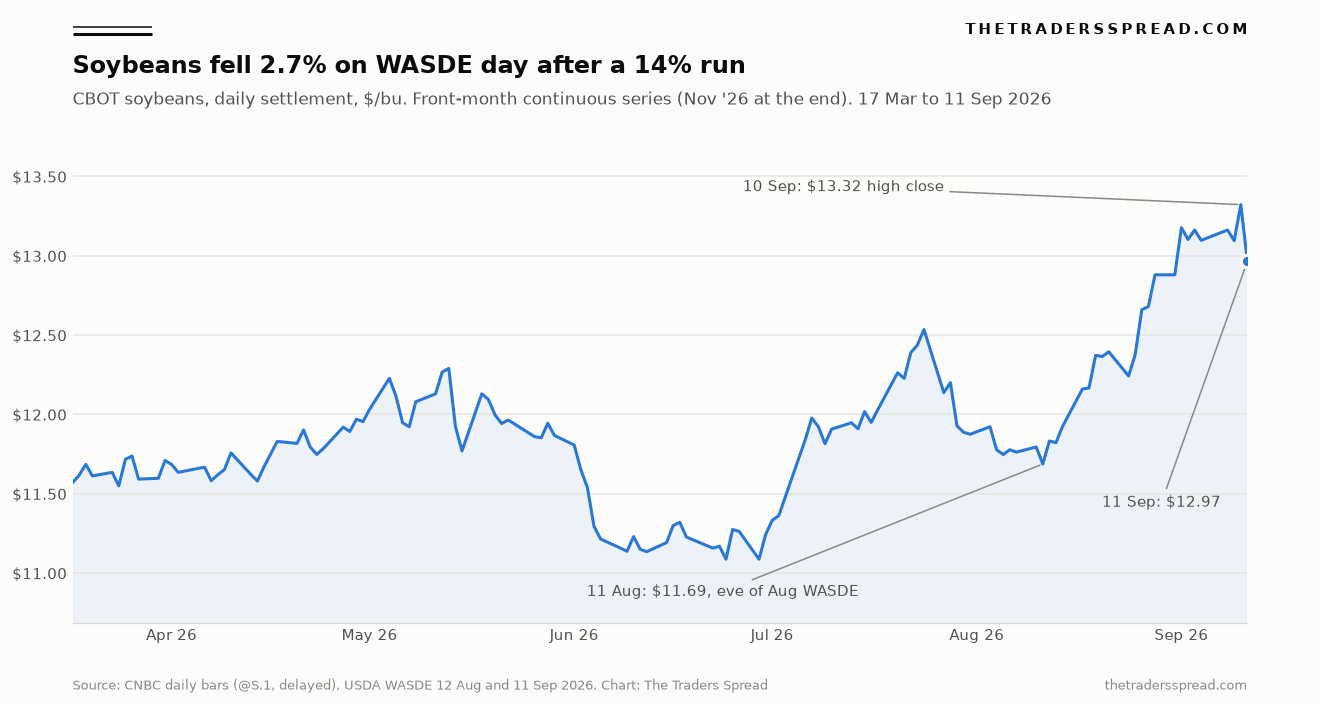
The shape is clear. A trough near $11.09 in late June gave way to a July rally, a pullback into the August report, and then the steepest leg of the year. From $11.6875 on 11 August, the eve of the August WASDE, the front month climbed to $13.3225 on 10 September. Friday opened at $13.30, touched $13.3525 and closed at $12.965.
| Window | Start | End | Change | Series |
|---|---|---|---|---|
| Friday session, 10 to 11 Sep | $13.3225 | $12.965 | -2.68% | Nov '26 settlement, CNBC |
| Aug WASDE eve to high close, 11 Aug to 10 Sep | $11.6875 | $13.3225 | +13.99% | CNBC front month (@S.1) |
| Aug WASDE eve to Friday, 11 Aug to 11 Sep | $11.6875 | $12.965 | +10.93% | CNBC front month (@S.1) |
| SOYB fund proxy, 11 Aug to 10 Sep | $24.92 | $28.14 | +12.91% | Teucrium Soybean Fund, shape only |
| SOYB fund proxy, 10 to 11 Sep | $28.14 | $27.50 | -2.27% | Teucrium Soybean Fund, shape only |
| Nov '26 52-week low to Friday, 1 Oct 2025 to 11 Sep | $9.9375 | $12.965 | +30.47% | CNBC quote, Nov '26 contract |
Sources: CNBC daily bars and delayed quote for @S.1 (retrieved 13 Sep 2026); stockanalysis.com SOYB history (retrieved 13 Sep 2026). Changes computed by The Traders Spread from the printed closes.
A continuous front-month series can hide contract rolls, which is why the table carries a second series. SOYB holds a spread of soybean futures rather than one contract, so its price level means nothing here. Its direction is the check. It rose 12.91% over the same 21 sessions and fell 2.27% on Friday, close enough to confirm that the run and the reversal were market moves rather than roll artefacts.
Friday's volume in the November contract was 245,874 lots on CNBC's quote, with open interest at 491,712. The products told a sharper story than the beans. December soybean oil settled at 69.68 cents a pound, down 3.11%, while December meal settled at $352.80 a short ton, down 1.15%.
Why soybean oil now carries half the bushel
A 60-pound bushel of soybeans crushes into roughly 44 pounds of meal and 11 pounds of oil. The board crush converts that into dollars: meal price per short ton times 0.022, plus oil price in cents per pound times 0.11, minus the bean price. What is left is the processor's gross margin per bushel before costs. Applying that formula to USDA's own season-average price forecasts gives a view of how the value of a soybean has shifted.
| Marketing year (USDA) | Beans $/bu | Meal $/st | Oil ¢/lb | Product value $/bu | Implied crush $/bu | Oil share of value |
|---|---|---|---|---|---|---|
| 2024/25 | 10.00 | 299.77 | 47.59 | 11.83 | 1.83 | 44.3% |
| 2025/26 estimate | 10.50 | 325.00 | 64.00 | 14.19 | 3.69 | 49.6% |
| 2026/27, August WASDE | 11.40 | 310.00 | 70.00 | 14.52 | 3.12 | 53.0% |
| 2026/27, September WASDE | 12.00 | 340.00 | 70.00 | 15.18 | 3.18 | 50.7% |
| CBOT board, Thu 10 Sep | 13.3225 | 356.90 | 71.92 | 15.76 | 2.44 | 50.2% |
| CBOT board, Fri 11 Sep | 12.965 | 352.80 | 69.68 | 15.43 | 2.46 | 49.7% |
Sources: USDA WASDE-675 (11 Sep 2026) and the August WASDE column it reprints; CBOT settlements for November beans and December meal and oil via CNBC. Crush arithmetic by The Traders Spread using 0.022 short tons of meal and 11 pounds of oil per bushel.
Two things stand out. First, oil's share of product value has moved from the mid-40s into a band around 50%, and USDA's September meal increase is the only reason it slipped back from 53.0% in August. Second, the board crush barely moved on Friday. Beans fell 35.75 cents; the combined meal and oil value fell 33.7 cents. Processors lost almost nothing, which suggests the selling was aimed at the raw bean and its weather premium rather than at crushing demand.
Behind the oil share sits a structural change in who uses American soybean oil. USDA's table puts biofuel use at 17.8 billion pounds for 2026/27, against 14.8 billion in 2025/26 and 11.758 billion in 2024/25. That is a 51% rise in two seasons. Exports, meanwhile, fall to 400 million pounds from 2.472 billion, an 84% drop. The US has almost stopped selling soybean oil abroad because domestic fuel producers take it first. The crush itself rises to 2.78 billion bushels from 2.445 billion two years ago, up 13.7%, and now outruns exports by more than a billion bushels.
For anyone reading soybean prices, this means the oil leg now carries information from the fuel market. We covered the distillate side of that market in our diesel price outlook, and the link runs both ways: demand from renewable fuel plants props up soybean oil, and weaker fuel margins drag it down. Friday's oil slide came with no change in USDA's oil price forecast, so the WASDE itself does not explain it.
China is booking US new crop, and Brazil still sets the pace
The export side of the balance sheet is where the September report added demand. USDA raised 2026/27 US exports by 25 million bushels, and the Foreign Agricultural Service's weekly export sales summary for 28 August to 3 September shows why. Net sales for the new marketing year, which began on 1 September, totalled 2,637,300 tonnes. China accounted for 1,222,000 tonnes of that, ahead of unknown destinations at 245,600 tonnes, Indonesia at 222,200 tonnes and Mexico at 169,300 tonnes. The same report lists a 530,000-tonne sale to China announced under the daily reporting system for the period ending 3 September.
The old crop tells a different story. Accumulated 2025/26 exports finished the year at 41,006,500 tonnes, down 18% from 50,105,900 tonnes the year before. USDA's WASDE puts the 2025/26 export total at 1.52 billion bushels, 19.7% below 2024/25. The new-crop forecast of 1.685 billion bushels would be 10.9% above the year just finished and still 10.9% below 2024/25.
Scale matters here. USDA projects world soybean exports of 191.58 million tonnes in 2026/27. Brazil is forecast to ship 118.0 million of them from a 186.0 million-tonne crop; the US ships 45.86 million. Brazil takes roughly 62% of world trade and the US about 24%. China's projected imports stay at 115.0 million tonnes, unchanged this month. A single week of Chinese buying is significant for US exporters, but it does not change who sets the global price in the first half of the year. Brazil's crop estimates have already moved other markets this month, as our coffee coverage showed.
The pod count problem nobody is pricing
The yield number that sank the rally may be the least settled figure in the report. NASS forecast 52.8 bushels an acre, which it says would be the second-highest on record. The same release, in its objective yield section, states that pod counts across the 11 major producing states are lower than a year ago: "Compared with final counts for 2025, pod counts are down in 8 of the 11 published States."
The state detail backs that up. Nebraska's September count is 1,890 pods per 18 square feet against a 2025 final of 2,171. Arkansas shows 1,674 against 1,857. Kansas posted the biggest drop, 521 pods below last year. Its yield forecast fell to 35 bushels from 38 in August and 48.5 in 2025. North Dakota fell to 30 from 34. The national number held up because Iowa rose to 64 bushels from 62 and Nebraska to 60 from 57, and because harvested area is 7% larger than last year.
Fewer pods can still produce a big crop if the beans inside them are heavy, and early-season pod counts are revised as surveyors return each month. That is the honest uncertainty. The crop also matured fast: NASS notes that North Dakota had 18% of its soybeans dropping leaves by 30 August, against a five-year average of 12%. Early maturity in a dry year tends to limit seed fill. If October's survey confirms the lower pod counts and adds lighter seed weights, the September yield will look high in hindsight. If seed weights come in heavy, Friday's fall will look justified.
Last year's pattern is worth keeping in mind as a reference point. The 2025 crop finished at 53.0 bushels an acre, a figure USDA now carries as final. This year's forecast sits 0.2 below that, with pod counts down in most states. That combination is not impossible, but it leans on seed weight to do a lot of work.
What this changes
Friday's session removed most of the weather premium from November soybeans without touching the parts of the market that USDA made tighter. The balance sheet is smaller at the end of the year, not larger. Stocks-to-use at 6.8% compares with 7.6% for the year just finished. That leaves the price exposed in both directions to one variable: the yield.
RelatedEthanol Price Prediction: $2.22 Bull Case vs $1.79 Bear
First, the October Crop Production report becomes the next real test. It adds a second month of objective yield data, and the pod counts published on Friday give it a clear direction to move if seed weights disappoint. A cut of even one bushel on 85.9 million harvested acres removes about 86 million bushels, more than eight times the stocks change USDA made this month.
Second, the oil leg now needs watching as a fuel-market variable. With half of product value in soybean oil and more than half of US soybean oil going into biofuel, any change in blending mandates, tax credits or fuel margins reaches the bean price through the crush. In 2024/25 biofuel took 43.7% of domestic soybean oil use; USDA now projects 53.8%.
Third, the weekly export sales report each Thursday matters more than usual. China's 1.222 million tonnes in one week sits against a year in which US exports fell 18%. Whether that pace holds into October, as Brazil's planting gathers pace and US harvest pressure builds, will decide whether USDA's 1.685 billion-bushel export forecast survives.
Finally, harvest cash markets will show how much of Friday's move farmers accept. Futures at $12.965 still sit about 97 cents above USDA's $12.00 season-average farm price forecast. That gap includes the basis and the timing of farmer marketing through the year. It narrows or widens depending on how quickly the record crop moves off farms.
Related reading on the commodities desk: the wheat rally tied to Black Sea port repairs shows how a supply shock outside the US can move a grain market faster than any monthly USDA table.
FAQ
Why did soybeans fall after USDA cut ending stocks?
Futures had risen 14% in the four weeks before the report on dry weather and falling crop ratings, pricing a smaller harvest. USDA instead raised production by 16 million bushels to a record 4.535 billion, lifting the yield to 52.8 bushels an acre. The stocks cut came from higher exports rather than a smaller crop, so the weather premium unwound and November futures settled 2.68% lower at $12.965.
What is the soybean board crush?
It is a processor's gross margin per bushel, calculated from futures prices. Multiply the meal price per short ton by 0.022, add the oil price in cents per pound multiplied by 0.11, and subtract the bean price. On Friday's CBOT settlements the board crush was about $2.46 a bushel, almost unchanged from $2.44 on Thursday, because beans fell nearly as much as the combined product value.
How much US soybean oil goes into biofuel?
USDA's September WASDE projects 17.8 billion pounds of soybean oil used for biofuel in 2026/27, or 53.8% of domestic disappearance of 33.1 billion pounds. That compares with 11.758 billion pounds in 2024/25. Over the same period, US soybean oil exports fall to a projected 400 million pounds from 2.472 billion, as domestic fuel producers absorb the supply.
Is China buying US soybeans again?
In the week of 28 August to 3 September, China bought 1,222,000 tonnes of US soybeans for the 2026/27 marketing year, according to USDA's Foreign Agricultural Service. That was nearly half of all net new-crop sales that week. A separate 530,000-tonne sale to China was reported under the daily system. The previous marketing year's exports, however, finished 18% below the year before.
When will USDA update the soybean yield again?
USDA publishes a new Crop Production report and WASDE each month through harvest. The October edition will carry a second month of objective yield survey data, including updated pod counts. Friday's report showed pod counts below 2025 final levels in 8 of the 11 surveyed states, so October's figures will show whether the 52.8 bushel-per-acre yield forecast holds.
Disclaimer
This article is analysis and information, not investment advice or a recommendation to trade any futures contract, fund or other instrument. Commodity futures and leveraged products carry a high risk of loss, and you can lose more than your initial capital. Prices quoted are delayed exchange settlements as of Friday 11 September 2026 and will have changed by the time you read this. Past performance is not a guide to future results.