

November canola closed at C$811.30 a tonne on 1 October 2026, 29.6% above the C$626.00 close on 31 December 2025. The contract is ICE Futures U.S. canola, symbol RS, for November 2026, quoted in Canadian dollars per tonne. A move like that would be ordinary after a drought. It is not ordinary beside the crop Statistics Canada described on 16 September: 22.1 million tonnes for 2026, only 0.8% under last year, on the largest harvested area the country has recorded.
The reconciliation is in use. In the crop year ended 31 July 2026, crushing rose 13.0% to a record 12.9 million tonnes and exports fell 4.5% to 9.0 million tonnes. Stocks on 31 July were 1.9 million tonnes, above 1.597 million a year earlier and well below 3.225 million on 31 July 2024. China tariffs hit the first half. The crush took the tonnes. Price then gave back C$30.60 from the 1 September close of C$841.90. The open question into 13 November is whether harvest deliveries extend that dip.
The figures that pin the call
- November 2026 canola (RS) closed at C$811.30 a tonne on 1 October 2026, range C$807.40 to C$823.70, volume 51,593 contracts. Delayed ICE tape, retrieved 07:33 UTC on 2 October 2026. The 2 October session was still forming: last C$810.50, volume 1,924. That print is not used as a close.
- From the 31 December 2025 close of C$626.00 to the 1 October close is 29.6%. The 1 September high was C$843.70 and the close was C$841.90, on volume of 50,205.
- Statistics Canada, 16 September 2026: 2026 production modelled at 22.1 million tonnes, yield 41.8 bushels an acre (down 8.3%), harvested area 23.2 million acres (up 8.0%, a record). Table 32-10-0359-01.
- Statistics Canada, 9 September 2026: total stocks 1.9 million tonnes on 31 July, up 18.9%. On-farm stocks 837,000 tonnes. Commercial stocks 1,063,000 tonnes. Crush 12.9 million tonnes. Exports 9.0 million tonnes. Table 32-10-0007-01.
- Saskatchewan farm price for canola, including rapeseed, averaged C$731.13 a tonne in July 2026, against C$619.13 in January. Table 32-10-0077-01, released 10 September 2026. August and September cash prices are not in that table.
- Same-morning delayed curve, 07:33 UTC on 2 October: January 2027 C$824.10, May 2027 C$834.20, November 2027 C$775.10. November 2026 last on that tape was C$810.50.
Where November has actually traded
The chart is the November 2026 contract only, not a stitched continuous price. Daily closes run from 1 April through the completed 1 October session. Bull, base and bear are paths to Friday 13 November 2026, the last trading day, not lines the market has already printed.
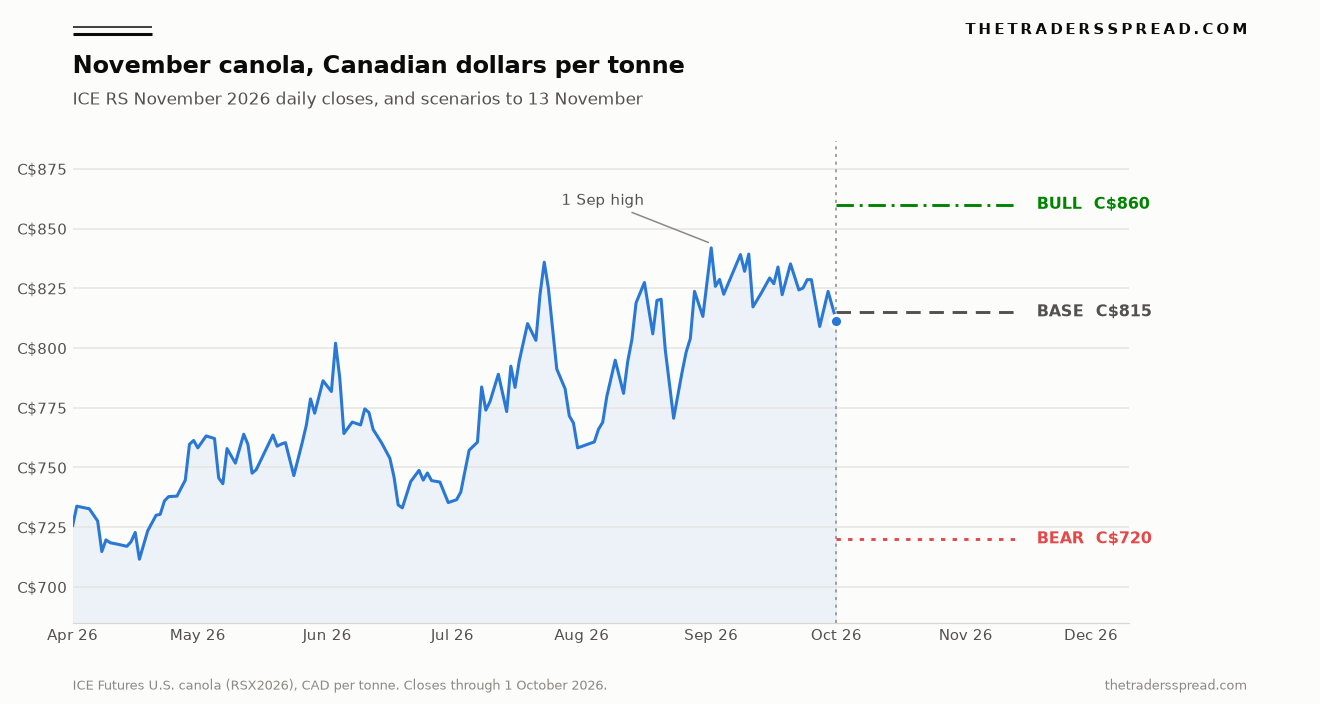 November 2026 daily closes, with the three scenario levels drawn to 13 November.
Spring was a different market. The lowest close from April through June was C$711.60 on 17 April, with a session low of C$709.60. The 19 June close was C$733.10. Summer did the rest in a hurry: C$810.20 on 19 July, a shakeout to C$760.70 on 4 August, then the 1 September high. C$860 is C$16.30 above a high that traded five weeks ago. C$720 sits just above a close that traded in April.
The 1 October session traded 51,593 contracts. At 20 tonnes each, that is just over one million tonnes of notional canola before spreads net out. The tick is C$0.10 a tonne. The daily limit is C$50 a tonne either side of the previous settlement, on the ICE canola contract terms.
The 2 October print stays off the chart. At 07:33 UTC the delayed tape, marked as a 10-minute delay, showed November last at C$810.50, inside C$809.50 to C$811.70, with 1,924 contracts. Winnipeg was still early. The call below is anchored to the completed close of C$811.30.
StatCan's August model, published in September
The 16 September release is "Model-based principal field crop estimates, August 2026", a joint publication with Agriculture and Agri-Food Canada. Statistics Canada has used satellite and agroclimatic data for this preliminary figure since 2016. It is not the final surveyed crop. It is the model the trade had while November canola was already above C$820.
Yields are expected to fall 8.3% to 41.8 bushels an acre. Harvested area is expected to rise 8.0% to 23.2 million acres, which the agency calls the highest on record. Production edges down 0.8% to 22.1 million tonnes. Table 32-10-0359-01 carries 22,050,608 tonnes for 2026, against 22,227,416 tonnes for 2025 (marked revised) and 19,239,463 tonnes for 2024. The 2021 drought year was 14,248,281 tonnes at 28.4 bushels an acre. Talking about 2026 as if it were 2021 is a category error.
Saskatchewan, the main canola province, is modelled at 12.7 million tonnes, up 1.8%, because a record 13.3 million harvested acres offsets a 7.3% yield drop to 41.9 bushels an acre. Alberta is modelled at 6.1 million tonnes, down 3.8%, yields down 9.3% to 41.2 bushels an acre. Manitoba's table figure is 3,094,212 tonnes, against 3,250,371 in 2025, with yields modelled at 42.9 bushels an acre.
StatCan refused a single Prairie story. Some areas were dry. Parts that got rain were above average. Provincial reports, as the agency summarised them, had almost 60% of major crops in Alberta rated good to excellent at the end of August. That is the release, not a crop tour.
The same model was not kind to every Prairie crop. The oats note on this desk covered a Canadian oats crop StatCan had cut. Canola is the other problem: record area, a yield off its peak, and a production number that barely fell.
A record US soybean crop was a different balance sheet. The soybeans piece is where that print lives. It does not explain a Winnipeg high in early September and a 1 October close still above C$810.
Crush at a record, exports only slightly lower
Stocks as of 31 July 2026 came out on 9 September. The Daily is blunt: canola stocks rose, and the crush kept expanding.
Total stocks increased 18.9% to 1.9 million tonnes, and the increase was on farm. On-farm stocks rose 121.4% to 837,000 tonnes. Commercial stocks fell 12.8% to 1.1 million tonnes. Table 32-10-0007-01, whose figures are in thousands of tonnes, puts commercial stocks at 1,063,000 tonnes, down from 1,219,000. On-farm stocks a year earlier were 378,000. A jump to 837,000 looks large in percent terms and still leaves the country far from a heavy carry-out. The totals are 1,899,000 tonnes on 31 July 2026, 1,597,000 a year earlier, and 3,225,000 on 31 July 2024.
The year emptied itself. On 31 December 2025 total stocks were 16,092,000 tonnes, of which 14,785,000 were on farm. On 31 March 2026 the total was 10,380,000 tonnes. On 31 July it was 1,899,000. A 22.2 million tonne harvest did not become a 3 million tonne carry-out.
Industrial use, mostly crushing, rose 13.0% to a record 12.9 million tonnes, "as the processing industry continued to expand to meet demands for renewable fuels." Exports fell 4.5% to 9.0 million tonnes, "largely the result of slower exports in the first half of the year when tariffs imposed by China reduced export demand." Rounded crush plus rounded exports are 21.9 million tonnes. Seed, feed and dockage sit in that rounding. No residual is invented here.
"There are also very good reasons for optimism moving forward, including major investments in domestic processing and export infrastructure, growing opportunities for canola in biofuel production and energy security, and record production in 2025."
Chris Davison, president and chief executive of the Canola Council of Canada, said that on 28 July 2026, in the notice that he will step down on 31 December 2026. It names the same three facts the stocks release later measured: domestic processing, biofuel demand, and a record 2025 crop. It is an industry voice. It also predates the September model of another 22.1 million tonne crop.
What China actually did to the tariff schedule
Without the tariff dates, a 4.5% export decline looks like a rounding error. It was a damaged first half that later months repaired.
On 8 March 2025 the council and the growers' association said China would put a 100% tariff on Canadian canola oil and meal from 20 March 2025. On 12 August 2025 they said the Ministry of Commerce had set a 75.8% deposit on seed from 14 August 2025, and Davison called that market "effectively closed." The August statement put 2024 exports to China at $4.9 billion. The meal-and-oil step is the 8 March statement.
On 16 January 2026 the same groups said a Canada-China agreement was expected to cut the seed tariff to 15% from 1 March 2026 and to remove the 100% meal tariff from that date until at least year-end. They put 2024 exports to China at about $5 billion and expected the 2025 value to fall to less than half. Oil was left unfinished.
"We are pleased to see significant progress in restoring market access for seed and meal and will continue to build on this development by working to achieve permanent and complete tariff relief, including for canola oil, moving forward."
Chris Davison, 16 January 2026, in that joint release. The same note quotes Rick White, president and chief executive of the Canadian Canola Growers Association: "With most of the 2025 canola crop stored on farm, and planting of the 2026 crop only months away, canola farmers are looking for predictability and confidence in the ability to market their canola."
White was describing January. By 31 July, on-farm stocks were 837,000 tonnes, so most of that crop had moved. The 15% seed rate and the meal exemption are what the 16 January agreement was expected to deliver. This desk has not re-read a MOFCOM gazette on 2 October, so those rates are not restated as a freshly checked Chinese schedule. StatCan's harder fact is narrower: the export damage showed up in the first half of the crop year.
Full-year exports fell only 4.5%, to 9.0 million tonnes, because later months repaired the first half. The council's January estimate of the value shipped to China was much worse than that volume figure. Quoting only the tonnes misses the political risk. Quoting only a closed market misses a year when the crush set a record and carry-out stayed under 2 million tonnes.
The curve, the currency, and cash that stopped in July
On the delayed tape at 07:33 UTC on 2 October the board looked like this. Deferred volume is early-session turnover, not open interest. May, July and November 2027 had traded only tens of contracts by then.
| Contract | Last (C$/tonne) | Volume so far | Listed expiry |
|---|---|---|---|
| November 2026 | 810.50 | 1,924 | 13 November 2026 |
| January 2027 | 824.10 | 748 | 14 January 2027 |
| March 2027 | 831.80 | 377 | 12 March 2027 |
| May 2027 | 834.20 | 76 | 14 May 2027 |
| July 2027 | 831.30 | 80 | 14 July 2027 |
| November 2027 | 775.10 | 88 | 12 November 2027 |
Source: delayed ICE canola tape, 07:33 UTC, 2 October 2026.
The shape is the point. From November 2026 up to May 2027 the front is the cheap month. November 2027 was C$35.40 under the November 2026 last on that tape. The board pays up for seed that has to come out of a 1.9 million tonne carry-out. It does not pay the same price for seed the 2026 harvest is expected to replace.
January still exists at year-end. November does not. January at C$824.10 is C$13.60 over the November last, and it expires on 14 January 2027. That spread says part of the front-month dip is a delivery-month phenomenon. It is not a promise that November rallies to meet January. Spreads can widen into delivery.
The Canadian dollar is the smaller character. The ECB reference rate via frankfurter.dev was 1.3692 per US dollar on 31 December 2025 and 1.4246 on 1 October 2026, a 4.0% rise in Canadian dollars per US dollar. Four percent does not explain 29.6%. The USD/CAD note of 1 September set an upper case at 1.4250, and the 1 October reference rate sat on it. Currency is backdrop.
RelatedLean hogs: national negotiated base fell to $65.94
Cash has to be labelled as stale. In table 32-10-0077-01, July farm prices were C$731.13 a tonne in Saskatchewan, C$742.92 in Manitoba and C$714.77 in Alberta. Saskatchewan's January average was C$619.13, up 18.1% by July, while the November future rose 29.6% from 31 December to 1 October. Those windows do not match, and the cash series stops in July. The gap to C$811.30 is not a basis anyone can lock today. August and September farm prices were not out by 2 October.
Base C$815, bull C$860, bear C$720
The horizon is this contract's life. The fifteenth calendar day of November 2026 is a Sunday, so the last trading day is Friday 13 November. The levels below are closes on the way into that session. They are not instructions, and they are not a January price.
The base case is C$815 a tonne: a hold near the 1 October close of C$811.30, under January and well under the 1 September high. A 22.1 million tonne harvest stops the rally. A 1.9 million tonne carry-out and a record crush stop a collapse. The C$30.60 already given back from 1 September is the harvest discount this case counts. Editorial weight: half. That fraction is not an options probability.
The bull case is C$860, 6.0% above the 1 October close and C$16.30 above the 1 September high of C$843.70. It needs the August model to prove too high once more of the crop is over the scale, or exports after the March tariff step-down to arrive fast enough that carry-out talk drops under the 2025 figure. A close through C$843.70 would mean the September dip failed. C$860 is the round step past that high. Editorial weight: a quarter.
The bear case is C$720, 11.3% under the 1 October close and just above the 17 April close of C$711.60. It is the path on which 2026 beats 41.8 bushels an acre by enough to matter, and the China hit was not confined to the first half of 2025/26. Getting there inside five weeks, against a record crush, is the hard part. It belongs on the chart because C$711.60 traded this year. Editorial weight: a quarter.
The reference stored with this piece is the 1 October close of C$811.30. The working target is the base at C$815. The level that ends the plateau reading is C$720. Bias is neutral. Conviction is 3 out of 5, because stocks and the harvest pull opposite ways. C$860 is on the chart as the tail, not as the stored target.
What would change the weights
The base loses to the bull if November closes back through the 1 September high of C$843.70 before expiry, or if credible yield reports cut the 22.1 million tonne model by closer to a million tonnes than to a rounding error. A single busy export week would not. Exports already finished only 4.5% lower after a weak first half.
The base loses to the bear if the contract trades through C$720 and, especially, through the 17 April close of C$711.60. A surveyed crop above 23 million tonnes would do the same job to the balance sheet even if the chart took longer. Oil still sitting outside the January relief, on Davison's wording, is the political version of that risk. Meal and seed were the milestone. Oil was the item he said was still to finish.
Two things would not change the weights. A daily move inside the C$50 limit is noise until it sticks. And a tenth either side of the 2 October indication, C$810.50 at retrieval, is not a new regime. The completed session is C$811.30 until a later close replaces it.
Short answers
Which contract is this?
ICE Futures U.S. canola, symbol RS, November 2026, in Canadian dollars per metric tonne. One contract is 20 tonnes. The tick is C$0.10 a tonne. The last trading day is Friday 13 November 2026. Terms are on the ICE product page linked above. Closes in this note are from the delayed ICE tape retrieved at 07:33 UTC on 2 October 2026, not from an official settlement file.
Why is price up if the crop is this large?
Because the 2025 crop, 22.2 million tonnes, did not pile up. Crush rose 13.0% to a record 12.9 million tonnes in the year to 31 July 2026, and total stocks were 1.9 million tonnes, not the 3.2 million of July 2024. Exports fell 4.5% to 9.0 million tonnes. The 2026 model crop is 22.1 million tonnes. Large, yes. A surprise glut, on the last official carry-out, no.
What is the China situation cited here?
Meal and oil drew a 100% tariff from 20 March 2025, and seed a 75.8% deposit from 14 August 2025, on the council's account of Chinese measures. On 16 January 2026 an agreement was expected to cut seed to 15% and drop the meal tariff from 1 March, with oil open. StatCan later tied the export drop to the first half of the crop year. The 15% is the agreement as the industry stated it.
How far do these levels apply?
Only to 13 November 2026, and only for November. January 2027 was C$824.10 on the delayed tape at 07:33 UTC on 2 October, expiring 14 January 2027. November 2027 was C$775.10, about C$35 under the front, on thin early volume. A year-end opinion that ignores January is an opinion about a contract that will have stopped trading.
Is C$815 something a reader is meant to act on?
No. C$815 is the base-case close into expiry, C$860 is the upside case and C$720 is the downside case. The stored reference is the 1 October close of C$811.30. Nothing here tells anyone to take a position in canola, the Canadian dollar, or anything else. Futures can move the C$50 daily limit. The model crop can be revised. Capital is at risk.
This is analysis, not a recommendation. The crop figures include a model that Statistics Canada distinguishes from a final survey. Capital is at risk.