

Micron Technology's cost of goods sold rose 10.5% in the year to 28 May 2026, from $5.793bn to $6.400bn. Revenue over the same twelve months rose 345.7%, from $9.301bn to $41.456bn. Almost the entire gap is price, not production. The company's own quarterly report attributes the DRAM increase to a "low-260% range increase in average selling prices" against bit shipments up only in the low-20% range, and the NAND increase to a mid-310% ASP move on low-double-digit bit growth. Micron did not learn to make far more memory. It learned to charge far more for roughly the same amount of it. Gross margin went from 37.7% to 84.6% in four quarters, operating margin from 23.3% to 80.4%, and diluted earnings per share from $1.68 to $24.67. The stock closed Friday 18 September at $1,015.80, up 517% over fifty-two weeks and still 16.3% below the record close it set in June.
That is the part the market has priced. What it has not priced is the clause sitting three pages earlier in the same filing. Micron's multi-year Strategic Customer Agreements, the take-or-pay contracts management keeps describing as a durability story, carry a ceiling. The 10-Q states that the largest agreements "generally have a ceiling price for existing products that approximates the market price in the second calendar quarter of 2026, and a floor price through the term of the agreement." Micron has traded away the right to charge more than April-to-June 2026 prices on its biggest contracts, in exchange for not having to charge less. A stock valued on memory-price momentum has quietly capped its own realised price at a level that is already in the rear-view mirror.
Key facts
- Fiscal Q3 2026 revenue of $41.456bn, up 345.7% year on year, on cost of goods sold up 10.5% to $6.400bn — Micron 10-Q for the quarter ended 28 May 2026, filed 25 June 2026
- GAAP gross margin 84.6% and GAAP diluted EPS of $24.67, against 37.7% and $1.68 a year earlier — Micron fiscal Q3 2026 results release, 24 June 2026
- Fiscal Q4 2026 guidance of $50.0bn ± $1.0bn revenue, approximately 86% gross margin and GAAP diluted EPS of $30.73 ± $1.00 — Micron business outlook, 24 June 2026
- The largest Strategic Customer Agreements carry a ceiling price approximating the market price of calendar Q2 2026, plus a floor through the contract term — Micron 10-Q, 28 May 2026
- Remaining performance obligations of approximately $5bn at minimum volumes and minimum pricing, immaterial twelve months earlier — Micron 10-Q, 28 May 2026
- Inventory of $8.567bn versus $8.727bn a year earlier, while quarterly revenue multiplied 4.5 times — Micron 10-Q, 28 May 2026
- Closing price $1,015.80 on Friday 18 September 2026, versus a 52-week closing high of $1,213.56 on 25 June 2026 and a low of $154.65 on 25 September 2025 — Nasdaq historical quote endpoint, retrieved 07:36Z 20 September 2026
Reading the contracts before reading the tape
The Strategic Customer Agreements are the structural fact of this cycle, and they are disclosed in unusually plain language. They are take-or-pay, with binding volume commitments over multi-year terms. Pricing on most is either fixed outright or bounded by a floor and a ceiling. A minority float with the market. As of 28 May 2026 the transaction price allocated to remaining performance obligations was approximately $5bn, calculated on minimum committed volumes at minimum pricing, of which $422m had been booked as contract liabilities. Twelve months earlier that number was not material enough to disclose.
Two consequences follow, and they run in opposite directions.
The floor is the reason this cycle should not end the way 2019 and 2023 ended. Micron's own position is that gross margins under these agreements, "even at floor pricing levels", would "yield gross margins well above our peak quarterly margins in any past cycle". Memory downturns historically arrive as a price collapse that runs straight through a fixed cost base; a floor converts that into a slower bleed. The ceiling is the reason the upside is narrower than a 517% twelve-month chart implies. If contract DRAM keeps climbing through calendar 2027, the incremental dollar goes to whoever did not sign, and Micron signed a lot.
The risk-factor section puts a useful frame around how unusual the last year has been. Over the past five fiscal years, Micron says, annual changes in DRAM average selling prices ranged from an increase in the low-40% range to a decrease in the high-40% range. The first nine months of fiscal 2026 delivered roughly +140%. This is not a normal leg of a normal cycle, which is exactly why locking a floor at a fraction of it is a defensible trade for the company and an awkward one for anyone valuing the stock off spot.
The cost line that refused to move
Look at what happened to the cost base while all this was going on.
Between the quarter ended 29 May 2025 and the quarter ended 28 May 2026, Micron's revenue multiplied by 4.5 times. Cost of goods sold rose by $607m. Gross margin went from 37.7% to 84.6%, and operating margin from 23.3% to 80.4%. Inventory, the number that usually blows out when a manufacturer is straining, barely moved: $8.727bn a year ago, $8.567bn now, with $8.355bn at the August 2025 fiscal year end in between. Micron is shipping a fifth more bits than a year ago out of a warehouse that is the same size.
Operating income by business unit shows where the operating leverage landed. The Core Data Center unit, which sells into the same server builds that Nvidia's accelerator ramp drives, grew revenue 653% year on year to $11.524bn at an 83% operating margin. Cloud Memory did $13.769bn at 78%. Mobile and Client, a business nobody associates with pricing power, ran an 86% operating margin on $11.521bn. Even Automotive and Embedded, the sleepy one, cleared 75%.
Margins of that shape are not engineering outcomes. They are scarcity rents, and they persist exactly as long as the scarcity does. The question for the next twelve months is not whether Micron can hold an 86% gross margin, because the guidance already says it expects to for one more quarter. It is what the floor prices in those contracts are worth when the rent stops.
Twelve months of closes, and three ways this resolves
US cash equities were closed on Sunday 20 September. The reference price throughout this piece is Friday 18 September's close of $1,015.80, pulled from the Nasdaq historical endpoint at 07:36Z on 20 September 2026. On that session Micron traded between $977.83 and $1,016.44 on 35.8m shares, the heaviest volume in two weeks.
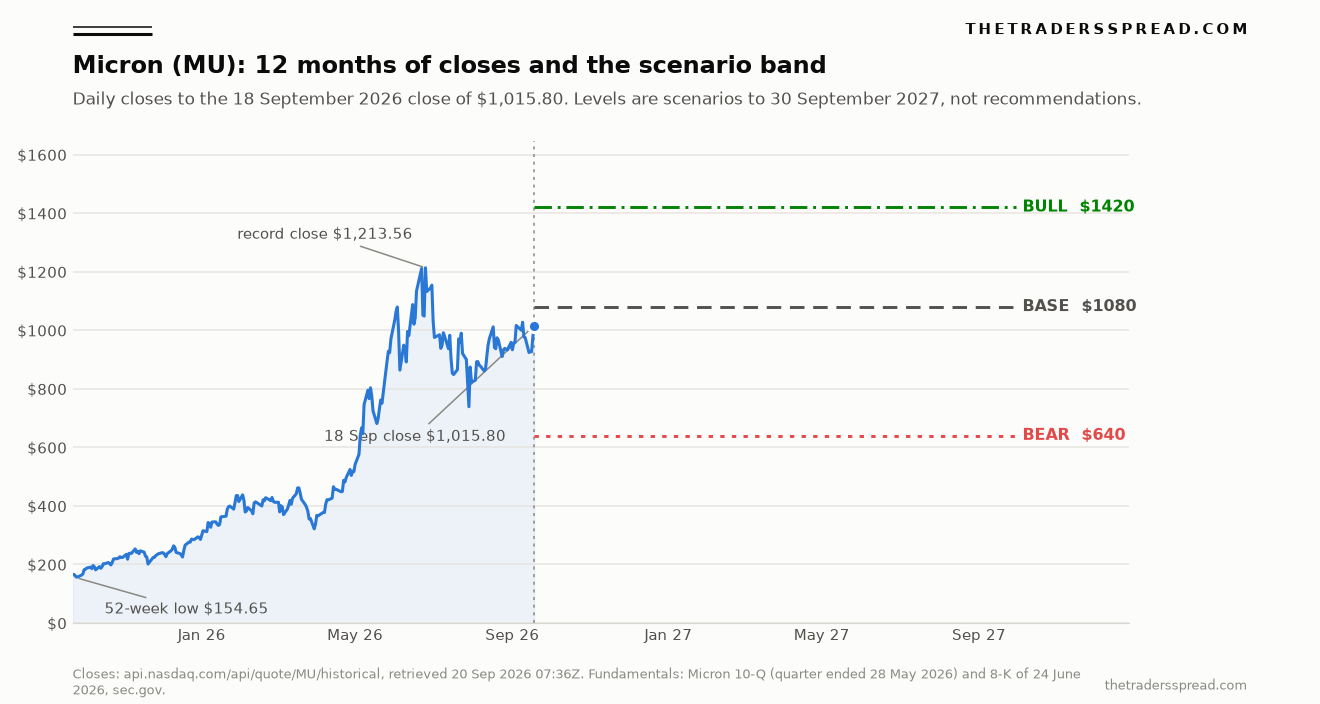
The twelve-month series runs from $164.62 on 22 September 2025 to $1,015.80 on 18 September 2026, with a 52-week closing high of $1,213.56 set on 25 June 2026 and an intraday high of $1,255.00 the same day. The stock sits 16.3% below that closing high. Annualised volatility of daily closes over the window is 80.7%, which is worth holding in mind when reading any scenario band: a one-standard-deviation year on that reading is wider than the distance from the bear case to the bull case.
| Quarter (period end) | Revenue | Cost of goods sold | GAAP gross margin | GAAP diluted EPS | Inventory |
|---|---|---|---|---|---|
| FQ3-25 (29 May 2025) | $9,301m | $5,793m | 37.7% | $1.68 | $8,727m |
| FQ1-26 (27 Nov 2025) | $13,643m | $5,997m | 56.0% | $4.60 | $8,205m |
| FQ2-26 (26 Feb 2026) | $23,860m | $6,105m | 74.4% | $12.07 | $8,267m |
| FQ3-26 (28 May 2026) | $41,456m | $6,400m | 84.6% | $24.67 | $8,567m |
| FQ4-26 (guidance, 3 Sep 2026) | $50,000m ± $1,000m | not guided | approx. 86% | $30.73 ± $1.00 | not guided |
Source for all five rows: Micron 10-Q filings and the fiscal Q3 2026 results release of 24 June 2026, both on sec.gov. Guidance is the company's own, issued 24 June 2026.
Add the three reported quarters to the midpoint of the fourth and fiscal 2026 lands at roughly $72.07 of GAAP diluted earnings per share. At $1,015.80 that is 14.1 times the year Micron is about to finish reporting. Annualise the guided fourth quarter alone and the multiple is 8.3 times. Both numbers are arithmetic, not forecasts.
Where $45.7bn of operating cash went
Nine months of fiscal 2026 generated $45.702bn of operating cash flow against $11.795bn in the comparable period of 2025. The uses are revealing, and they are not the ones a shareholder-return story would predict.
Capital expenditure took $19.602bn, up 92% year on year. Debt repayment took $9.380bn, including the full prepayment of the 2028 Notes, the 2029 Term Loan A and both tranches of 2029 and 2030 paper. Dividends took $437m. Share repurchases under the buyback authorisation took $650m, for 2.5 million shares. That is the entire return of capital: a company earning $28bn in a single quarter retired roughly two-tenths of one percent of its shares in nine months.
The constraint is partly disclosed and partly structural. Of a $10bn board authorisation, approximately $2.16bn remains, and the filing notes that repurchase capacity is subject to "restrictions applicable under our CHIPS Act direct funding agreements". Since the programme began in 2019, Micron's largest single-year repurchase has been $2.66bn. Diluted share count has gone the other way, from 1,125m in FQ3-25 to 1,145m in FQ3-26.
One working-capital line deserves attention because it does not appear in any headline. Receivables consumed $19.953bn of cash over the nine months. Revenue is being recognised considerably faster than it is being collected, which is normal when quarterly sales nearly double twice in a row, and which becomes uncomfortable the moment a large customer's own order book turns. Set against that, other current liabilities carry $3.32bn of estimated consideration payable to customers for pricing adjustments and returns, up from $1.19bn at the fiscal year end.
Cash and marketable investments finished the quarter at $30.13bn against $11.94bn ten months earlier. Total equity is $100.724bn, of which $94.682bn is retained earnings, nearly double the $48.583bn carried at 28 August 2025.
Why peak earnings and peak multiple never arrive together
The single most persistent error in memory equities is treating a low price-to-earnings ratio at the top of a cycle as cheapness. Semiconductor memory names print their lowest multiples precisely when earnings are at their most extended, because the market is already discounting the mean reversion. An 8.3 times multiple on annualised guided earnings is not an argument that Micron is mispriced. It is the market's estimate that this quarterly earnings level will not repeat many times.
What is different this cycle is that the estimate now has to contend with a contractual floor rather than a spot market. That is a genuine change in the shape of the distribution, and it is why comparisons to Intel's long de-rating or to the 2019 memory trough only partly transfer. It is also why the more useful peer frame is not another memory maker but the companies selling into the same AI build-out on multi-year commitments, from Broadcom's custom silicon book to Dell's server backlog. Each has converted a cyclical order book into something closer to a contracted one, and each is being valued somewhere between the two.
Sanjay Mehrotra, Chairman, President and CEO of Micron Technology, framed it this way in the 24 June results release: "We believe our multi-year Strategic Customer Agreements will significantly enhance the durability and predictability of Micron's strong financial performance." Durability and predictability are the words to test. The filing's own remaining-performance-obligation figure, roughly $5bn on minimum volumes at minimum prices with about a third landing in the next twelve months, is a small fraction of a $50bn quarter. The contracts may well be transformative. They are not yet large in the disclosed numbers.
One more governance detail belongs here. On 26 August Micron announced that Manish Bhatia, 54, became President and Chief Operating Officer and that Dr Scott DeBoer, 60, became President and Chief Technology and Products Officer, both effective immediately. Two internal presidents appointed at a cyclical peak is a succession structure being built, not a reaction to anything in the quarter.
The call: $1,420 bull, $1,080 base, $640 bear
Working horizon is twelve months, to 30 September 2027. All three levels are measured against the 18 September 2026 close of $1,015.80.
RelatedCelestica Stock Forecast (CLS): $520 Bull, $280 Bear
| Scenario | Level | From 18 Sep close | × FY26 GAAP EPS ($72.07) | × annualised FQ4 guide ($122.92) | Implied market cap |
|---|---|---|---|---|---|
| Bull | $1,420 | +39.8% | 19.7x | 11.6x | $1.60tn |
| Base | $1,080 | +6.3% | 15.0x | 8.8x | $1.22tn |
| Bear | $640 | -37.0% | 8.9x | 5.2x | $0.72tn |
Base case, 45%. Fiscal Q4 lands inside the guided band, fiscal 2027 revenue holds near the $200bn annualised run-rate because floors prevent a collapse, and the multiple compresses as earnings plateau. The stock grinds within roughly 20% of where it closed on 18 September, which is what a contractually bounded business with an 80% volatility history tends to do once the repricing has happened.
Bull case, 30%, $1,420. This needs two things at once: HBM4 volume ramping into a second and third customer platform through calendar 2027, and enough uncontracted supply left that ceiling prices do not cap realised ASPs. It implies 11.6 times annualised guided earnings, a multiple the market has been willing to pay for contracted AI infrastructure but never for merchant memory.
Bear case, 25%, $640. Supply catches up in calendar 2027, spot DRAM breaks below contract floors, and take-or-pay customers start negotiating rather than paying. The floor protects the margin on committed volume and does nothing for the volume nobody committed to. At $640 the stock would trade at 8.9 times fiscal 2026 earnings, which is roughly where memory has bottomed in multiple terms in prior cycles.
What would change my mind. A fiscal Q4 gross margin materially below the guided 86% would say the ceiling is already binding, and would move weight from base to bear. A remaining-performance-obligation figure in the fiscal 2026 10-K that is a large multiple of $5bn would say the contracted book is real at scale, and would move weight from base to bull. An inventory build above roughly $10bn would say bits are no longer clearing. Micron filed its last two fiscal fourth-quarter results on 23 September 2025 and 25 September 2024; no 8-K fixing this year's date was on EDGAR as of 20 September 2026, so the test is probably days away.
FAQ
What price is this analysis based on?
Friday 18 September 2026's closing price of $1,015.80, retrieved from the Nasdaq historical quote endpoint at 07:36Z on Sunday 20 September 2026. US cash equities do not trade again until 13:30Z on Monday 21 September. The session range that day was $977.83 to $1,016.44 on 35.8m shares. No live tick is implied anywhere in this piece.
What exactly is a Strategic Customer Agreement?
A multi-year take-or-pay supply contract with binding volume commitments, disclosed in Micron's 10-Q for the quarter ended 28 May 2026. Most carry fixed pricing or a floor-and-ceiling band; the largest set the ceiling at approximately the market price of calendar Q2 2026. A minority float with the market. Remaining performance obligations were about $5bn at minimum volumes and minimum prices.
Why is the price-to-earnings ratio so low if the stock is up 517%?
Because earnings rose faster than the price. Fiscal 2026 GAAP diluted earnings per share works out at roughly $72.07 using three reported quarters and the midpoint of fourth-quarter guidance, putting the 18 September close at 14.1 times. Memory equities characteristically show their lowest multiples at peak earnings, since the market is discounting reversion rather than extrapolating. See earnings per share.
How much stock is Micron buying back?
Very little relative to its cash generation. Over the first nine months of fiscal 2026 Micron repurchased 2.5 million shares for $650m under its authorisation, against $45.702bn of operating cash flow. About $2.16bn remains of a $10bn board authorisation, and the company notes that repurchases are restricted under its CHIPS Act direct funding agreements. Diluted share count rose over the year.
Is the 52-week range on quote sites reliable for Micron?
Treat the two feeds separately. Nasdaq's quote-info endpoint reports an unadjusted 52-week range while its historical endpoint is back-adjusted, and the two contradict each other on any name with a corporate action. Every figure here comes from the historical series, which runs from $164.62 on 22 September 2025 to $1,015.80 on 18 September 2026.
Which competitors matter most to the thesis?
Samsung and SK Hynix set marginal DRAM supply and are not covered here because neither files with the SEC on a comparable schedule. On the demand side the relevant reads are accelerator and server order books rather than other memory makers; our coverage of Nvidia and of AMD's margin guidance tracks the same build-out from the other end.
Disclaimer
This article is analysis and information, not investment advice, and nothing in it is a recommendation to take any position in Micron Technology or any other security. Scenario levels are illustrative of possible outcomes and carry no guarantee. Equities are volatile and capital is at risk; Micron's own filings record annual DRAM price swings ranging from an increase in the low-40% range to a decrease in the high-40% range over the past five fiscal years. Do your own research and consider your circumstances before acting.