

Celestica finished the 7 October 2026 regular session at $371.57. The share fell 4.3% that day, from a prior close of $388.24, and it sits 21% under the $472.40 closing high of 2 June. On 27 July the company said 2027 revenue growth should accelerate past the 65% rate in its $20.5 billion outlook for 2026. Those two facts cannot both be comfortable. A Celestica stock forecast has to decide which fact the 26 October release is more likely to wound: the growth sentence, or the drawdown.
The sharper conflict is inside the outlook, not only on the chart. First-half revenue was $8.746 billion. A $20.5 billion year therefore leaves $11.754 billion for the second half. Third-quarter guidance is $5.25 billion to $5.55 billion, so the fourth quarter is left carrying roughly $6.20 billion to $6.50 billion. Celestica has not published a fourth-quarter range. That gap is arithmetic. The October update is where management keeps it or walks away from it.
Key facts
- NYSE close $371.57 on 7 October 2026, down 4.3% from $388.24. Session range $367.15 to $380.42. Volume 1.59 million shares. Source: Yahoo Finance daily chart for CLS, retrieved 8 October 2026.
- Closing high in that series: $472.40 on 2 June 2026. Session high that day: $474.03. Lowest close: $243.72 on 10 October 2025. Source: Yahoo Finance daily chart, retrieved 8 October 2026.
- Q2 2026 revenue $4.70 billion, up 62% from $2.89 billion. Adjusted EPS $2.54. GAAP diluted EPS $3.17. Source: Celestica earnings release, 27 July 2026.
- Q3 2026 guidance: revenue $5.25 billion to $5.55 billion, adjusted EPS $2.88 to $3.08, adjusted operating margin 8.4% at the midpoint. Source: Celestica earnings release, 27 July 2026.
- 2026 outlook: revenue $20.5 billion, adjusted EPS $11.30, adjusted operating margin 8.4%, free cash flow $600 million. The prior set was $19.0 billion, $10.15 and $500 million. Source: Celestica earnings release, 27 July 2026.
- Results after the close on 26 October 2026. Call and investor day on 27 October at 8:00 a.m. Eastern. Source: Celestica notice, 6 October 2026.
- Shares outstanding at 30 June 2026: 115.0 million, about $42.7 billion at the 7 October close. The outlook assumes no repurchases and no issuances for the rest of 2026. Source: Celestica Q2 release, 27 July 2026.
A drawdown that did not reset the multiple
From the 8 October 2025 close of $254.88 to $371.57 is a gain of about 46%. From the 2 January 2026 close of $302.40 the gain is about 23%. The 21% slide from the June closing high sits on top of that rise, not in place of it.
The 2 June close was $472.40. On 27 July, the release day, the close was $318.24, and the release is timestamped after the US cash session. The next session finished at $350.20 on about 7.9 million shares, the heaviest volume in this series. The beat-and-raise was a one-day jump. It did not restore the June high.
The low close after 2 June was $277.77 on 2 September, with a session low of $273.80. The share then recovered to $388.24 on 6 October. The move to $371.57 gave back only part of that bounce.
Volume did not confirm a rush for the exit.
1.59 million shares changed hands on 7 October, against about 7.9 million on 28 July and 3.25 million on 2 September. The range, $367.15 to $380.42, sat inside late-September prices. A 4.3% decline can still matter. It is not, by itself, a break of that range.
The 50-day average of closes through 7 October is $333.57. The 200-day average is $332.23. The last price is about 11% above the first and about 12% above the second. Sitting above both does not mean the June peak is intact.
Our note on the VIX at 15 sets out how that index is built and what a 30-day move from a low print has looked like. The CLS session of 7 October does not say the wider tape failed. On the $11.30 adjusted EPS outlook, $371.57 is 32.9 times. The drawdown hurt anyone who paid the June price. It did not produce a low multiple.
Two businesses, and a cash figure that lags the earnings
Q2 revenue of $4.70 billion compared with guidance of $4.15 billion to $4.45 billion. Adjusted EPS of $2.54 compared with $2.14 to $2.34. Adjusted operating margin was 8.2%, against 7.4% a year earlier, and the company called it a new high. GAAP operating margin was 9.8%. GAAP diluted EPS was $3.17, against $1.82. The beat is not in dispute. The mix is.
Connectivity and Cloud Solutions did the growing. CCS revenue was $3.81 billion, up 84%, at a segment margin of 8.7% against 8.3%. Hardware Platform Solutions, inside CCS, was about $1.9 billion, up 58%. Advanced Technology Solutions was $0.89 billion, up 8%, at a margin of 6.3% against 5.3%. CCS was roughly four-fifths of the quarter. Aerospace and defense, industrial, health technology and capital equipment did not grow like the data-center book.
The 6 August 2026 prospectus shows the same shape over twelve months ended 30 June. Revenue was $15.6 billion, up about 47%. CCS contributed $12.3 billion and ATS $3.3 billion. Hardware Platform Solutions was $6.4 billion, up about 66%. GAAP diluted EPS was $9.62 and adjusted diluted EPS was $8.16.
Our Constellation Energy forecast sets a bull case at $360 and a bear case at $248. That is the power invoice on the same build. Celestica does not generate the electricity. It designs and builds a slice of the equipment in the hall. A hyperscaler slowdown would hit both, for different reasons.
Free cash flow tells a quieter story.
Free cash flow was $147.1 million in the quarter and $285.0 million in the first half. The full-year outlook is $600 million, up from $500 million, so the second half has to produce about $315 million. Over the twelve months to 30 June the prospectus reports operating cash of $1.1 billion, free cash flow of about $530 million and gross capital spending of $625 million. On about $42.7 billion of equity value, the $600 million cash outlook is a 1.4% yield. That yield and 32.9 times earnings can sit together only if 2027 does accelerate.
GAAP earnings are a poor referee. GAAP EPS of $3.17 included a $0.90 per share pre-tax gain on the total return swap, which the company strips from adjusted EPS because it tracks the share price rather than shipments. The third-quarter guide also excludes $0.27 to $0.33 a share, pre-tax, for stock-based pay, amortization and restructuring, and it assumes an adjusted tax rate of about 20%.
"Driven by very strong customer demand, and supported by new program wins, we expect revenue growth in 2027 to accelerate beyond the 65% growth rate we are anticipating in 2026. We also anticipate adjusted EPS (non-GAAP) to grow at a faster rate than our revenue in 2027, driven by higher expected adjusted operating margin (non-GAAP)."
That is Rob Mionis, chief executive, in the 27 July 2026 earnings release. The same release sets 2026 revenue at $20.5 billion and adjusted EPS at $11.30, growth he put at 65% and 87%. The 2027 sentence has a direction and no dollar.
The prospectus names two programs behind that slope: a collaboration with Advanced Micro Devices on a 1.6-terabit scale-up switch for the Helios rack platform, and a 1.6-terabit co-packaged optics award from a hyperscale customer. The filing says both depend on demand, design and qualification, with no assurance on timing or volume.
Those programs are not revenue.
Celestica stock forecast: $520, $410 and $280
The chart uses Yahoo Finance daily closes from 8 October 2025 through 7 October 2026, with lines run out to 31 October 2027. They are this desk's scenarios. This piece does not adopt a target it could not trace to an analyst's note or a filing. The range uses the July outlook and prices the share has already traded.
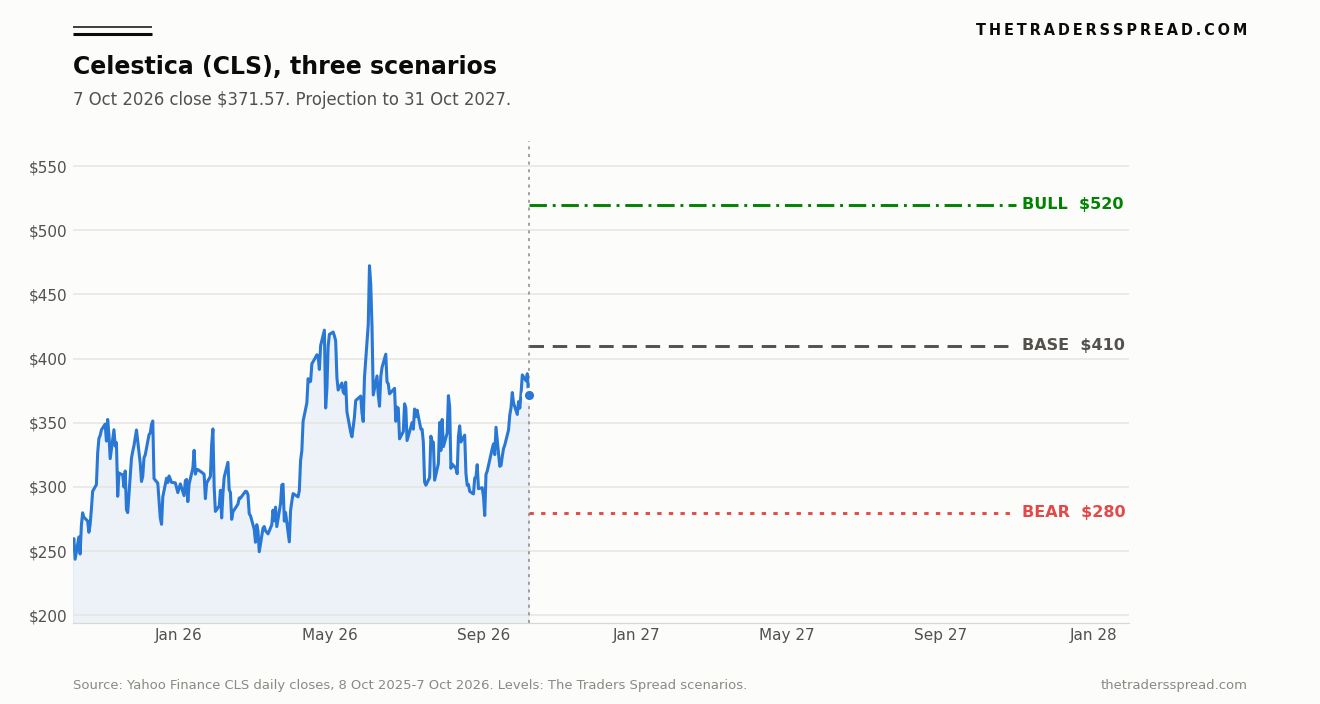 Daily closes through 7 October 2026. Bull, base and bear are ours.
Only the bull case is a price the shares have not already printed.
| Case | Price | Versus $371.57 | Multiple of the $11.30 outlook | What has to be true |
|---|---|---|---|---|
| Bull | $520 | About 40% above | 46.0 times | Q3 at or above the top of the range, plus a 2027 figure rather than a direction. |
| Base | $410 | About 10% above | 36.3 times | Q3 inside the guided range, and $20.5 billion and $11.30 left standing. |
| Spot | $371.57 | 7 October close | 32.9 times | 21% under the June closing high, about 34% above the 2 September low. |
| Bear | $280 | About 25% below | 24.8 times | Q3 revenue under $5.25 billion, a cut to the annual outlook, or a retreat from the 2027 line. |
$520 sits about 10% above the $474.03 session high. A 65% increase on $11.30 would be about $18.65 of adjusted EPS, and $520 would be roughly 28 times that figure. Management said growth would accelerate past 65%, and that adjusted EPS would outpace revenue. They did not publish $18.65. The figure is a check on the bull case, not guidance.
$410 lines up with the 30 April 2026 close of $409.59. The share is about 9% below that shelf now. Holding it into 31 October 2027 means regaining April without needing the June high, at 36.3 times the 2026 outlook, while the second half still has to deliver $11.754 billion.
$280 is a price the stock has already traded: $280.99 on 30 January and $277.77 on 2 September. At 24.8 times the 2026 outlook it is a compression from 32.9 times, not a return to the October 2025 closes near $244. It is what a miss under $5.25 billion looks like, or a cut to the annual outlook, or a market that treats the 1.4% cash yield as the binding number.
ASML's 74.5% rise in 2026, into its 14 October print, is a reminder that a hardware multiple can already contain a lot of the next year. Celestica's one-year gain is smaller. The shape of the problem is the same.
What 26 October has to clear
The 6 October notice says results come after the close on Monday 26 October 2026. The call is Tuesday 27 October at 8:00 a.m. Eastern, and it is also the investor and analyst day. A lunch forum in Midtown Manhattan follows for institutional investors and research analysts. The recording is due on the company site about two hours later.
Four comparisons matter more than the adjective on the call.
Revenue is read against $5.25 billion to $5.55 billion, and adjusted EPS against $2.88 to $3.08. The revenue midpoint, $5.40 billion, is about 15% above Q2. Inside the range, the annual arithmetic survives. Under $5.25 billion, the path to $20.5 billion breaks unless the fourth quarter is lifted in the same breath.
If $20.5 billion and $11.30 are unchanged, the implied fourth quarter is still about $6.20 billion to $6.50 billion of revenue. First-half adjusted EPS was $4.70, so $6.60 has to come in the second half. A third quarter at $2.88 leaves $3.72 for the fourth. A third quarter at $3.08 leaves $3.52. The company has not published either figure as its own range.
That remainder is not a published forecast.
RelatedPTC Inc. Stock Prediction: $205 Bull Case vs $144 Bear
The year is guided to an adjusted operating margin of 8.4%, against a Q2 high of 8.2%. A revenue beat with a margin miss would mean the extra dollars are thinner than the 2027 sentence needs, because that sentence needs adjusted EPS to grow faster than revenue. On cash, the second half has to produce about $315 million of free cash flow to hit $600 million, while gross capital spending was $625 million in the twelve months to June. July raised the cash outlook alongside the earnings outlook. A split decision in October would be new.
One seat on the call is new. From 1 October, Mandeep Chawla, chief financial officer since 2017, became group president of global markets, and Todd Ankenmann succeeded him as chief financial officer. The 27 October call is the first results call in that structure. The share closed at $346.55 on 11 September, the announcement day. The appointment does not rewrite the order book.
"Celestica is experiencing unprecedented growth, and as we look to the future, we are evolving our leadership structure to ensure we can scale effectively and continue delivering exceptional value to our customers and shareholders."
Mionis, chairman and chief executive, said that in the 11 September release. "Unprecedented" is his word for a book that had just grown 62% at the top line and 84% in CCS. The sentence explains a reorganization. It does not fill in the 2027 dollar the July release left blank.
What would change this view
The base case is $410 by 31 October 2027, about 10% above the 7 October close and in line with the 30 April close of $409.59. It is 36.3 times the $11.30 adjusted EPS outlook. It assumes 26 October lands inside the third-quarter ranges and that $20.5 billion and $11.30 stay put. It does not need the June closing high of $472.40 back.
The bull case is $520, about 40% above the close and 46.0 times the 2026 outlook. It needs a third quarter at or above the top of the range, and an analyst day that replaces the slope with a figure. A 65% step-up from $11.30 is about $18.65. At $520 that is about 28 times a number Celestica has not issued. Without that figure, $520 is a hope and $410 is the case the evidence supports.
The bear case is $280, about 25% under the close and 24.8 times the 2026 outlook. The 2 September close was $277.77, so this is a return to a low printed after the July raise, near the 30 January close of $280.99. It fits revenue under $5.25 billion, a cut to the annual outlook, or a retreat from the claim that 2027 growth accelerates past 65%.
The reference print is $371.57. The level that fails the lean is $280. The price this forecast holds is $410. Conviction is moderate because 32.9 times is already a full multiple and the second-half math is steep. The July outlook is the last set of numbers with the company's name on it.
A beat of the guided range, another raise to the full-year figures, and a 2027 number an investor can divide into a price would pull the base case toward $520. A miss of the $5.25 billion or $2.88 floors, a cut to $20.5 billion or $11.30, or softer language on acceleration would retire the lean. The lines that matter on 26 October are revenue, adjusted EPS, the annual outlook, and whether the fourth-quarter remainder is still standing the next morning.
Questions around this Celestica stock forecast
What is the Celestica stock forecast into October 2027?
The base case is $410 by 31 October 2027, about 10% above the $371.57 close of 7 October 2026. The bull case is $520 and the bear case is $280. The base case needs the October release inside company guidance and the $20.5 billion and $11.30 outlook intact. The bull case needs a 2027 dollar figure. The bear case is a return to prices already traded in January and early September.
When does Celestica report third-quarter 2026 results?
The company said on 6 October 2026 that results will be released after the close on 26 October. The call is at 8:00 a.m. Eastern on 27 October and is also the investor and analyst day. A lunch forum for institutional investors and research analysts follows in New York. July's guide for the quarter is revenue of $5.25 billion to $5.55 billion and adjusted EPS of $2.88 to $3.08.
What did Celestica guide for the full year 2026?
On 27 July the company set revenue at $20.5 billion, adjusted EPS at $11.30, adjusted operating margin at 8.4%, and free cash flow at $600 million. The prior set was $19.0 billion, $10.15, 8.1% and $500 million. Management called the new revenue and adjusted EPS figures 65% and 87% growth. The outlook assumes an adjusted tax rate near 20% and no repurchases or issuances for the rest of 2026.
Why is the share below the June high if growth is supposed to accelerate?
The acceleration line is about 2027, and it has no dollar on it. The share had already risen about 46% from the 8 October 2025 close before the latest drop, and the June closing high was $472.40. At $371.57 the multiple is 32.9 times the 2026 adjusted EPS outlook. The 2 September close of $277.77 shows a much lower price was already tested after the July raise, and then bounced.
What would push the share to the $280 bear case?
Revenue under $5.25 billion, a cut to the $20.5 billion or $11.30 outlook, or a retreat from the claim that 2027 growth accelerates past 65%. A free-cash-flow outlook that falls while the earnings outlook is only repeated would point the same way. $280 is about 25% under the 7 October close, and within a few dollars of the 2 September close, so it does not require a new crisis. It requires the bounce since that low to be given back.
This article is analysis, not a recommendation to trade Celestica or any other security. It is not personal advice. Prices, guidance and multiples can change, and capital is at risk. Non-GAAP figures are the company's and are not a substitute for GAAP results. Figures are tied to the source and date named beside them. Past prices are not a guide to the print after 26 October.