

ASML's Nasdaq shares closed 74.5% higher in 2026, at $1,867.31 on 2 October, and that same close still sits 6.1% under the $1,989.44 print of 30 June. The year-to-date gain and the hole under the high are one listing. A holder from the 31 December close of $1,069.86 is well ahead. Anyone who paid the June close is not. Both numbers are unadjusted closes from the same daily series, retrieved on 5 October before the US cash open, and neither is a view on where the shares go next.
The dollar price is the smaller of the two equity moves. In Amsterdam the ordinary share rose 79.4% in euros between those same dates, from €921.40 to €1,653.00, while the euro fell 4.5% against the dollar on the ECB reference rate, from 1.175 to 1.1225. A weaker euro trimmed the Nasdaq gain. It did not create it. Across the first half, China fell to 15.9% of net sales, from 24.1% a year earlier, even as the shares rerated.
Key facts
- Nasdaq ASML closed at $1,867.31 on 2 October 2026, up 74.5% from the $1,069.86 close on 31 December 2025. Source: Yahoo Finance chart API, unadjusted daily closes, retrieved 5 October 2026.
- The 30 June close was $1,989.44. The 29 July close was $1,550.69, down 22.1% from that June close, and the shares then rose 20.4% into 2 October. Source: same Nasdaq series, TTS calculation.
- Amsterdam ASML.AS closed at €1,653.00 on 2 October, up 79.4% from €921.40 on 31 December 2025. Source: Yahoo Finance chart API, retrieved 5 October 2026.
- The ECB euro reference moved from 1.175 dollars on 31 December 2025 to 1.1225 on 2 October 2026, a 4.5% decline. Source: frankfurter.dev, retrieved 5 October 2026.
- Second-quarter 2026 total net sales were €9,326 million, gross margin 54.0%, net income €2,918 million and basic earnings €7.59 a share. Source: ASML investor presentation, 15 July 2026, US GAAP.
- ASML guided third-quarter 2026 net sales to €11.0 billion–€12.0 billion and gross margin to 55%–57%, and full-year 2026 net sales to €43 billion–€45 billion with gross margin of 54%–56%. Source: ASML, 15 July 2026.
- China accounted for €2,883.3 million of first-half 2026 net sales, 15.9% of €18,093.4 million, against €3,712.3 million and 24.1% a year earlier. Third-quarter results are calendared for 14 October 2026. Source: ASML statutory interim report 2026.
Two listings, one company
The 74.5% is a Nasdaq price return from the 31 December 2025 close to 2 October 2026, not a total return and not the Amsterdam line. The first session did part of it: 2 January closed at $1,163.78, up 8.8% on the year-end print. From that close the rise into 2 October is 60.5%. The title uses the year-end anchor.
Yahoo's dividend-adjusted close for 31 December is $1,064.74. On that base the same 2 October close is a 75.4% gain. The gap is the dividend, not a second rally. This note stays with the quoted price, because that is what changed hands.
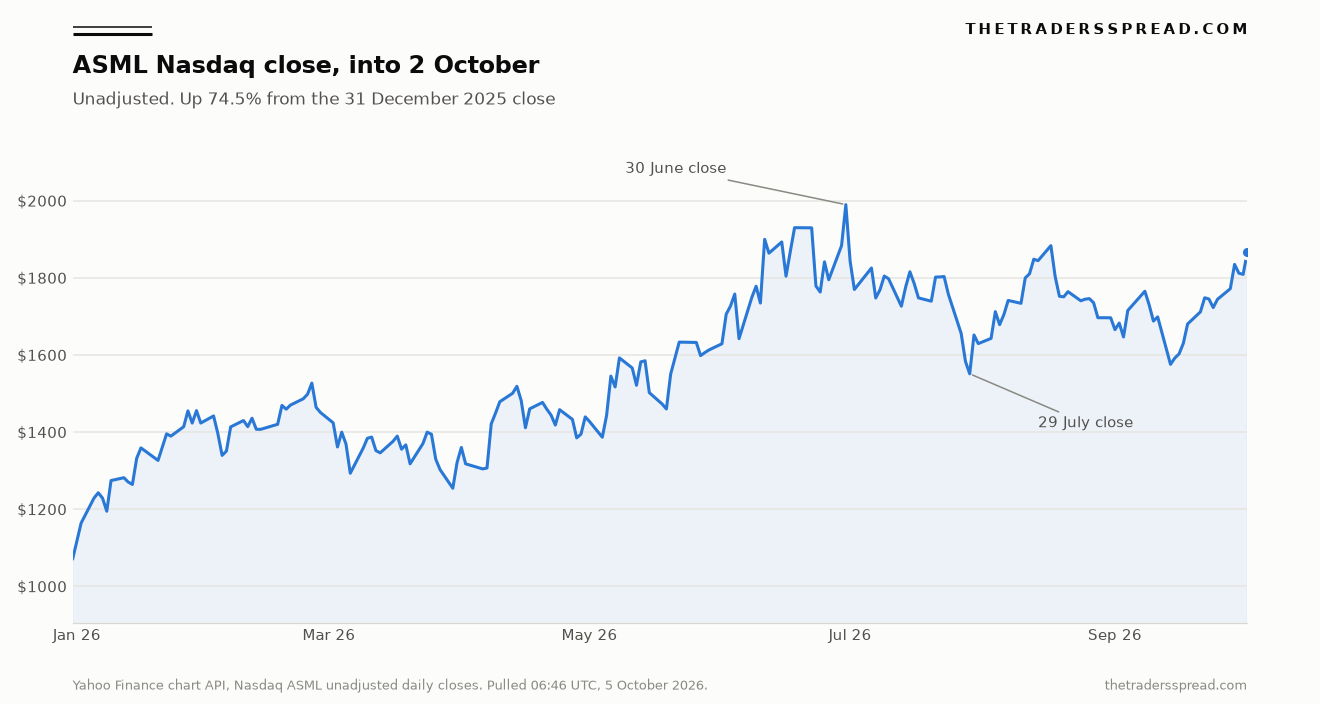
By 30 January the close was already $1,423.00, 33.0% above the year-end print. Nearly half the eventual year-to-date percentage was on the tape before February. March then gave ground. The 31 March close of $1,320.83 was still 23.5% up on the year and 7.2% under the 30 January close. Spring was a range, not a straight line.
| Window | Start | 2 October 2026 | Change |
|---|---|---|---|
| Nasdaq close from 31 Dec 2025 | $1,069.86 | $1,867.31 | +74.5% |
| Nasdaq close from 2 Jan 2026 | $1,163.78 | $1,867.31 | +60.5% |
| Nasdaq close from 30 Jun 2026 | $1,989.44 | $1,867.31 | -6.1% |
| Nasdaq close from 29 Jul 2026 | $1,550.69 | $1,867.31 | +20.4% |
| Amsterdam close from 31 Dec 2025 | €921.40 | €1,653.00 | +79.4% |
| ECB euro, dollars per euro | 1.175 | 1.1225 | -4.5% |
The rows are recomputed from pulls on 5 October 2026. Closes are unadjusted prints from the Yahoo Finance chart API for Nasdaq ASML and ASML.AS. The currency row is the ECB reference on frankfurter.dev. The two listings do not close at the same hour, so +74.5% against +79.4% is not a clean ECB translation. The euro fell. The local share rose more.
That pull, at 06:46 UTC, ended on the 2 October close. The session was up 3.3% from $1,808.49 the day before, and 3.1% from $1,811.67 on 30 September. The 6.1% gap to June is close to close, from $1,989.44, not from the $1,999.96 high that day.
China shrank in the half the stock rerated
The price and the regional mix did not move together. ASML's statutory interim report, for the six months ended 28 June 2026, puts total net sales at €18,093.4 million, up 17.2% from €15,433.2 million. The company states that 17.2% itself. China, inside that total, went the other way.
Sales attributed to China were €2,883.3 million, against €3,712.3 million in the first half of 2025. That is a 22.3% decline in euros, and a drop in share from 24.1% of the half to 15.9%. South Korea went from €4,413.6 million to €7,085.5 million, up 60.5%, and accounted for 39.2% of first-half 2026 sales. Taiwan rose 17.3% to €5,114.7 million, 28.3% of the half, almost exactly in line with the company-wide 17.2%. The United States was €1,939.6 million, 10.7%, against €1,942.8 million a year earlier. Flat.
| Region | H1 2025, € million | H1 2026, € million | Share of H1 2026 |
|---|---|---|---|
| South Korea | 4,413.6 | 7,085.5 | 39.2% |
| Taiwan | 4,361.9 | 5,114.7 | 28.3% |
| China | 3,712.3 | 2,883.3 | 15.9% |
| United States | 1,942.8 | 1,939.6 | 10.7% |
| Other regions | 1,002.6 | 1,070.3 | 5.9% |
| Total | 15,433.2 | 18,093.4 | 100% |
Geography is from the 2026 statutory interim report, under EU-IFRS. Shares are TTS calculations. "Other regions" is the residual: Japan, Singapore, EMEA and the rest of Asia. The US GAAP quarters sum to the same €18,093 million of sales. The 54.0% margin below is the US GAAP quarter, not an IFRS ratio.
Roger Dassen, chief financial officer, told the 15 July investor call something that does not match the half just printed. "Turning now to our China-related business: We continue to expect this to make up around 20 percent of our total net sales for the full year as it increases in line with the overall business, mainly related to an increased demand in mainstream Logic." The sentence is an expectation, dated that day, not a description of the €2,883.3 million already booked. The transcript is the Q2 2026 investor-call transcript.
Set that 20% against the sales range and the sum is uncomfortable. Twenty percent of a €44 billion midpoint is €8.8 billion. The first half contributed €2.9 billion, so the second half would have to deliver about €5.9 billion, a little more than twice the China figure already booked, if both statements held. Across €43 billion to €45 billion the second half is still roughly twice the first. Conditional arithmetic. Not a result.
The interim report does not say why China fell. Its risk language does name export controls: restrictions on shipments, including systems already ordered, and the need for licences to sell systems and services to certain customers. A lower share and a licence regime are both in the document. This note does not invent a causal line the company did not draw.
Where the euros went is plain. Korea and Taiwan together were 67.4% of first-half sales. China was 15.9%, and smaller than a year earlier. The share-price rerating lines up with the Korean jump more cleanly than with China.
What 15 July actually put on the page
The quarter the market already has is the second quarter, reported on 15 July, not the third. On a US GAAP basis in the 15 July investor presentation, total net sales were €9,326 million, against €7,692 million in the second quarter of 2025. That is 21.2% higher. Gross margin was 54.0%, against 53.7% a year earlier. Net income was €2,918 million, against €2,290 million, up 27.4%. Basic earnings were €7.59 a share, against €5.90. Lithography systems sold were 91, against 76.
Dassen said the quarter cleared the high end of ASML's own sales guidance because installed-base sales were €2.8 billion, almost €300 million above the guide, mostly from upgrades. Net system sales were €6.6 billion: €3.8 billion of EUV, including one High NA system, and €2.8 billion non-EUV. Logic was 51% and memory 49%. Gross margin beat the guide on high-margin installed-base parts. Research was €1.3 billion. Selling, general and administrative costs were about €0.3 billion.
Cash and short-term investments ended at €7.6 billion. Free cash flow, flagged in the transcript as non-GAAP, was €1.3 billion. ASML paid the final 2025 dividend of €2.70 a share in the quarter, taking the 2025 total to €7.50, and bought around 0.8 million shares for around €1.1 billion. The first 2026 interim dividend, €1.88, was payable on 5 August. Cash left the company for holders in the same quarter the share price was rebuilding the equity value. That is not a valuation.
The open guide is still the July one. Third-quarter net sales were put at €11.0 billion to €12.0 billion, installed base around €2.9 billion, gross margin 55% to 57%. Against €9,326 million just reported, that sales band is 18.0% to 28.7% above the second quarter, and the margin band starts a point above 54.0%. Full-year sales were raised to €43 billion to €45 billion, gross margin 54% to 56%.
Take out the first half and the year is a statement about what is left. €43 billion minus €18,093 million is €24.9 billion. €45 billion leaves €26.9 billion. The implied second half is 37.7% to 48.7% larger than the first. A third quarter of €11 billion to €12 billion is only the first slice. That is what the range still requires. It is not a claim that the midpoint arrives.
Christophe Fouquet, chief executive, tied the raised guide to customers and to output. "A number of our customers have revised their capital expenditure plans upwards for the year, and our ability to increase output has allowed us to meet their requests for additional lithography systems." He expected advanced-logic foundry net system sales to grow more than 25% this year and memory-related net system sales more than 75%. Dassen added an expectation of about 65 low-NA EUV shipments and EUV system sales up more than 45%. Those rates were spoken on 15 July, not as results. The only EUV unit count already in the accounts is one High NA system inside €3.8 billion of EUV sales.
Naga Chandrasekaran, executive vice president and general manager of Intel Foundry, is quoted in that presentation: "This milestone reflects the close technical collaboration between Intel and ASML and shows how High NA EUV can be integrated into advanced semiconductor manufacturing at scale." ASML said Intel Foundry is using High NA on the 18A process for a subset of Core Ultra Series 3 processors. One production insertion is not a third-quarter sales number.
Upstream of the wafers, the design-software names are a different business. Synopsys sells software used to design chips rather than the scanners that print them, and it is a separate note on this desk. The capex Fouquet described is the spending of the foundries and memory makers, not a single ticker.
June is still the high
From the 29 May close of $1,612.76 to $1,989.44 on 30 June the Nasdaq line rose 23.4% in a month. That month is the spike. The lowest close after it was 29 July, at $1,550.69, 22.1% under the June close. July ended at $1,629.00, still 18.1% under June, and September ended at $1,811.67.
The bounce off $1,550.69 is 20.4%, and it still leaves the Nasdaq close 6.1% under 30 June. Amsterdam gave back less: €1,721.40 on 30 June to €1,653.00 on 2 October, a 4.0% decline. The dollar line surrendered more of the high, which is what a weaker euro does. The year-to-date percentage describes neither path.
A reported quarter and a higher share price are different objects. On this desk, Jabil fell 10% after a fiscal fourth-quarter beat. The price can move before the number exists, and it can fall after the number is cleared. ASML's 74.5% is the first of those. The third-quarter sales figure is still the second.
What this changes
The rise is now a record. A release on 14 October cannot revise the 31 December close or the 2 October close. The statutory interim report calendars third-quarter results for that Wednesday. Nine days from this filing, it is the next company number with weight. It is context for the move. It is not a forecast of the print, and this note has no price on the other side of it.
RelatedCompare Lam Research (LRCX) Earnings, Line by Line
What changes is the status of the July bands: sales of €11.0 billion to €12.0 billion, gross margin of 55% to 57%. A quarter inside them would mean the step-up described in July had started. A quarter outside them would leave the 74.5% gain sitting beside a range the company set and then missed or cleared. Neither outcome, on its own, puts the shares through $1,989.44 or under $1,550.69. Sales and the closing price are different series.
China can move only part of the way in one quarter. The pack can show whether that region is still near the first-half pace, 15.9% of sales and down 22.3% in euros, or has turned up towards the "around 20 percent" Dassen used for the full year. Taken at face value, the full-year range plus that 20% still asks the second half for roughly twice the China revenue of the first. October cannot finish that sum.
Attribution does not need the print. A 79.4% gain in euros, beside a 4.5% drop in the euro, drops the idea that Nasdaq rose because the currency did. Korea up 60.5% and China down 22.3% drops the idea that the rerating was a China story. Left standing is a price that has capitalised leading-edge demand before the third quarter exists.
None of that is an instruction. No level here is a level to trade. ON Semiconductor is a different part of the chip chain, on its own note. The 74.5% does not travel with it.
Two outcomes would change that description, and neither is a target. Sales or margin outside the 15 July bands would put the year-to-date move next to a range that did not hold. China still shrinking, with the 20% line unchanged, would sharpen the tension. If the bands hold and China is higher, July was a fair sketch of the quarter. The closes stay the closes.
Questions the tape is already answering
How is the 74.5% calculated?
From the unadjusted Nasdaq close on 31 December 2025, $1,069.86, to the unadjusted close on 2 October 2026, $1,867.31. That is a price return. Yahoo's dividend-adjusted close for 31 December is $1,064.74, and the same end point is a 75.4% gain on that base. This piece uses the quoted price, because that is the print on the tape. Measured from the 2 January close of $1,163.78, the rise is 60.5%.
When does ASML report third-quarter results?
The 2026 statutory interim report lists 14 October 2026 as the date for third-quarter results. Those results had not been published when this article was filed on 5 October. The date is a calendar entry. It is not a statement of what sales or the margin will be. The bands issued on 15 July are still the last figures of that kind from the company.
What did ASML guide for the quarter and the year?
On 15 July the company put third-quarter total net sales between €11.0 billion and €12.0 billion and the gross margin between 55% and 57%. For the full year it raised net sales to between €43 billion and €45 billion, with a gross margin between 54% and 56%. Those are company ranges. They are not a result. This article does not adopt the top or the bottom of either band as a forecast of its own.
How large is China in the accounts?
In the first half of 2026 the statutory report attributes €2,883.3 million of net sales to China, 15.9% of €18,093.4 million. A year earlier China was €3,712.3 million, 24.1% of that half. On 15 July, Roger Dassen said the company still expected China to make up around 20% of full-year 2026 net sales. The half-year share and the full-year expectation are both on the record. They are not the same number.
Did a stronger euro produce the Nasdaq gain?
No. The euro fell. The ECB reference went from 1.175 dollars on 31 December 2025 to 1.1225 on 2 October 2026, down 4.5%. Over that window the Amsterdam ordinary share rose 79.4% in euros, more than the 74.5% rise in the Nasdaq price. A weaker euro narrows the dollar gain relative to the local one. It does not explain the rise.
Does this article set a price for ASML?
No. The 74.5% is a recorded move between two closes. There is no bull case, no bear case and no level at which this piece says the shares should trade. The 14 October release will add a quarter of sales and margin. It will not rewrite closes that have already printed. Whether that quarter lands inside the July ranges is a separate fact from the path of the price.
This article is analysis, not a recommendation to buy or sell ASML or any other security. Share prices fall as well as rise, and capital is at risk. Figures come from ASML's 15 July 2026 investor presentation and investor-call transcript, the company's 2026 statutory interim report, unadjusted Nasdaq and Amsterdam closes via the Yahoo Finance chart API retrieved on 5 October 2026, and ECB reference rates via frankfurter.dev for 31 December 2025 and 2 October 2026. Past moves are not a guide to future returns.