

The VIX is a single number made from S&P 500 option prices, turned into the market's expectation of how widely that index moves over the next 30 days and quoted as an annualized percentage. On the 6 October 2026 close it printed 15.01, down 0.51 point, or 3.29%, from 15.52 the session before. Cboe describes the index as 30-day forward-looking volatility conveyed by those option prices, and its methodology still notes that traders often call it the fear gauge. The nickname is the part that slips. A print near 15 does not say stocks are about to fall, and it does not say the index will travel 15% in a month. It says the options market is pricing about 15% annualized volatility over the next 30 days. What follows is the construction, the one-month arithmetic, the record beside the print, and what would change the reading. None of it is a trade.
Same-day cash trading closed the S&P 500 at 7,818.93, up 44.98 points, or 0.58%, from 7,773.95. In the Yahoo daily history used here, that was the first close above 7,800. The prior closing high was 7,798.99 on 13 August 2026, when the index traded to 7,816.70 intraday and did not finish there. On 6 October the cash session held the round number: the open and the low were 7,805.96, and the high was 7,844.52. A price and the width of the option distribution around it are different objects. Realized volatility over the 21 sessions into the close was about 10.2% annualized, so 15.01 still sits above the move just recorded. The nine-day index closed at 12.03, the October VIX future settled at 17.0818, and the three-month index closed at 17.64.
Two feed fields disagree with those closes and are not the print used here. Yahoo's chartPreviousClose, read on the morning of 7 October, showed 16.34 for the VIX and 7,670.84 for the S&P 500, the 30 September and 29 September closes. Cboe's VIX product page, data as of 8:15 p.m. on 6 October, shows the same 15.01 spot and 15.50 open, but it labels the previous close as 15.01 and the change as 0.00%. The Yahoo candle for 5 October closed at 15.52. This piece uses the daily closes, 15.01 against 15.52.
Key facts
- The VIX closed at 15.01 on 6 October 2026, down 0.51 point, or 3.29%, from 15.52. The session range was 14.96 to 15.54, and the open was 15.50. Source: Yahoo Finance ^VIX daily candle, 6 October 2026. Cboe's product page shows the same spot and open, data as of 8:15 p.m. that day.
- A desk reading of that print, 15.01 times the square root of 30/365, is 4.30%. Applied to the cash close, 4.30% of 7,818.93 is about 336 index points. This is an approximation, not a Cboe output. Source: calculation on the 6 October 2026 closes.
- The S&P 500 cash close of 7,818.93 was the first close above 7,800 in the Yahoo daily history pulled here. The prior closing high was 7,798.99 on 13 August 2026. Source: Yahoo Finance ^GSPC daily closes, pulled 7 October 2026.
- Across 9,260 daily VIX closes from 2 January 1990 through 6 October 2026, the mean was 19.4 and the median 17.6. About 32% finished at or below 15.01. The highest close was 82.69 on 16 March 2020. The lowest was 9.14 on 3 November 2017. Source: Yahoo Finance ^VIX daily history, pulled 7 October 2026.
- The standard VIX future expiring 21 October 2026 settled at 17.0818, about 2.07 points above the spot close. Cboe sets that contract's multiplier at $1,000 a point. Source: Cboe futures quotations for 6 October 2026 and the VX specifications.
- Over 21 close-to-close sessions from 4 September through 6 October 2026, annualized realized volatility of the S&P 500 was 10.2%. Source: calculation from Yahoo Finance ^GSPC daily closes, pulled 7 October 2026.
How the strip becomes one number
Cboe's methodology does not average a few at-the-money implied volatilities and publish the mean. It replicates the fair value of a variance swap from a strip of option prices, then scales the result. The current document lays the work out in four steps.
First, the options. The universe is AM-settled SPX contracts and PM-settled SPXW weeklies, Friday expirations only. The weekly that lands on the standard monthly date is left out so it is not counted twice. From that list Cboe brackets a near term and a next term around 30 days. The futures contract specification still describes the inputs as Friday SPX options with more than 23 days and less than 37 days to expiration.
Second, the rate. Cboe takes US Treasury constant-maturity yields and fits a cubic spline, so each expiration can have its own risk-free rate.
Third, quotes become a variance. Each included strike is priced at the midpoint of the bid and the ask. Out-of-the-money puts are used below the forward and out-of-the-money calls above it. The strike at the forward contributes both. The forward is implied by the options, not copied from the cash index. Each strike is weighted by the gap to its neighbors and divided by the square of the strike, so a given premium matters more at lower strikes. The output is a variance for each expiration, not yet the VIX.
Fourth, Cboe blends the two variances to 30 days, takes the square root, and multiplies by 100. A calculated volatility of 0.1501 becomes a reading of 15.01. The methodology points to a 1999 Goldman Sachs note by Kresimir Demeterfi, Emanuel Derman, Michael Kamal, and Joseph Zou for the replication underneath. An appendix sample is not the 6 October market. The 15.01 here is the published close.
Lower strikes punch above their premium, because the weight divides by the square of the strike. The last step takes a square root, so the VIX is a volatility, not a variance. Reading 15 as "15% this month" answers a question the index did not ask.
What 15.01 says about the next month
Desks often want a simpler scale than the full strip. The one used here multiplies the annualized print by the square root of 30/365. It is a desk approximation. Cboe does not publish it, and it is not a stand-in for the four steps above.
The arithmetic is short enough to check. Divide 30 by 365 and the result is 0.08219. The square root of 0.08219 is 0.2867. Multiply by the close: 15.01 times 0.2867 equals 4.30. That is a rough one-standard-deviation move of 4.30% over 30 calendar days. Applied to the cash close, 7,818.93 times 0.0430 is 336 index points, about 336 points either side of 7,818.93, not a 336-point high-to-low range.
The trading-day cousin is close. Using 21 sessions and a 252-day year, 15.01 times the square root of 21/252 is 4.33%. The shortcut still leaves out the shape of the strip, the rate, and the forward adjustment.
On the same shortcut, one VIX point is about 0.29 percentage point of 30-day move, or roughly 22 S&P 500 points at 7,818.93. The listed future prices a point in dollars. The two meanings should not be mixed.
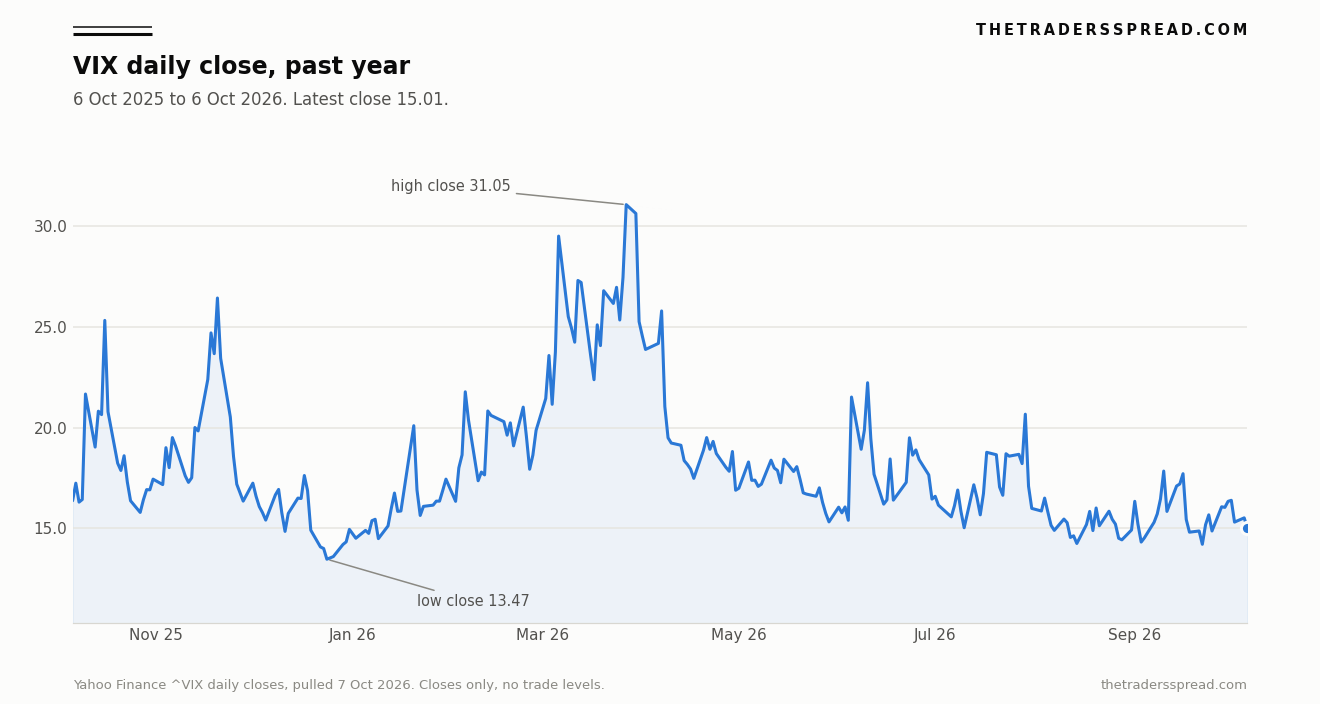
The chart is daily closes only, with no scenario lines. From 6 October 2025 through 6 October 2026 the close ran from 13.47, on 24 December 2025, to 31.05, on 27 March 2026. Twenty-eight of the 254 closes finished at or below 15.01.
| Measure | 6 Oct 2026 | Window |
|---|---|---|
| S&P 500 realized volatility, 21 sessions | 10.2% | Backward. Root-mean-square of close-to-close log returns, annualized with the square root of 252. |
| VIX9D | 12.03 | Forward, about nine days. Yahoo daily close of the Cboe index. |
| VIX | 15.01 | Forward, 30 days. |
| VX October future, settlement | 17.0818 | Expires 21 October 2026. Cboe settlement. |
| VIX3M | 17.64 | Forward, three months. Yahoo daily close. |
| VIX6M | 19.84 | Forward, six months. Yahoo daily close. |
| Cboe SKEW | 141.21 | Shape of the 30-day distribution, not a volatility level. |
Read down the column and the curve rises. Realized volatility is the lowest figure, then the nine-day index, the 30-day VIX, the October future, the three-month index, and the six-month index. SKEW does not belong on that scale. Cboe describes it as an estimate of how skewed S&P 500 returns look at a 30-day horizon, typically ranging from 100 to 150, with a higher reading meaning a heavier left tail. At 141.21 the tail is priced on a day the volatility level was low.
A high index beside a low print
The 6 October close of 7,818.93 sits 19.94 points, about 0.26%, above the 13 August closing high of 7,798.99. The desk translation of the VIX is a band of about 336 points, so a record close can sit inside a routine 30-day distribution. A separate note on this site follows the index level.
From 2 January 1990 the highest close in the Yahoo series is 82.69, on 16 March 2020, and the highest intraday print in that series is 89.53, on 24 October 2008, a session that closed at 79.13. The lowest close is 9.14, on 3 November 2017. A reading of 15.01 is 4.4 points under the mean of 19.4 and about 2.6 points under the median of 17.6. The past year is tighter. The average close was 18.1, the median 17.2, and only 28 of 254 sessions, 11%, finished at or below 15.01. Cboe's 52-week high of 35.30 was an intraday print on 9 March 2026, a session that closed at 25.50. The 52-week low of 13.38 was an intraday print on 24 December 2025, a session that closed at 13.47.
Over the 252 sessions from 6 October 2025 through 6 October 2026, the correlation between the daily VIX point change and the daily S&P 500 log return was -0.82. On 135 up days the VIX fell by 0.88 point on average. On 117 down days it rose by 1.01 point. That calculation, from Yahoo closes pulled on 7 October 2026, is a tendency, not a law. The index made its closing high on a day the VIX fell.
Who uses the number
The spot VIX cannot be held. Futures and options written on the methodology are what trade. Cboe calls the tendency of index variance and the cash index to move in opposite directions well documented, which is the correlation above.
Cboe Futures Exchange lists standard VIX futures and weekly expirations beside the monthly cycle. The standard multiplier is $1,000, so one index point changes that contract's value by $1,000. On 6 October the October future expiring 21 October settled at 17.0818, November at 17.6375, and December at 18.1615. The 2.07-point gap between the October settlement and the 15.01 spot close is about $2,070 of difference in level, a gap between a spot fix and a later-dated future.
Variance sellers stand on the other side of that market. Cboe's product material says index options have tended, over long periods, to price a bit more uncertainty than the S&P 500 then realized. The live sketch is 15.01 forward against 10.2% realized over the prior 21 sessions. The windows do not match, so the 4.8-point gap describes a premium, not a result owed over one month.
The VIX is an index strip. A company can move hard on its own numbers while the index option market stays quiet. Jabil's post-earnings session and Accenture's reaction to its quarter are recent examples on this site of single-name days an index reading does not describe.
Mandy Xu, head of derivatives market intelligence at Cboe Global Markets, put the hedging point plainly on 30 September 2026, when the index was still near 16. Speaking by phone, in an account Bloomberg gave the Financial Post, she said: "Given how depressed index volatility is with the lack of hedging activity, it suggests a potential for a sharper pullback in the broader stock market in the coming weeks and months on any negative, unexpected headline or catalyst." The sentence is about positioning, and it predates the 15.01 close. It is not a timetable.
RelatedSynopsys (SNPS) Stock Forecast: $620 Bull vs $410 Bear
The calendar draws a different caution. Evan Frazier, CFA, CAIA, senior research analyst at Marquette Associates, wrote on 5 October 2026 that October's reputation for volatility is only partly in the averages. "These data points suggest that at least part of October's spooky reputation is attributable to exogenous market shocks rather than a predictable seasonal effect specific to the month itself." The 89.53 intraday print on 24 October 2008 is the kind of shock he means. A month's average is not a forecast for the next session.
What would change this reading
The 15.01 close describes one strip on one afternoon. A few developments would make that headline a poor summary. None of them is a price target.
The October future already sits 2.07 points above the close. If that settlement moved materially further above a spot print that stayed near 15, the listed market would be repricing the next few weeks faster than the 30-day strip. If the future fell back toward the spot print, the near-dated premium would be compressing. SKEW at 141.21 still prices a left tail inside Cboe's usual 100 to 150 band. A rise toward the top of that band, with the VIX still near 15, would mean more expensive wings without a move in the headline. A fall toward 100 would mean the priced skewness was fading.
The nine-day index closed at 12.03, almost three points under the 30-day reading. If it jumped through the VIX while the 30-day print barely changed, something nearer than a month would be getting repriced. Earnings weeks do this often, because demand crowds into one or two Fridays. About 10.2% realized against 15.01 implied is a premium of roughly 4.8 points, on windows that do not match. If later realized volatility rose toward the implied print, the premium would be shrinking in hindsight. If realized volatility stayed near 10 while the VIX fell further, the reading would be getting calmer still. On 9 March the VIX traded at 35.30 and finished at 25.50. The 6 October range, 14.96 to 15.54, describes that session only.
Questions the print keeps attracting
What is the VIX?
The VIX is Cboe's volatility index on the S&P 500. It prices Friday-expiration SPX and SPXW options around a 30-day horizon, turns those prices into two variances, blends them to a constant 30 days, and quotes the square root times 100. A close of 15.01 means about 15% annualized volatility over the next 30 days. It is not a forecast that the index rises or falls, and the spot reading cannot be held.
Is 15 high or low?
Against the past year, 15.01 is low. Only 28 of 254 daily closes from 6 October 2025 through 6 October 2026 finished at or below it, and the average close was 18.1. Against the longer record it is less unusual. From January 1990, about 32% of 9,260 daily closes were at or below 15.01, the median was 17.6, and the mean was 19.4. Low for this year. Ordinary across three decades.
How is this different from realized volatility?
Realized volatility is what the S&P 500 has already done. Here that is the annualized root-mean-square of 21 close-to-close log returns from 4 September through 6 October 2026, which came out at 10.2%. The VIX is the price of the next 30 days, and it closed at 15.01. One window looks back and one looks forward, so the gap of about 4.8 points describes a premium. It is not evidence the premium will be earned.
What does one VIX point mean?
The answer depends on the translation. On the desk approximation here, one point is the square root of 30/365, about 0.29 percentage point over 30 calendar days, or roughly 22 S&P 500 points at 7,818.93. On the listed future, the standard multiplier is $1,000, so one point changes the contract value by $1,000. Neither figure is Cboe's published formula, and neither is an instruction.
Why is the future above the spot print?
The October VIX future settled at 17.0818 on 6 October, about 2.07 points above the 15.01 close, with November and December higher still. A future is a price for volatility on a later date, not a copy of today's index. An upward slope is what a calm spot print often looks like in the listed market. The news would be a jump in that future while the spot print stayed flat.
This is analysis, not a recommendation. The VIX describes a strip of option prices. It does not instruct anyone to take a position in the index, in options, or in futures, and a print near 15 is not a promise about the next 30 days. Capital is at risk. Figures are the 6 October 2026 closes unless a sentence gives another date, drawn from Yahoo Finance daily history and from Cboe pages opened on 7 October 2026.