

Applied Materials (AMAT) closed Friday 16 October at $409.29, 19.3% below the $507.03 close on 9 October, and that print was the ninth lower close in a row. Three days earlier, in San Francisco, the same company said the AI infrastructure buildout was opening a new era of growth for wafer-fab equipment. Gary Dickerson, president and chief executive, attached a number: more than two percentage points of equipment-market share by 2030. Those two facts do not sit together. A supplier does not usually post a week this sharp in the same week it asks holders to underwrite a five-year case. Either the 2030 targets are being discounted harder than the breakfast allows, or the week never touched the order book. The tape cannot say which. Friday alone was a 4.8% drop from $430.01.
The press release leaves out the comparison that matters. The PHLX Semiconductor Index finished 9 October at 12,572 and 16 October at 11,137 on EODData's printed closes, a fall of 11.4%. Applied fell 19.3% over that same Friday-to-Friday window, about eight percentage points more than the basket. Equipment names are supposed to be the geared expression of chip demand. This week the gearing ran the wrong way, and harder in the toolmaker than in the index. The market marked the firm that sells the tools down faster than the firms that purchase them, in the week Applied asked to be valued on share it does not book until 2030.
Key facts
- Cash close $409.29 on 16 October, down 4.82% from $430.01, with an after-hours print of $409.75 — StockAnalysis quote, 16 October 2026, retrieved 17 October 2026
- Week window: $507.03 on 9 October to $409.29 on 16 October, a decline of 19.3% — StockAnalysis daily history, retrieved 17 October 2026
- Ninth straight lower close, and 24.5% below the 5 October close of $542.28 — same daily history
- PHLX Semiconductor Index from 12,572 on 9 October to 11,137 on 16 October, down 11.4% — EODData printed closes, retrieved 17 October 2026
- Standing fourth-quarter guide: revenue $10.25 billion plus or minus $500 million, non-GAAP diluted EPS $4.02 plus or minus $0.20 — Applied Materials earnings release, SEC Exhibit 99.1, 13 August 2026
- 13 October targets: more than 2 points of wafer-fab equipment share from 2025 to 2030, non-GAAP gross margin about 54%, operating margin about 40% — Applied Materials via GlobeNewswire, 13 October 2026
- EPIC spending expected to scale over time towards about $5 billion, in a 600,000-square-foot Sunnyvale building — Applied Materials via GlobeNewswire, 12 October 2026
Nine sessions, and a breakfast in the middle
Tuesday was the tell.
The losing streak did not start at the breakfast. StockAnalysis daily closes are lower on every session from 6 October through 16 October. Before that run, the 5 October close was $542.28. From there to $409.29 is 24.5%. Inside the week named in the headline, the path was a staircase.
Monday 12 October closed at $497.53, down 1.87% from Friday's $507.03. Tuesday 13 October, the SEMICON West breakfast in San Francisco, closed at $464.24, down 6.69%, the largest drop of the nine, on 10.7 million shares. Wednesday 14 October printed $446.63, down 3.79%. Thursday 15 October printed $430.01, down 3.72%, on 12.1 million shares, the heaviest volume of the streak. Friday 16 October opened at $420.26, traded from $407.26 to $426.81, and closed at $409.29, down 4.82%, on 8.5 million shares. At 7:59 p.m. Eastern the after-hours indication was $409.75, up 0.11%. The cash week was not repaired after the bell.
The index did not match Tuesday. EODData prints the PHLX Semiconductor Index, as a whole number, at 12,237 on 12 October and 12,209 on 13 October: a 0.2% dip against Applied's 6.69%. Thursday the index fell 0.9%, from 11,684 to 11,581, while Applied fell 3.72%. Friday they fell together, the index from 11,581 to 11,137, or 3.8%, and Applied 4.82%. Across the week the index is down 11.4% and Applied 19.3%. The asymmetry is concentrated on the breakfast day, then it persists, smaller, into Friday.
A nine-session run also changes what one higher close would mean. It would break a streak. It would not put $409.29 back in the early-October range, and it would not restore 30 June. The file is the constraint.
The 19.3% against the SOX print
The chart is the daily close from 1 May through 16 October 2026. No forward levels are drawn. The peak in the window is the 30 June close of $723.00. The right-hand dot is 16 October. 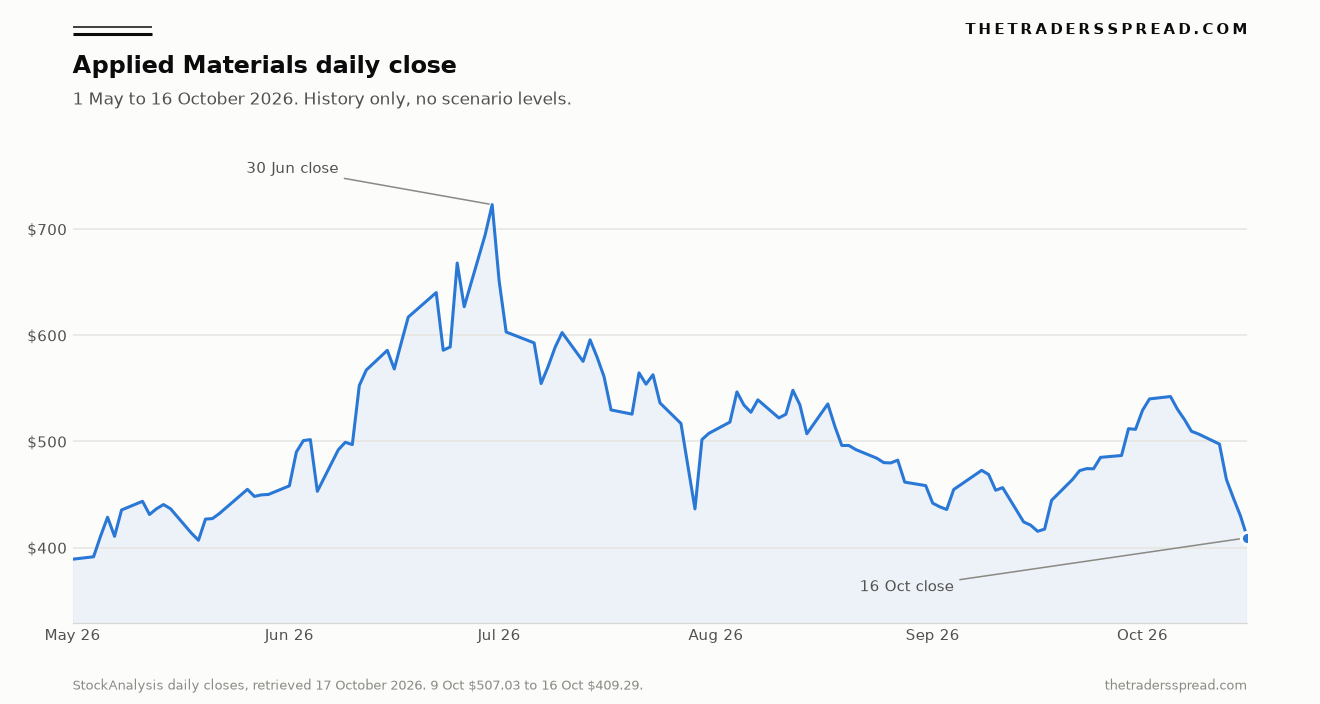
From that June close to Friday is a 43.4% drawdown. From the 31 December 2025 close of $256.99, the same Friday print is still a 59.3% gain. Both percentages use only StockAnalysis closes. A mark-to-year is a large gain. A mark-to-high is a large loss. A mark-to-week is 19.3%. None of those frames cancels the others, which is why a single adjective for the stock does not survive the file.
The 52-week band on the 16 October quote is a different object. StockAnalysis lists $203.40 to $739.67. The upper figure is the service's 52-week high, not a close this desk can point to in the daily history. The highest close in the one-year file is $723.00 on 30 June. Treating $739.67 as a close would overstate the drawdown. This piece uses $723.00.
| Session | AMAT close | AMAT day | SOX close | SOX day |
|---|---|---|---|---|
| 9 October | $507.03 | -0.50% | 12,572 | |
| 12 October | $497.53 | -1.87% | 12,237 | -2.7% |
| 13 October | $464.24 | -6.69% | 12,209 | -0.2% |
| 14 October | $446.63 | -3.79% | 11,684 | -4.3% |
| 15 October | $430.01 | -3.72% | 11,581 | -0.9% |
| 16 October | $409.29 | -4.82% | 11,137 | -3.8% |
AMAT daily percentages are the change field on the StockAnalysis history. SOX closes are EODData's printed whole numbers, and the SOX daily percentages are this desk's arithmetic on those prints, retrieved 17 October 2026. The index feed is rounded, so that column is a comparison, not a penny-exact official settlement. The direction does not depend on the rounding. Applied's breakfast-day drop was a multiple of the index move.
Lithography was on a different clock. A 5 October piece recorded ASML up 74.5% in 2026 into its 14 October print. That is another company, and this article assigns ASML no Friday move. A 6 October note had already set out what a 5.31% US 10-year yield does to prices. Nothing here says that yield was still 5.31% on 16 October.
What Applied put on the record
The 13 October release, carried by GlobeNewswire from San Francisco, is the company's account of the breakfast. It is not a price note. Wafer-fab equipment spending, it says, should grow faster through 2030 than over the past decade. Share should rise by more than two percentage points between calendar 2025 and 2030. Non-GAAP gross margin is targeted near 54%, non-GAAP operating margin near 40%. Over time, 80 to 100 percent of free cash flow is to be distributed.
"The global buildout of AI infrastructure is driving a new era of growth for wafer fab equipment," said Gary Dickerson, president and chief executive of Applied Materials, in that release.
The same text is more specific than the slogan. Leading-edge foundry-logic, DRAM and advanced packaging are expected to drive around 75% of wafer-fab equipment growth from 2025 to 2030, and Applied says it holds strong number-one process equipment positions in all three. The eBeam portfolio is expected to generate $2 billion of revenue in calendar 2026. Service revenue is expected to grow more than 20% this calendar year and to exceed $12 billion by 2030, described as a mid-teens compound rate. The firm says it is investing to more than double R&D lab and manufacturing capacity from current levels by 2030, with manufacturing already expanded in Austin, Singapore and Treviso.
"For the past 10 years, Applied Materials has been making strategic investments to build the industry's most enabling portfolio for AI computing," said Brice Hill, senior vice president and chief financial officer of Applied Materials, in the same release.
The 2030 margins are non-GAAP. Applied says the future adjustments cannot be predicted, so there is no GAAP bridge to 54% or 40%. Free cash flow, as defined in the release, is cash from operations minus capital expenditure. The forward-looking statement names interest rates among the ways the path can break. The shares fell 6.69% the day that list was published.
The day before, Applied unveiled the Equipment and Process Innovation and Commercialization Center on its Sunnyvale campus. The 12 October release calls it a $5 billion capital investment and the largest facility of its kind for collaborative process technology and equipment R&D. The footnote keeps the figure honest: spending is expected to scale over time to approximately $5 billion as customer projects commence. It is a path, not a cheque dated 12 October. The building is 600,000 square feet, with nearly four acres of cleanroom and more than six million construction hours.
"EPIC is the only place where materials, process technology and equipment will be innovated in parallel," said Dr Prabu Raja, president of the Semiconductor Products Group at Applied Materials, in that unveiling release.
Founding chipmaker partners named that day are TSMC, Intel, Samsung Electronics, Micron and SK hynix, alongside Broadcom, Advantest, SCREEN, KIOXIA, Besi and five universities. On 13 August the earnings release had put EPIC partnerships at 11 engagements. On 13 October the count was 15. The share price did not pay for the addition. TSMC is on that roster, which is why a separate note, TSMC down 3.4% ahead of its own print, sits beside this story and does not become it.
A record quarter, then the giveback
On 13 August, in the earnings release filed as Exhibit 99.1, Applied reported the quarter ended 26 July 2026. Headline revenue was a record $9.12 billion. The table shows $9,115 million, up 25% from $7,302 million. GAAP gross margin was 50.3% and non-GAAP gross margin 50.4%. GAAP operating income was $3.08 billion. Diluted earnings per share were $3.17 on a GAAP basis and $3.50 non-GAAP. Cash from operations was $3.04 billion, and $860 million went to shareholders, $440 million in repurchases and $420 million in dividends.
"We are further raising our Semiconductor Systems revenue expectations for calendar 2026 and are confident we will grow faster than the market this year," Dickerson said in that August release. "Based on the increased demand visibility we are receiving from our customers, we expect another strong growth year for Applied Materials in 2027." He also called the quarter the highest sequential revenue growth in the company's history. That sentence is two months older than the breakfast, and the week did not erase it. It put a lower multiple on it.
Semiconductor Systems revenue was $7,040 million: 67% foundry, logic and other, 26% DRAM, 7% flash. Applied Global Services revenue was $1,781 million, against $1,463 million a year earlier, up 21.7%. One quarter is not a calendar year. It does sit next to the later claim of more than 20% service growth in calendar 2026, on the way above $12 billion by 2030. August's 50.4% non-GAAP gross margin is the base a 54% target has to climb from.
In the quarter ended 26 July, United States revenue was $1,367 million, 15% of sales, up from $683 million and 9%. China was $2,506 million, 28%, against $2,548 million and 35%. Taiwan was $2,025 million, 22%, and Korea $1,521 million, 17%. China is still the largest line, and a smaller share than a year ago. Cash and equivalents were $7,037 million, with $2,196 million of short-term investments. The August release also recorded a US$500 million Tampines campus in Singapore.
The quarterly guide issued that August day is the number the week did not replace. Fourth-quarter fiscal 2026 revenue was expected at $10,250 million, plus or minus $500 million, and non-GAAP diluted earnings per share at $4.02, plus or minus $0.20. Applied said the earnings figure excludes $0.01 of known acquisition charges, includes $0.01 from the normalised tax benefit of share-based compensation and $0.05 from intra-entity intangible transfers, and does not reflect items unknown at the time. The third quarter ended 26 July, so 16 October sits inside the quarter that guide describes. By the Friday close, the quarter had not been reported.
RelatedJohnson & Johnson (JNJ) Forecast: $270 Bull vs $220 Bear
"We expect continued strong revenue growth in the second half of the calendar year, particularly in DRAM as well as leading-edge foundry-logic and advanced packaging," Hill said on 13 August. DRAM was 26% of Semiconductor Systems revenue, up from 22% a year earlier. October added the share-gain points, the margin pair and the free-cash-flow range. It did not add a new quarterly revenue number.
What this changes
The week changes the burden of proof, not the existence of a target. Applied now wants more than two points of equipment share by 2030, non-GAAP margins near 54% and 40%, service revenue above $12 billion, and a distribution of 80 to 100 percent of free cash flow, while doubling capacity and letting EPIC spending scale towards $5 billion as projects start. Those claims share one cash flow. A high distribution rate and a heavy build are not free companions. The 16 October close says the equity did not capitalise both at the prior week's price.
The August range is not void because the shares fell. Revenue of $10.25 billion, plus or minus $500 million, describes the quarter that contains this week. A later print inside $9.75 billion to $10.75 billion would mean the argument was about the multiple, and about how far out 2030 sits. A print outside that band would mean the August sentence and the October tape had started to agree. Neither is knowable from Friday. The breakfast did not restate the range, and this piece does not invent a dealing level for either result.
Nine lower closes, a 24.5% slide from 5 October and a 43.4% slide from 30 June, are the base the next session is judged against. One higher close would end the streak and leave those drawdowns in place. What would change the reading is where fourth-quarter revenue lands, whether service growth still tracks the calendar-year line, and whether the DRAM and logic mix Hill described in August is still the mix. The same week, financing for the buildings these tools are meant to fill was already on the tape: CoreWeave fell 15.5% as a 2031 yield neared 16%. Applied sells the equipment. It does not fund the buildings. Tuesday's 0.2% SOX move and Friday's 3.8% index drop can both be true. Any update now has to beat a 19.3% week and targets published into the decline, not before it.
Questions the week's file actually answers
How much did Applied Materials fall in the week to 16 October?
The cash close on 9 October was $507.03 and the cash close on 16 October was $409.29. The difference is 19.3%. Both figures are daily closes from StockAnalysis, retrieved on 17 October 2026. The window is the five sessions from Monday 12 October through Friday 16 October, measured from the prior Friday. It is a recorded move, not a range around an intraday low.
Was Friday the whole decline?
No. Friday was a 4.82% drop, from $430.01 to $409.29. The largest daily drop of the week was Tuesday 13 October, down 6.69% to $464.24, the day of the SEMICON West breakfast. The shares also closed lower on 12, 14 and 15 October. Friday extended a run of lower closes that had started on 6 October. The after-hours print of $409.75 did not give the cash decline back.
What did management commit to on 13 October?
In the GlobeNewswire release that day, Applied said wafer-fab equipment spending should grow faster through 2030 than over the past decade, and that it is targeting more than two percentage points of share gain from calendar 2025 to 2030. It set non-GAAP targets near 54% gross margin and 40% operating margin, and said 80 to 100 percent of free cash flow would be distributed over time. Those are company targets. They are not a price level for the shares.
How does $409.29 compare with June and with the start of 2026?
The highest close in the one-year daily file is $723.00 on 30 June 2026. From that close to 16 October the decline is 43.4%. From the 31 December 2025 close of $256.99, the share is still up 59.3%. The 52-week band on the 16 October quote, $203.40 to $739.67, is the service's high-low range, not a pair of closes. A bad week and a strong year are both in the file.
Did the week replace the August revenue outlook?
It did not. On 13 August the company said fourth-quarter fiscal 2026 revenue was expected at $10.25 billion, plus or minus $500 million, with non-GAAP diluted earnings per share of $4.02, plus or minus $0.20. The 16 October session falls inside that quarter, which had not been reported by the Friday close. The breakfast did not restate the quarterly revenue figure. The range stands until Applied replaces it.
Is the EPIC Center a $5 billion cash outlay already spent?
The 12 October release calls EPIC a $5 billion capital investment and then qualifies it. A footnote says spending is expected to scale over time to about $5 billion as customer projects commence. The building is described as 600,000 square feet on the Sunnyvale campus, with nearly four acres of cleanroom. The figure is a planned scale, not a single payment dated 12 October, and it sits beside the pledge to return most free cash flow over time.
This article is analysis, not advice. It records prices, a company release and an SEC exhibit as retrieved on 17 October 2026. It is not a recommendation to deal in Applied Materials or any other security. Capital is at risk. Figures the company labels as targets or outlook are forward-looking statements under its own caution. This desk does not publish a dealing level for the shares.