

Treating Walmart as a pure read on US same-store sales misses the accounts that actually moved in the latest reported quarter. For the three months ended 31 July 2026, Walmart US comparable sales on the retail calendar, excluding fuel, rose 2.6%, with transactions up 1.5% and average ticket up 1.1%. eCommerce contributed about 510 basis points to that comp, a larger number than the comp itself, so the rest of the comparable-sales arithmetic was a drag even while traffic and ticket both rose.
Consolidated net sales were $186,100 million, up 5.9% from $175,750 million, with about $1,500 million of the increase from currency. Operating income rose 28.8% to $9,383 million, a gain of $2,097 million, while about $2,900 million of tariff refunds were booked as a reduction to cost of sales. Diluted earnings per share fell to $0.80 from $0.88 as other gains and losses swung from a $2,708 million gain to a $1,200 million loss. Traffic, margin and earnings pointed three ways in one quarter, on the Form 10-Q filed on 28 August 2026 and the earnings release filed on 20 August 2026.
Updated 2 November 2026.
Key figures from the latest accounts
- Walmart US comp sales on the 13-week retail calendar, excluding fuel, rose 2.6% in the quarter ended 31 July 2026, with transactions up 1.5% and average ticket up 1.1%. Source: Walmart Q2 fiscal 2027 earnings release, 20 August 2026.
- eCommerce contributed about 510 basis points to that Walmart US comp, against a 2.6% comp. Source: Walmart earnings release, 20 August 2026.
- Consolidated net sales were $186,100 million, up 5.9%, and operating income was $9,383 million, up 28.8%. Source: Walmart Form 10-Q for the quarter ended 31 July 2026, filed 28 August 2026.
- Tariff refunds of about $2,900 million were recorded as a reduction to cost of sales, primarily in Walmart US. Source: Walmart Form 10-Q, filed 28 August 2026.
- Diluted earnings per share were $0.80, against $0.88 a year earlier. Adjusted earnings per share were $0.81, against $0.68. Source: Walmart earnings release, 20 August 2026.
- The fiscal 2027 annual dividend is $0.99 a share, paid in four installments of $0.2475. Cash dividends paid in the six months ended 31 July 2026 were $3,945 million. Source: Walmart Form 10-Q, filed 28 August 2026.
- The Walmart common share closed at $123.51 on 30 October 2026 on Nasdaq. Source: StockAnalysis WMT quote, retrieved 07:21 UTC on 2 November 2026.
Where the share has traded
The chart is the daily close from 30 October 2025 through 30 October 2026, pulled from StockAnalysis at 07:21 UTC on 2 November 2026. The window opens at $102.23 and closes at $123.51, a rise of 20.8%. The high print is $135.155 on 19 May 2026 and the low print is $98.88 on 14 November 2025, matching the quote endpoint’s 52-week range.
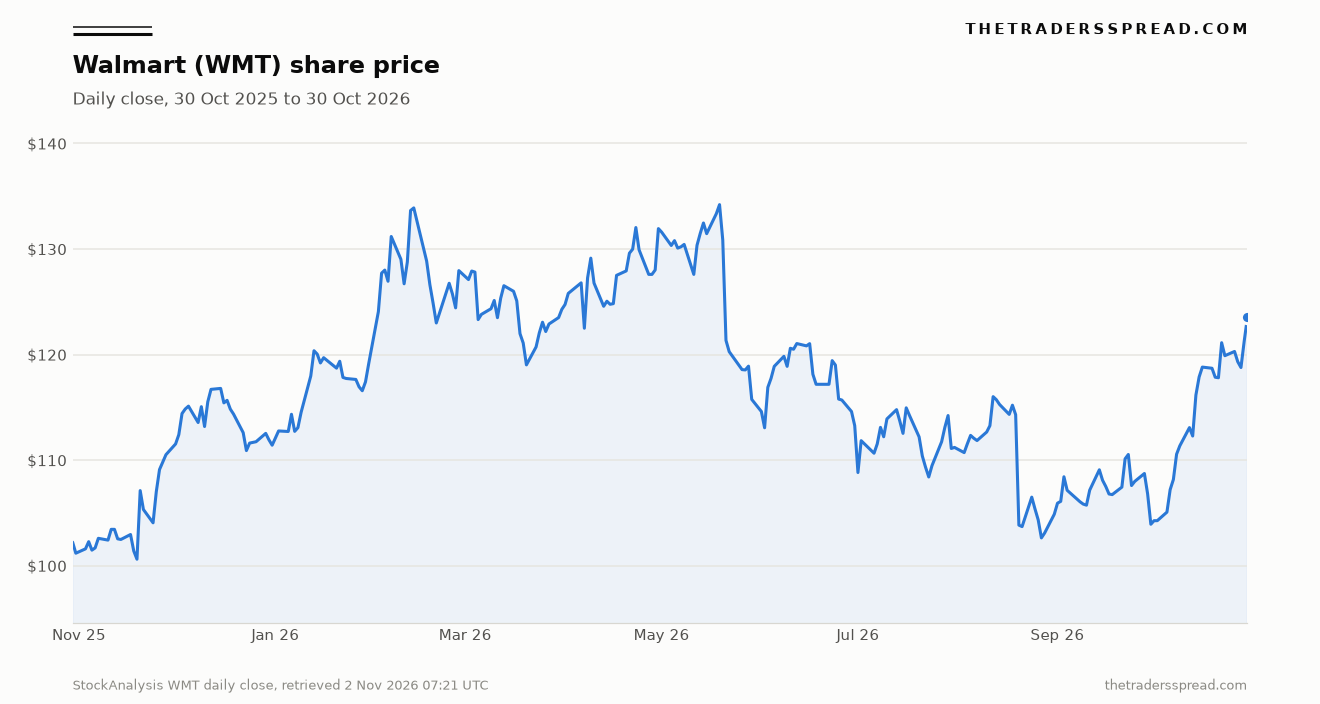
On 20 August 2026, the release date, the share closed at $103.84 against $114.30 the session before, down 9.15% on about 83.6 million shares, and by 30 October it was at $123.51, about 8.0% under the 19 May close of $134.20. That morning’s release paired the 28.8% operating-income increase with a US comp of 2.6% against 4.6% a year earlier, and with a third-quarter guide of 3.0% to 3.75% constant-currency sales growth and 2.0% to 4.0% adjusted operating-income growth.
A US comp is a slice, and the slice has two calendars
Walmart US net sales were $125,189 million, or 67.3% of the $186,100 million total. International was $35,198 million, or 18.9%. Sam’s Club US was $25,713 million, or 13.8%. A US comp leaves out nearly a third of net sales, and the comp itself comes in two calendars.
The 10-Q uses a fiscal calendar. Walmart US comps with fuel were 3.3%, and the fuel impact was 0.4 of a percentage point, so with-fuel minus fuel impact is about 2.9%. The earnings release uses the retail, or 4-5-4, calendar and prints comp sales excluding fuel of 2.6% for the 13 weeks ended 31 July 2026 against the 13 weeks ended 1 August 2025. The 10-Q warns that the two calendars can differ. An unnamed “Walmart comp” mixes 3.3%, 2.9% and 2.6%.
eCommerce’s contribution splits the same way. The 10-Q puts it at about 4.9 percentage points of the 3.3% calendar comp, and the release at about 510 basis points of the 2.6% retail-calendar comp. On both pairs the contribution exceeds the comp, leaving a residual near minus 1.6 percentage points on the calendar figures and near minus 2.5 on the retail calendar. A stores-only comp is absent from the filing, and the two residuals differ because one comp includes fuel.
New boxes explain little of the sales gain. Units ended at 11,000 and retail square footage at 1,058 million, against 10,797 units and 1,052 million square feet, so the unit count rose about 1.9% while consolidated net sales rose 5.9%. Comparable sales already include eCommerce of existing stores and clubs.
International widens the gap further: reported international net sales rose 12.8%, while constant-currency net sales were $33,700 million, up 7.9%, with currency adding $1,500 million to sales and about $100 million to operating income. China net sales were $7,416 million against $5,786 million in reported dollars. John David Rainey, chief financial officer, said on 20 August 2026 that shifting Flipkart’s Big Billion Days between the third and fourth quarters was a headwind of over 100 basis points to third-quarter sales growth.
Operating prints and share paths diverge elsewhere too. The published note on Costco after its fourth quarter records a 2.9% share rise that still left the stock 15.8% under a May high. Walmart’s release day was the sharper version of that split.
Traffic and ticket moved together. The margin moved on a refund
Transactions of 1.5% plus average ticket of 1.1% equal the 2.6% Walmart US comp. A year earlier the same table showed transactions of 1.5% and ticket of 3.1%, summing to 4.6%. Traffic growth was flat year on year. The comp slowed because the ticket slowed. A traffic headline that skips the ticket is describing last year’s shape of growth.
| Line | Q2 FY27 | Q2 FY26 |
|---|---|---|
| Comp sales, ex-fuel | 2.6% | 4.6% |
| Transactions | 1.5% | 1.5% |
| Average ticket | 1.1% | 3.1% |
| eCommerce contribution to comp | about 510 bps | about 420 bps |
| Net sales | $125,189 million | $120,911 million |
| Net sales change | 3.5% | 4.8% |
| Operating income | $8,120 million | $6,732 million |
Health and wellness worked against grocery, and the release states the drag twice. The opening paragraph puts an 80 basis-point health and wellness headwind inside the 2.6% comp. The US highlights call pharmacy deflation, under maximum fair price rules from 1 January 2026, a 125 basis-point headwind. The 10-Q shows health and wellness net sales of $16,942 million against $17,248 million and leaves the two basis-point figures side by side. Grocery was $74,130 million, or 59.2% of Walmart US net sales, and general merchandise was $29,728 million.
The margin moved on a different cause from the 1.5% traffic gain. The US gross-profit rate rose 158 basis points on tariff refunds and mix, partly offset by price investment, while US operating expenses deleveraged 72 basis points. Segment operating income still rose 20.6% to $8,120 million, because the gross-margin move was the larger one. Company-wide the gross-profit rate rose 96 basis points to 25.4% and the operating margin rose 89 basis points to 5.0%.
Gross profit was $47,296 million against $42,979 million. Ninety-six basis points on $186,100 million of net sales is about $1,800 million, against a $2,900 million refund in cost of sales, so the rate effect that remained is smaller than the refund. That matches the statement that a significant portion of the refunds went into price. Less than one third of US sales are imported, and Walmart calls the $2,900 million substantially all of the refunds requested.
Walmart News posted on 28 October 2026 about a holiday meal basket with more items at a lower cost than the prior-year basket. The customer offer matches the filing’s price investment: a cheaper basket up front, and a gross-margin rate that is what remains.
More food. More savings. More to celebrate.
— Walmart News (@WalmartNews) October 28, 2026
Walmart’s Holiday Meal Basket serves 10 for $35, with 26 items — 18% more items than last year. The basket costs 12% less than those same items did a year ago. Available through Dec. 24.
Learn More: https://t.co/sBXwPLSCda pic.twitter.com/KIqbXGA6FR
Rainey asked readers to take Q2 and Q3 together, because the operating-income outlook kept feeding the refund into price in the second half. The 2.0% to 4.0% adjusted operating-income guide for the third quarter is the company’s contrast with the 28.8% print. Inventory moved faster than sales: US inventory rose 6.3% on the release, global inventory rose 6.7% (6.0% in constant currency), and the balance sheet shows inventories of $61,600 million against $57,729 million.
Digital orders still run through the stores
In the 10-Q, eCommerce net sales include digitally started orders that a store or club fulfills, plus some advertising, fulfillment services and data insights. Walmart US eCommerce net sales were about $29,400 million against $23,700 million, the release’s 24% increase, and about 23.5% of segment net sales. International eCommerce was about $9,900 million against $8,300 million, up 19%, led by store-fulfilled pickup and delivery. Sam’s Club US eCommerce was about $4,700 million against $3,700 million, up 26%.
The company reports consolidated eCommerce growth of $8,200 million, or 23%, led by store-fulfilled pickup, delivery and marketplace. Summing the approximate segment lines lands near $44,000 million against about $35,700 million, and the small difference from $8,200 million is rounding. John Furner, president and chief executive, tied that growth to price, speed and convenience. The documents under the quote describe store-fulfilled delivery, so a trip can lift transactions and still sit inside the eCommerce contribution, inside segment operating income.
| Segment | Net sales | eCommerce net sales | Operating income |
|---|---|---|---|
| Walmart US | $125,189 million | about $29,400 million | $8,120 million |
| Walmart International | $35,198 million | about $9,900 million | $1,439 million |
| Sam’s Club US | $25,713 million | about $4,700 million | $678 million |
| Consolidated | $186,100 million | growth of $8,200 million, or 23% | $9,383 million |
Advertising is in eCommerce net sales for some contracts and in cost of sales for others. Global and Walmart US advertising each rose 38%, Walmart Connect excluding VIZIO rose 43%, and international advertising rose 20%, led by Flipkart Ads, with the dollar base withheld. Membership and other income, a separate line of fees, rental, recycling, gift-card breakage and campus income, was $1,837 million, up 11.2%, while membership-fee revenue rose 17% globally and US membership and other income rose 15.6% to $750 million on Walmart+ fees. Beside $125,189 million of US net sales, that fee stream changes the edge of profit.
RelatedRegeneron (REGN) Price Prediction: $1050 Bull vs $740 Bear
Sam’s Club repeats the mix-up with fuel. Comps with fuel were 8.6% and the fuel impact was 4.2 percentage points, so the ex-fuel comp is 4.4%, with transactions up 7.0%, average ticket down 2.5%, and an eCommerce contribution of about 450 basis points. Reported net sales rose 8.8% to $25,713 million, against a 4.5% gain to $22,100 million excluding fuel. Operating income rose from $470 million to $678 million, or 44.3%, and 23.3% against the release’s adjusted prior-year base of $550 million once prior supply-chain reorganisation charges drop out.
Operating income rose while earnings per share fell
Below operating income, the 28.8% and the $0.80 part company. Interest, net was $171 million against $675 million, and the release puts adjusted interest, net at $0.6 billion once a tax-matter benefit is removed. Other gains and losses were a $1,200 million loss against a $2,708 million gain, mostly investment marks, after the fair value of those holdings fell about $1,100 million. Net income attributable to Walmart was $6,366 million against $7,026 million, and the effective tax rate was 18.5% against 23.3%.
Reported diluted earnings per share were $0.80. The investment loss cut $0.12 a share after tax, a tax matter added $0.11, and adjusted earnings per share were $0.81. A year earlier reported earnings per share were $0.88 and adjusted earnings per share were $0.68, after removing an investment gain of $0.26 a share and adding back $0.05 of legal items and $0.01 of reorganisation. Adjusted earnings rose from $0.68 to $0.81 while reported earnings fell from $0.88 to $0.80. Both pairs are in the release. Using one and dropping the other is a choice about marks.
Reading the lines apart is the same habit as the comparison of Lam Research’s earnings lines. Operating income stops at cost of sales and operating expenses. Diluted earnings per share continue through interest, marks, tax and the share count, and the diluted share count only eased from 8,016 million to 7,978 million. Over the trailing twelve months, return on assets was 8.0% against 8.3% while return on investment was 15.4% against 15.1%.
Cash returns: dividend, buyback, capital budget
The fiscal 2027 dividend, set on 19 February 2026, is $0.99 a share, up from $0.94, in four installments of $0.2475. Payments fall on 6 April, 26 May, 8 September 2026 and 4 January 2027. On the 30 October close of $123.51 the $0.99 is a cash yield of about 0.80%. The quarter’s basic weighted-average share count of 7,954 million, times that close, is an equity value near $982 billion. The coupon is a thin claim on that value.
Dividends declared during the six months were $7,896 million, the full year, because the annual dividend was declared in the first quarter. The income statement shows $0.99 for the half and a dash for the second quarter alone. Cash dividends paid were $3,945 million. Dividends payable at 31 July 2026 were $3,949 million, against zero at 31 January. Declared minus paid is $3,951 million, within $2 million of the payable, so two installments had been paid and two were still on the balance sheet.
| Line | Six months to 31 July 2026 | Six months to 31 July 2025 |
|---|---|---|
| Net cash from operating activities | $19,710 million | $18,352 million |
| Payments for property and equipment | $14,181 million | $11,409 million |
| Free cash flow | $5,529 million | $6,943 million |
| Cash dividends paid | $3,945 million | $3,755 million |
| Share repurchases | $5,104 million | $6,200 million |
| Dividends declared | $7,896 million | $7,540 million |
Repurchases were $5,104 million for 42.3 million shares at $120.71 on average, and a $30,000 million February authorisation still had $25,100 million left. Cash buybacks exceeded cash dividends, the $7,896 million declaration exceeded both, and property and equipment payments of $14,181 million exceeded every return line. Free cash flow fell to $5,529 million from $6,943 million even as operating cash rose to $19,710 million, because the extra capital spending outran it. Cash was $11,529 million against long-term debt, including the current portion, of $39,932 million.
In this half the capital budget, the buyback and the declared dividend are three different sizes, and the cash coupon is the small one. A similar gap, between a headline rate and the line that changes the economics, is the subject of the comparison of client incentives at Visa and Mastercard.
What the quarter actually measures
The mechanism is mix: a 2.6% US comp, from a 1.5% transaction gain and a 1.1% ticket gain, carried about 510 basis points of store-fulfilled eCommerce, while consolidated net sales rose 5.9% once international, Sam’s Club, fuel and currency are included. A $2,900 million tariff refund, partly returned as price, sat under a $2,097 million rise in operating income, and diluted earnings per share fell on a $1,200 million investment loss. Cash dividends of $3,945 million sat beside $5,104 million of buybacks and $14,181 million of capital spending, with the $0.99 dividend yielding about 0.80% on the 30 October close. Any one of those lines, offered as the whole story, is thinner than the 10-Q.
Figures come from Walmart’s Form 10-Q filed on 28 August 2026, the earnings release filed on 20 August 2026, and a StockAnalysis price pull at 07:21 UTC on 2 November 2026. They are reference data on reported results and a past share path. They are not a forecast, a price target, or an instruction to trade.