

Shopify facilitated $119.1 billion of gross merchandise volume in the quarter ended 30 September 2026, the dollar value of orders that moved through the platform, net of refunds and inclusive of shipping, duty and value-added tax. The Form 10-Q filed on 3 November 2026 treats that volume as a measure of merchant activity. Revenue in the same quarter was $3,742 million.
The distance between those two numbers is the reading. A store chain's sales print is revenue the company keeps, which is why a page on Walmart sales, traffic and margin starts from a figure on the income statement. Shopify's volume belongs to the merchants. Divide $3,742 million of revenue by $119,145 million of volume and the result is $3.14 of revenue per $100 of volume, against $3.09 in the quarter ended 30 September 2025. The filing leaves that ratio unnamed. Its two key performance indicators are gross merchandise volume and monthly recurring revenue.
Jeff Hoffmeister, chief financial officer of Shopify, tied the quarter to cash in the earnings release filed the same morning. "We extended our track record of consistent execution, with 32% revenue growth and a 22% free cash flow margin," he said, adding that results at this scale speak to the model and to several growth drivers. The 32 percent matches the revenue line. The 22 percent is a non-GAAP margin from that release, operating cash minus a small equipment line. A Shopify report stays readable when the merchants' volume, the revenue mix, and that cash definition stay apart.
Updated 5 November 2026, from the Form 10-Q for the quarter ended 30 September 2026 and from Exhibit 99.1 to the Form 8-K filed the same day.
Key figures for the quarter ended 30 September 2026
- Gross merchandise volume was $119,145 million, against $92,013 million a year earlier. Source: Shopify Form 10-Q, filed 3 November 2026.
- Revenue was $3,742 million, of which merchant solutions were $2,906 million and subscription solutions were $836 million. Source: Shopify Form 10-Q, filed 3 November 2026.
- Monthly recurring revenue was $230 million on 30 September 2026, against $193 million a year earlier. Source: Shopify Form 10-Q, filed 3 November 2026.
- Shopify Payments showed a 68 percent penetration rate and $81.4 billion of volume, against 65 percent and $60.2 billion. Source: Shopify Form 10-Q, filed 3 November 2026.
- The earnings release reports free cash flow of $816 million, operating cash of $818 million minus $2 million spent on property and equipment, a 22 percent margin. Source: Exhibit 99.1 to the Form 8-K and the Form 10-Q cash-flow statement, 3 November 2026.
- The cash-flow statement adds back $140 million of stock-based compensation. The income-statement footnote that includes related payroll taxes prints $147 million. Source: Shopify Form 10-Q, filed 3 November 2026.
What does gross merchandise volume count?
The 10-Q defines gross merchandise volume as the total dollar value of orders facilitated through the platform, including certain apps and channels with a revenue-sharing arrangement, net of refunds, and inclusive of shipping and handling, duty and value-added taxes. The same paragraph draws the line that matters once a headline has used a figure in the billions. GMV does not represent revenue earned by Shopify.
The key-performance table prints $119,145 million, against $92,013 million. The MD&A rounds the change to 29 percent. The unrounded change is 29.5 percent, which is why a same-day post can say 29.5 percent while the narrative says 29 percent. In constant currency the MD&A puts quarterly and nine-month growth at 30 percent. Nine-month volume was $335,455 million against $254,600 million, $335.5 billion and 32 percent in the prose.
Harley Finkelstein, president of Shopify, used the rounded figure in the release. "We powered $119 billion in GMV, while continuing to build commerce into every surface, every agent, and increasingly, everywhere," he said, after describing the company as operating in the merchants' present and in the commerce they are moving toward. The "$119 billion" rounds the $119,145 million in the Form 10-Q. He posted the same three headlines, with the unrounded volume change, on the filing day.
Q3 was signature @Shopify (again).
— Harley Finkelstein (@harleyf) November 3, 2026
→ $119B in GMV, up 29.5%. Our 13th straight quarter above 20%.
→ $3.7B in revenue, up 32%. Our 14th straight quarter at 25%+.
→ 22% free cash flow margin. pic.twitter.com/hvAbhm1Dus
The post also claims thirteen quarters of volume growth above 20 percent and fourteen of revenue growth at 25 percent or better. This 10-Q's quarterly table runs eight quarters, back to 31 December 2024, so the dollars can be checked here while the streak sits beyond that table. The quarter ended 31 December 2025 already shows the holiday shape: revenue of $3,672 million and merchant solutions of $2,895 million, against $2,844 million and $2,145 million in September 2025.
Where does the revenue sit inside that volume?
Subscription solutions were $836 million, up 20 percent from $699 million. Merchant solutions were $2,906 million, up 35 percent from $2,145 million. Total revenue was $3,742 million, up 32 percent from $2,844 million. Subscription solutions were 22 percent of revenue and merchant solutions 78 percent, against 25 percent and 75 percent. Merchant solutions were $2.44 per $100 of volume, against $2.33. Most of that line is Shopify Payments processing and currency conversion, plus lending, referrals, shipping labels, hardware and advertising. Subscription revenue is platform plans, including variable fees, plus POS Pro, apps, themes and domains.
Gross profit was $1,781 million, 47.6 percent of revenue, against $1,391 million and 48.9 percent, a dollar increase the release rounds to 28 percent. Subscription gross profit was $661 million, or 79.1 percent of that revenue, against 81.7 percent. Merchant-solutions gross profit was $1,120 million, or 38.5 percent, against 38.2 percent. Operating income was $568 million, 15.2 percent of revenue, against 12.1 percent, while operating expenses fell from 36.8 percent of revenue to 32.4 percent.
| Line | 2026 | 2025 | Change the filing states |
|---|---|---|---|
| Gross merchandise volume | 119,145 | 92,013 | 29 percent |
| Subscription solutions | 836 | 699 | 20 percent |
| Merchant solutions | 2,906 | 2,145 | 35 percent |
| Total revenue | 3,742 | 2,844 | 32 percent |
| Monthly recurring revenue, period end | 230 | 193 | 19 percent in the overview |
| Revenue per $100 of volume, calculated | $3.14 | $3.09 | Reader arithmetic |
| Gross profit | 1,781 | 1,391 | 28 percent in the release |
By merchant location the United States was $2,373 million, 63 percent of revenue, Europe $766 million and 20 percent, Asia Pacific $362 million and 10 percent, Canada $172 million and 5 percent, and the rest of the world $69 million and 2 percent. A $4 million exchange-rate effect would have left constant-currency revenue at $3,746 million. The release still prints 32 percent growth, with merchant solutions at 36 percent in constant currency against 35 percent reported.
How is monthly recurring revenue different from subscription revenue?
Monthly recurring revenue is a last-day snapshot. The 10-Q defines it as the value of all subscription plans, excluding variable platform fees, assuming merchants renew the next month. Platform plans and POS Pro are included. Local-currency plans convert at the period-end rate. Paid trials enter at the trial price. Free trials stay out until they end. Management uses the snapshot to forecast the subscription revenue that makes up most of the subscription line.
The snapshot was $230 million, against $193 million. Three times that figure is $690 million, against $836 million of subscription revenue, and the $146 million gap holds variable fees, apps, themes, domains and the snapshot itself. The filing leaves the gap unsplit. Of the $137 million increase in subscription revenue, $125 million was fees from more merchants and a richer mix, including Plus. Any one merchant has stayed at or below five percent of revenue in a reporting period.
MRR growth in the quarter matched the year-ago rate. The nine-month rate ran ahead because the prior year had lengthened paid trials. Deferred revenue is a poor guide to future subscription revenue, which is why the snapshot exists. Using the line the report actually carries is the same discipline as the Lam Research earnings comparison.
Which attachment rate does the filing actually print?
The attachment the 10-Q prints is Shopify Payments penetration, the share of volume on Shopify Payments. It was 68 percent, or $81.4 billion, against 65 percent and $60.2 billion. The MD&A calls that $21.3 billion of additional Payments volume and 35 percent growth. Payments revenue rose $619 million and was the largest piece of the merchant-solutions increase. Over nine months the rate was also 68 percent, on $226.5 billion against $164.3 billion.
Cost of merchant solutions was $1,786 million, up 35 percent, tied to processing fees on that larger Payments volume. Cost of subscription solutions was $175 million, up 37 percent, and $40 million of the increase was infrastructure, including cloud hosting and LLM usage. That bill is why subscription gross margin slipped from 81.7 percent to 79.1 percent. Research and development rose $122 million to $497 million, including $62 million of employee cost and $40 million of hardware and software, which includes AI-related usage. AI shows up here as cost. A separate AI revenue percentage is absent from these statements.
In a second post the same morning, Finkelstein said the operational point sits between the headlines, because the places a merchant can sell keep multiplying, including inside AI agents.
But what really matters is in between the numbers.
— Harley Finkelstein (@harleyf) November 3, 2026
Every quarter there are more places to sell. Online. In store. Across borders. Now inside AI agents.
No merchant can manage all of that on their own. Nor should they.
So the value of one simple, connected system keeps going…
Transaction and loan losses were $120 million, against $148 million, with Payments losses down $41 million and lending losses up $14 million. Over nine months the total rose from $303 million to $377 million as lending losses rose $83 million. Loans and merchant cash advances, net, stood at $2,350 million, against $1,784 million at 31 December 2025.
Why does free cash flow live in the release?
Operating cash and equipment purchases are GAAP lines. Free cash flow is assembled in the release. Operating cash was $818 million, against $513 million. Equipment purchases were $2 million, against $6 million. The release prints free cash flow of $816 million, against $507 million, a 22 percent margin against 18 percent. Hoffmeister's 22 percent is $816 million over $3,742 million, rounded. The definition is cash from operations less capital expenditures, and a footnote equates capital expenditures with the equipment line.
| Line | 2026 | 2025 |
|---|---|---|
| Net cash from operating activities | 818 | 513 |
| Purchases of property and equipment | 2 | 6 |
| Free cash flow, as the release defines it | 816 | 507 |
| Free cash flow margin | 22 percent | 18 percent |
| Stock-based compensation, cash-flow add-back | 140 | 107 |
| Stock-based compensation and related payroll taxes | 147 | 116 |
| Repurchases of common stock, cash | 562 | 0 |
From April 2026, merchant-cash-advance flows moved from operating cash into investing, alongside loans. The quarter's net use on that shift was $30 million. Nine-month operating cash was $1,957 million against $1,308 million, and equipment purchases were $11 million against $16 million. The release's reconciliation prints the quarter, so a nine-month free-cash-flow figure is the reader's own subtraction.
Related22% Gain Lifts IDEXX Laboratories After Diagnostics Beat
Cash plus current securities was $4,727 million. The MD&A rounds that stock of cash and securities from $5.8 billion at year-end 2025 to $4.7 billion after repurchases and net lending. Working capital excluding current deferred revenue was $6.5 billion. For the fourth quarter the release expects low-thirties revenue growth, high-twenties growth in gross-profit dollars, operating expenses at 29 to 30 percent of revenue, stock-based compensation of $155 million, and a free-cash-flow margin in line with the fourth quarter of 2025. That older margin stays in the prior release. The base printed here is $3,672 million of revenue, and expenses in the quarter just reported were 32.4 percent of revenue.
How do you separate share-based pay from the cash?
The cash-flow add-back for stock-based compensation is $140 million. The footnote that includes related payroll taxes prints $147 million, and research and development carries $104 million of that footnote. The $7 million gap is payroll tax, which is cash, so it stays off the add-back. The non-GAAP bridge uses $147 million plus $2 million of amortisation, a $117 million equity-investment loss, a $21 million equity-method loss and a tax adjustment the other way. GAAP net income of $462 million becomes non-GAAP net income of $638 million, and diluted earnings per share move from $0.36 to $0.49 on 1,290,726,742 shares.
Repurchases are read as a set. Cash flow shows $562 million in the quarter and $2,473 million over nine months. The equity roll retires 4,285,848 shares and reduces common stock by $550 million. The MD&A says $543 million of Class A shares were bought in the quarter, with about $2.5 billion still available. Note 11 shows 21,145,824 shares over nine months at $117.09 on average, worth $2,476 million, with $2,524 million still authorised after the board raised the programme to $5 billion.
Shares fell from 1,289,206,588 on 30 June to 1,286,382,911 on 30 September: exercises added 372,633, vesting added 1,089,538, and repurchases removed 4,285,848. Diluted weighted-average shares of 1,290,726,742 average the quarter and differ from the ending count. At 30 October 2026 the cover lists 1,208,456,928 Class A shares, 78,065,084 Class B shares and one founder share. SHOP on the Nasdaq Global Select Market is the Class A line. Options outstanding were 11,821,761 and restricted share units 4,344,951, against a reserve of 531,772,589, a ceiling rather than a forecast of issuance. The outlook's $155 million of stock-based compensation sits beside this quarter's $140 million and $147 million.
What can move profit while the merchants look steady?
Net income of $462 million includes a $138 million net loss on equity and equity-method investments. Inside the narrative, equity and other investments lost $127 million, including a $126 million unrealised loss, and the equity-method stake lost $21 million. Those components and the single $138 million line are different aggregations. The release's figure with the marks removed is $584 million, on the view that third-party prices sit outside management. The quarterly table shows a $1,228 million gain in the June 2026 quarter and a $1,082 million loss in the March quarter.
The tax provision was $37 million and includes a $63 million benefit from releasing part of the US valuation allowance. A $68 million deferred-tax recovery on the cash-flow statement is a separate line. Other income of $69 million was driven by $65 million of interest on securities, against $81 million a year earlier. A Canadian shelf prospectus and a US Form S-3, filed with this 10-Q, are permission to offer securities later, on terms set in a supplement.
A wide activity figure sitting above a smaller booked revenue line shows up elsewhere on this desk. Novo Nordisk's list price versus reported net sales uses rebates where Shopify uses a payments attachment. The reading order still runs from the activity figure to the booked line and then to the footnote on what was removed.
Which lines answer the same questions next quarter?
The next Shopify report answers the same questions at the same addresses in the filing and the release.
- Gross merchandise volume sits in the key-performance table, with the constant-currency rate in the paragraph under it.
- Monthly recurring revenue is the period-end snapshot, and the definition keeps variable platform fees and free trials outside it.
- Subscription solutions and merchant solutions appear in dollars and as a share of revenue, beside the Shopify Payments penetration rate.
- Operating cash and equipment purchases sit on the cash-flow statement, and free cash flow is the release's subtraction of those two lines.
- The merchant-cash-advance footnote says whether advances sit in operating cash or investing cash.
- Stock-based compensation appears as the cash-flow add-back and in the footnote that includes payroll taxes, and the non-GAAP bridge shows which one it used.
- Repurchases appear as cash spent, as shares retired, and as authorisation still open.
- The outlook names revenue growth, gross-profit growth, operating expenses as a share of revenue, a stock-based-compensation amount, and a free-cash-flow margin pointed at the prior holiday quarter.
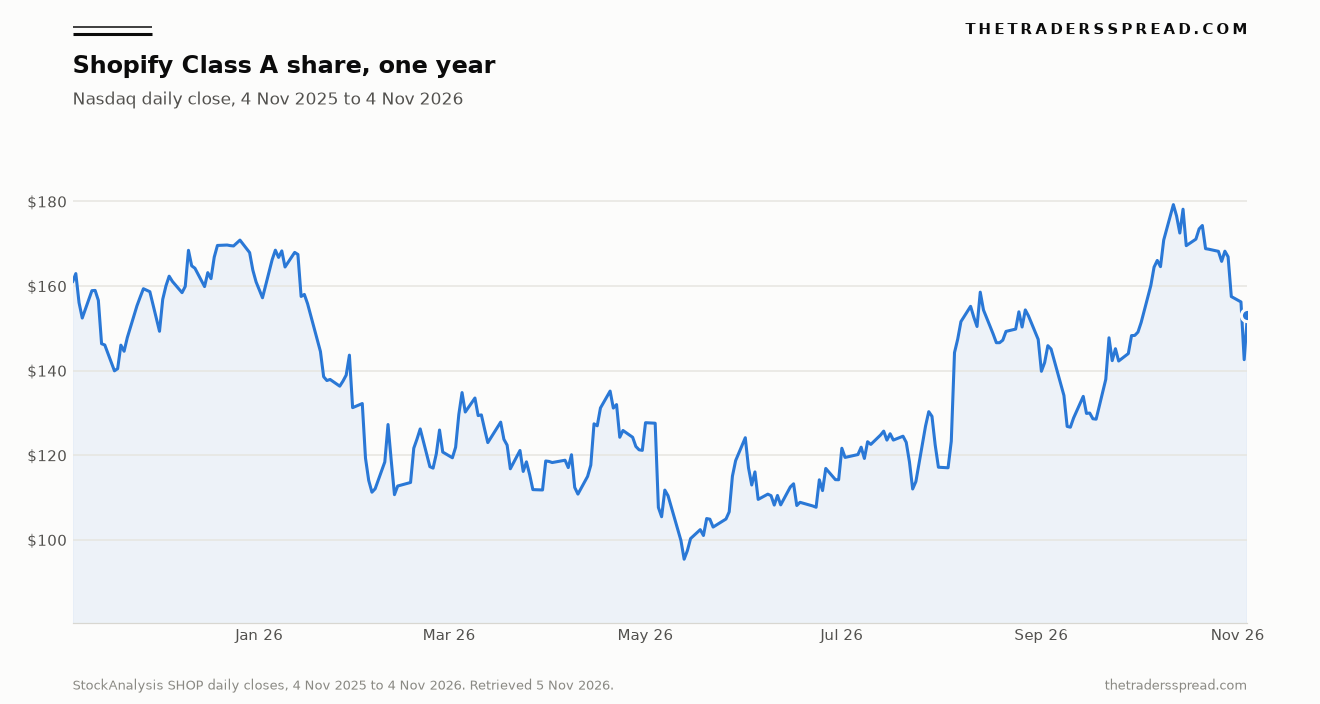
The chart is the daily Nasdaq close for the Class A shares from 4 November 2025 through 4 November 2026, from StockAnalysis, retrieved on 5 November 2026. It runs from $160.94 to $153.03, with a low close of $95.40 on 13 May 2026 and a high close of $179.22 on 12 October 2026. The quote endpoint timestamps the regular-session print at 4:00 pm Eastern on 4 November 2026 at $153.03, from a prior close of $142.57, and an after-hours print of $152.73 at 7:59 pm Eastern. A separate 52-week field on that quote runs from $94 to $180.88. The path is context for a filing that defines the volume, the revenue and the cash.
This guide explains how to read Shopify's quarterly report and the share-price history beside it. It is not a solicitation to buy or sell any security, and it sets no price target.