

IDEXX Laboratories reported revenues of $1,214 million for the third quarter of 2026, an increase of 10% as reported and organic, in Exhibit 99.1 to the Form 8-K filed on 2 November 2026, and the shares closed that session at $671.64.
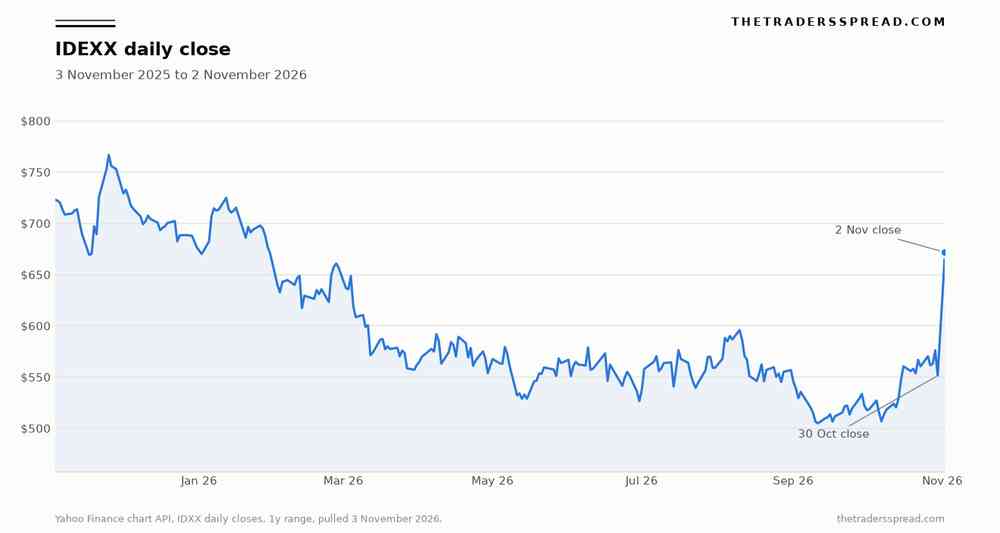
I pulled the daily series from the Yahoo Finance chart API for IDXX before writing, one-day bars over one year, and the payload's regularMarketTime is 2026-11-02 21:00:02 UTC. The 2 November bar closed at $671.64 against a 30 October close of $551.21, a difference of $120.43, or 21.8%, which the headline rounds to 22%. That bar opened at $625.00, traded between $620.20 and $673.19, and printed volume of 1,976,100 shares, so the open was already 13.4% above the prior close and the trip from open to close added 7.5%. For the idexx stock series, those two closes are the window.
The session before the print went the other way. On 30 October the shares opened at $583.75, traded as low as $540.61, and closed at $551.21, 4.3% under the 29 October close of $575.98, on volume of 1,173,500. The 2 November gain was a gap after that drop, then a further climb that held into the close on higher volume than the session before it.
The same exhibit that carried the 10% revenue line also lowered the full-year operating-margin range to 32.1% to 32.3%. The prior range, printed in that table and matching the 4 August 2026 second-quarter exhibit I opened, was 32.3% to 32.5%. Both ends sit 20 basis points lower. The EPS range moved the other way, to $14.96 to $15.16 from $14.69 to $14.94, which the release calls a $0.25 increase at the midpoint. A 21.8% close-to-close gain sits beside that $0.25. On the prior midpoint of $14.815, the average of $14.69 and $14.94, the $0.25 is 1.7%.
Quest Diagnostics had already reported, on 22 October 2026, third-quarter revenue of $3.097 billion, up 10.0%, and raised its own full-year revenue and EPS ranges in the exhibit I opened. The revenue growth rates sit within a tenth of each other, and a Quest share price stays outside this record. A double-digit gain after a revenue beat has a cousin on this desk in the Accenture note, whose title records a 15.8% rise, still smaller than this session.
Quest on the same axes
I scored the two filings on lines both companies actually printed, the same line-by-line habit as the Lam Research earnings read on this desk. Comparable EPS at IDEXX and adjusted EPS at Quest are both non-GAAP, and the adjustment stacks differ, so each cell keeps the company's own label. IDEXX comparable EPS removes share-based compensation activity and the year-over-year currency change, $0.01 and $0.04 this quarter, while the equity-investment loss line is blank. Quest's adjusted figures exclude restructuring and integration charges, amortization, excess tax benefits on stock-based compensation, gains and losses on strategic investments, and other items.
| Axis | IDEXX, quarter ended 30 September 2026 | Quest Diagnostics, quarter ended 30 September 2026 | Reading |
|---|---|---|---|
| Reported revenue | $1,214.237 million, up 9.9% reported and 10.0% organic. The lead bullet rounds both to 10% | $3,097 million, up 10.0%. The bullet rounds it to $3.10 billion | A tenth of a point apart on the detailed lines. Both leads say 10% |
| Reported diluted EPS | $4.01 versus $3.40. The reconciliation labels growth at 18% | $2.78 versus $2.16, up 28.7% | Quest grew reported EPS faster in the quarter |
| Non-GAAP EPS | Comparable EPS $3.96 versus $3.24, labeled 22%, after removing $0.01 of share-based compensation and $0.04 of currency | Adjusted EPS $3.00 versus $2.60, up 15.4% | IDEXX grew its comparable line faster, on a different formula |
| Reported operating margin | 33.1% versus 32.1%, up 100 basis points. Comparable margin rose 60 basis points | 15.5% versus 13.7%, up 180 basis points. Adjusted margin 16.7% versus 16.3%, up 40 basis points | Quest's reported change is larger and its adjusted change is smaller, on a lower margin level |
| Full-year revenue guide | $4,741 to $4,767 million, from $4,700 to $4,745 million. Up $32 million at the midpoint, including $5 million tied to CoVet | $12.065 to $12.105 billion, from $11.95 to $12.05 billion. Averaging the midpoints, I get a lift of $85 million | Both raised. Against the prior midpoint each lift is about 0.7% |
| Full-year reported EPS guide | $14.96 to $15.16, from $14.69 to $14.94. Up $0.25 at the midpoint, 1.7% of the $14.815 prior midpoint | $10.21 to $10.31, from $9.97 to $10.17. My midpoint average rises by $0.19, about 1.9% of $10.07 | The fractional guide lifts are similar. The 2 November close moved 21.8% |
| Quarterly cash from operations | $449.717 million versus $402.340 million | $611 million versus $563 million, an increase Quest states at 8.8% | Both are higher. IDEXX's dollar increase is $47.4 million |
| Full-year capital spending | About $160 million, from about $180 million | Approximately $550 million, unchanged | IDEXX cut the capex guide. Quest held the figure it had already published |
The two exhibits linked above are the source for every cell. Where a cell says I averaged a midpoint, that average is my arithmetic on the printed range. For IDEXX I keep the company's own "$32 million" and "$0.25" wherever the release states them. Quest's $85 million and $0.19 are my averages, because that exhibit prints ranges and leaves the midpoint unspoken.
A 33.1% operating margin and a 15.5% operating margin describe different businesses, an instrument-and-recurring veterinary franchise against a clinical laboratory network. I score the change and I keep the level visible. Quest's reported margin jump of 180 basis points shrinks to 40 basis points on the adjusted line. IDEXX's comparable operating-margin change of 60 basis points sits between those two Quest figures.
Jim Davis, Chairman, CEO and President of Quest Diagnostics, put the quarter in one sentence in that exhibit: "We delivered revenue growth of 10% and adjusted EPS growth of over 15% on continued strength across our physician, hospital and consumer channels, complemented by productivity gains from automation and AI." Under that sentence, requisition volume rose 14.5%, organic requisition volume rose 14.4%, and revenue per requisition fell 4.2%. Quest's 10% revenue result was a volume result with a lower price per requisition.
The recurring book did the work
The 10% company figure rounds a table that shows reported growth of 9.9% and organic growth of 10.0% on revenue of $1,214.237 million against $1,105.239 million. Currency took 0.2 points off reported growth and acquisitions added 0.1 point. Companion Animal Group revenue was $1,115.968 million, 91.9% of the quarter on my division of those lines, up 10.2% reported and 10.4% organic. United States CAG was $725.876 million, up 8.6% reported and 8.5% organic. International CAG was $390.092 million, up 13.4% reported and 14.0% organic.
Diagnostics recurring revenue was $967.351 million against $873.273 million, up 10.8% reported and 11.0% organic, where the bullet rounds both rates to 11% and I keep the table. The United States recurring line was $620.322 million, up 9.6% on both bases. International recurring revenue was $347.029 million, up 12.9% reported and 13.6% organic. The narrative rounds those to 10% in the United States and to 13% reported and 14% organic abroad, and the international line ran ahead.
VetLab consumables were $443.245 million, up 14.3% reported and 14.6% organic, against a bullet that says 14% and 15% and cites net new customers, an 11% expansion of the global premium installed base, utilization, launches, and net price gains. Reference-lab diagnostic and consulting services were $399.079 million, up 10.0% reported and 10.2% organic. Rapid assay products were $89.135 million against $88.638 million, up 0.6% reported and 0.7% organic, against a narrative round of 1%. The clause under that round is the one I keep: growth was driven by net price benefits, offsetting lower testing volumes. That is the soft line inside an otherwise double-digit recurring book, and it runs the other way from Quest, where volume rose and revenue per requisition fell.
Capital instruments were $51.492 million against $51.479 million, with reported growth shown as a dash and organic growth of 0.4%, in the same quarter the company placed over 1,900 IDEXX inVue Dx analyzers and described an installed base near 11,000 instruments. Veterinary software, services and diagnostic imaging systems were $97.125 million, up 10.6% reported and 9.9% organic, including systems and hardware of $19.653 million, up 17.0% on both bases, and recurring software of $77.472 million, up 9.1% reported and 8.2% organic, with imaging installations led by ImageVue DR50 Plus.
Mike Erickson, President and Chief Executive Officer of IDEXX Laboratories, said in the exhibit: "Innovations like IDEXX inVue Dx with FNA, and IDEXX Cancer Dx becoming a multi-cancer panel, are helping practices detect disease earlier and work more efficiently. In software, we advanced our capabilities with the acquisition of CoVet, an AI clinical assistant that supports veterinary team productivity and diagnostics utilization, creating more value for our customers and shareholders." The cash-flow statement shows acquisitions of $227.122 million over nine months, and the outlook puts $5 million of the revenue-midpoint increase on CoVet. Those are the two CoVet figures the exhibit prints.
Water was $58.836 million, up 8.4% reported and 7.8% organic, and livestock, poultry and dairy was $34.828 million, up 2.6% reported and 3.0% organic, with other revenue of $4.605 million beside them. The headline diagnostics result is the CAG recurring line. Gross profit was $764.298 million and gross margin was 62.9% against 61.8%, which the narrative calls 110 basis points reported and 90 basis points comparable, and operating income was $402.348 million.
Net income was $317.145 million against $274.610 million, basic EPS $4.02 against $3.43, diluted EPS $4.01 against $3.40, on 79,049 thousand diluted shares against 80,675 thousand. Reported EPS included a $0.03 benefit from a non-operating equity gain, a $0.01 share-based compensation tax benefit, and a $0.04 currency benefit. Comparable EPS of $3.96 is $4.01 minus the $0.01 and the $0.04, and the loss-on-equity line for the quarter is a dash, so I leave the $0.03 inside the reported figure.
A guide that rose, and a margin range that fell
The outlook table in the 2 November exhibit is the second matrix, IDEXX against its own prior guide. I checked the prior column against the 4 August exhibit, which narrowed 2026 revenue guidance to $4,700 million to $4,745 million, increased the EPS outlook to $14.69 to $14.94, and set the operating-margin outlook at 32.3% to 32.5%. The prior column on 2 November matches those ranges.
| 2026 line | Prior guide | Updated on 2 November | What moved |
|---|---|---|---|
| Revenue | $4,700 to $4,745 million | $4,741 to $4,767 million | Up $32 million at the midpoint, including $5 million related to CoVet. The floor rose $41 million and the ceiling rose $22 million, so the band narrowed from $45 million to $26 million |
| Reported and organic growth | Reported 9.1% to 10.3%, organic 8.5% to 9.7% | Reported 10.1% to 10.8%, organic 9.3% to 10.0% | The release says the organic midpoint rose 0.6% on operational performance. The reported floor rose a full point |
| CAG diagnostics recurring | Reported 10.1% to 11.3%, organic 9.5% to 10.7% | Reported 11.0% to 11.7%, organic 10.3% to 11.0% | Both bands moved higher. The new organic floor is 10.3% |
| Operating margin | 32.3% to 32.5%. Expansion of 70 to 90 basis points, reported and comparable | 32.1% to 32.3%. Expansion of 50 to 70 basis points on both bases | Both ends are 20 basis points lower, so the new ceiling is the old floor. The expansion guide was cut after a quarter that printed 100 basis points of reported expansion |
| EPS | $14.69 to $14.94. Reported growth 12% to 14%, comparable growth 13% to 15% | $14.96 to $15.16. Reported growth 14% to 16%, comparable growth 15% to 16% | Up $0.25 at the midpoint. Both growth bands shifted higher |
| Interest, tax, shares, cash, capex | Net interest about $35 million; tax rate about 21.1%; share-count reduction 1.5% to 2%; free-cash-flow conversion 90% to 100%; capex about $180 million | Net interest about $32 million; tax rate about 20.5%; share-count reduction about 2%; free-cash-flow conversion 95% to 100%; capex about $160 million | Interest and the tax rate are lower, the share-count guide sits on its old top, the free-cash-flow floor is higher, and capex is about $20 million lower, while operating cash flow stays at 110% to 120% of net income and the share-based compensation tax benefit stays near $19 million, about $0.24 of EPS |
The outlook books an estimated currency benefit, net of hedging, of about 0.7% on revenue growth, about 30 basis points on operating margin, and about $0.25 on EPS. In the quarter itself, currency was a 0.2 point headwind on reported revenue growth and a $0.04 benefit in the EPS bridge. The full-year comparable-growth bridge adjusts 2026 for a $0.24 share-based compensation benefit and a $0.05 equity-investment loss, and it adjusts 2025 for a $0.08 litigation item and $0.35 of share-based compensation, which is why a quarterly 22% comparable figure can sit beside a full-year comparable band of 15% to 16%.
On this desk a higher guide and a higher share price are separate facts. The American Express note records, in its title, a 3.67% decline after an outlook raise. The pairing here is the other one: the EPS midpoint rose $0.25 and the close rose 21.8%, while the margin band was the line that fell.
Cash, the buyback, and the nine-month score
Free cash flow, as the exhibit defines it, is operating cash minus equipment purchases. The quarter is $449.717 million minus $28.930 million, stated as $420.787 million, against $371.226 million a year earlier. Nine-month free cash flow was $977.567 million against $730.803 million, from operating cash of $1,063.127 million and equipment purchases of $85.560 million.
RelatedAbbVie (ABBV) vs the profit jump: shares rise 1.41%
Cash ended at $197.536 million, from $180.070 million. Acquisitions took $227.122 million of investing cash. Financing included $76 million of net credit-facility borrowings, $75 million of senior-note payments, and $810.014 million of stock repurchases on the cash-flow statement. The repurchase table shows 199 thousand open-market shares in the quarter at an average of $563.04, a cost of $111.819 million, and nine-month open-market purchases of $804.698 million at an average of $588.14. The $671.64 close sits above both of those averages.
Nine-month revenue was $3,571.642 million against $3,213.123 million, diluted EPS $11.75 against $9.99, comparable EPS $11.32 against $9.63, with both growth rates labeled 18%, and operating margin 33.3% against 32.5%. Quest's nine-month revenue was $9,035 million against $8,229 million, up 9.8%, reported EPS $7.86 against $6.57, up 19.6%, and adjusted EPS $8.62 against $7.43, up 16.0%. Its adjusted operating margin was 16.2% in both periods, so the 180-basis-point reported jump is a third-quarter figure.
What this changes
What this changes is the pair of ranges a reader carries into the next print, and the mix inside the 10% headline. The revenue band is tighter and higher, the EPS band is higher, and the margin band stepped down so that its ceiling equals the old floor. A file that keeps only "beat and raise" has the EPS and revenue lines and has dropped the margin line the company lowered in the same table.
The mix under that headline is the flat instrument line near $51.5 million against consumables up 14.3% as reported, rapid assays growing on price while volumes were lower, and international recurring organic growth of 13.6% ahead of the U.S. line at 9.6%. Quest built its 10% quarter the other way on price and volume. The guide moved about 0.7% at the revenue midpoint and under 2% at the EPS midpoint, and the close moved 21.8%.
The AbbVie earnings note carries a title that records a 1.41% rise on a profit jump, the same habit of tying a filing to a close and a much smaller magnitude. In the one-year IDEXX series the highest close was $766.68 on 25 November 2025 and the lowest close was $504.70 on 11 September 2026. The payload's fifty-two-week high is $769.98 and its low is $500.61, so the $671.64 close sits 12.8% under that high and 34.2% above that low. I locate the session with those levels and I leave them there.
What the next filing would have to show
A Form 10-Q for the quarter ended 30 September 2026 was filed the same day, accession 0000874716-26-000135. The figures above are from the earnings exhibit, which is the document that carries the guide table. The next document that would test the new ranges is the full-year release and the Form 10-K.
The exhibit also says IDEXX will host an investor and analyst session at VMX in Orlando on Monday, 18 January 2027, at 1:00 pm Eastern, on the next point-of-care analyzer, IDEXX MultiCue Dx. That session is a webcast and a meeting. The filing that locks the year is the one that has to show revenue inside or outside $4,741 to $4,767 million, diluted EPS inside or outside $14.96 to $15.16, and an operating margin inside or outside 32.1% to 32.3%.
Would CAG Diagnostics recurring organic growth finish inside 10.3% to 11.0%, with the U.S. line still near the 9.6% pace of this quarter and the international line still ahead of it? Would the instrument line stay near $51 million a quarter while consumables carry the installed-base growth, or would capital revenue start to match a placement pace of more than 1,900 analyzers in a quarter? Would rapid-assay volumes stay lower, with price still covering them? Would the margin land inside the lowered band after the acquisition impacts the release already flags, and would free cash flow as a percent of net income hold the new 95% floor after capital spending of about $160 million? Those are the lines the 2 November table set. The close of $671.64 is the market's print for the day they were set.
Figures above come from the IDEXX exhibit filed on 2 November 2026, the IDEXX exhibit filed on 4 August 2026, the Quest Diagnostics exhibit filed on 22 October 2026, and the Yahoo Finance IDXX daily chart pulled on 3 November 2026. They are a record of those sources and are not a recommendation to buy or sell any security.