

The Goldman Sachs Group, Inc. (NYSE: GS) today reported net revenues of $18.68 billion and net earnings of $5.29 billion for the third quarter ended September 30, 2026. That sentence leads Exhibit 99.1 to the Form 8-K Goldman Sachs filed on 13 October 2026. The statement prints the same quarter as net revenues of $18,679 million and net earnings of $5,294 million. Morgan Stanley's Exhibit 99.1, filed the next day for the quarter ended 30 September 2026, leads with net revenues of $20.3 billion, printed as $20,338 million, and net income applicable to Morgan Stanley of $4,909 million.
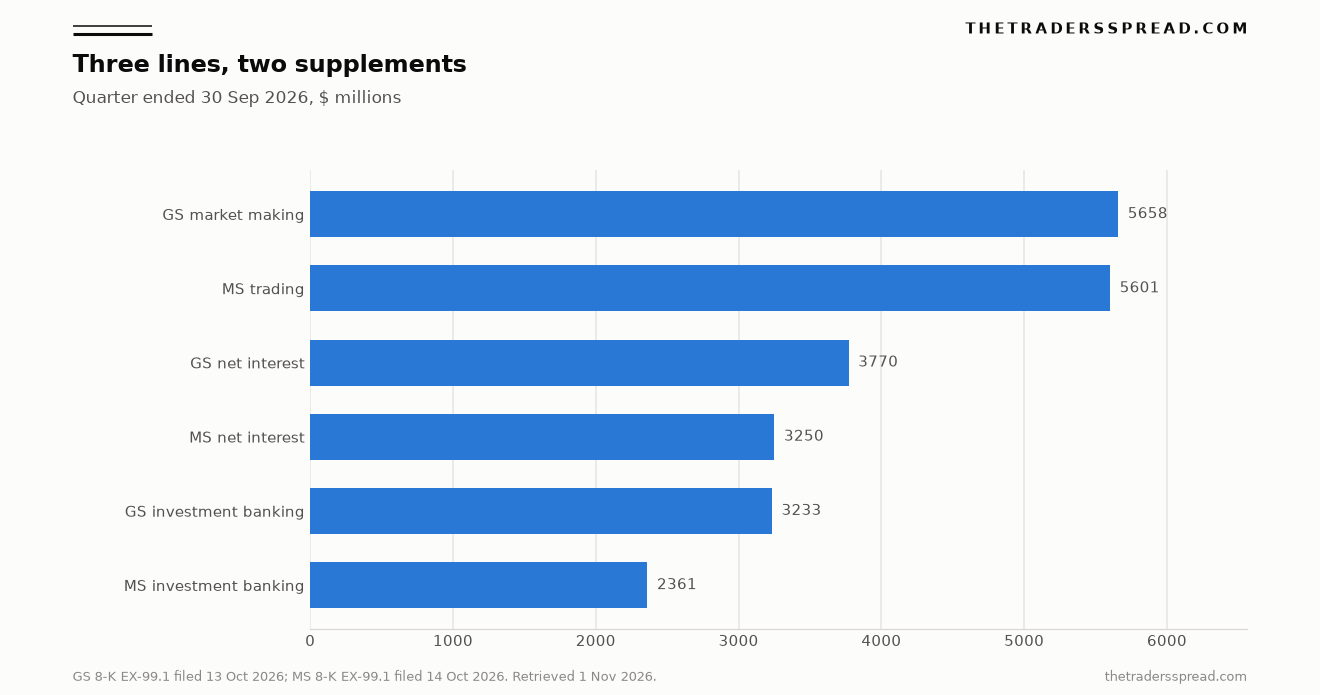
The labels, rather than those leads, are where the books diverge. Goldman Sachs reports Equities of $6.44 billion and FICC of $3.47 billion inside Global Banking & Markets. Morgan Stanley reports Equity of $5,799 million and Fixed Income of $2,011 million inside Institutional Securities. Added up, Goldman Sachs looks about $2.1 billion larger in markets. On the consolidated income statement the rows nearly meet: market making of $5,658 million at Goldman Sachs, trading of $5,601 million at Morgan Stanley.
Updated 1 November 2026.
Two supplements, one quarter
Both packets are earnings releases on a Form 8-K. Goldman Sachs filed accession 0000886982-26-000529 on 13 October 2026: Exhibit 99.1 is the results, Exhibit 99.2 the presentation. Morgan Stanley filed accession 0000895421-26-000288 on 14 October 2026: Exhibit 99.1 is the release, Exhibit 99.2 the financial supplement. On the EDGAR submissions lists retrieved on 1 November 2026, the newest Form 10-Q at each firm was still the quarter ended 30 June 2026, filed on 3 August and 4 August.
Income-statement lines in the releases are reported figures, while Goldman Sachs calls assets under supervision, capital ratios, risk-weighted assets, the supplementary leverage ratio and selected balance-sheet data preliminary, and Morgan Stanley calls its capital ratios estimates as of 14 October. Net interest income is interest income minus interest expense, and net revenues already sit after that subtraction. Investment banking on the consolidated page is a revenue category, and inside a segment it can be a narrower fee subtotal. Book value per common share is common equity divided by the period-end share count. Staying on a company's own lines, outside the banks, is the point of Compare Lam Research (LRCX) Earnings, Line by Line.
Where the consolidated lines sit
Dollar rows are the quarter ended 30 September 2026, from each Exhibit 99.1. Goldman Sachs's compensation percentage is the two printed dollar lines divided, and Morgan Stanley prints its own percentage. The quarterly efficiency ratio for Goldman Sachs is in Exhibit 99.2, and Morgan Stanley's common equity is the balance-sheet line in its Exhibit 99.2.
| Line | Goldman Sachs | Morgan Stanley |
|---|---|---|
| Net revenues | $18,679 million | $20,338 million |
| Investment banking | $3,233 million | $2,361 million |
| Market making, or trading | $5,658 million, market making | $5,601 million, trading |
| Net interest income | $3,770 million | $3,250 million |
| Compensation and benefits | $5,122 million | $7,997 million |
| Compensation as a share of net revenues | 27.4%, from the two lines above | 39%, as printed |
| Operating expenses, or total non-interest expenses | $11,308 million operating expenses | $13,712 million non-interest expenses |
| Efficiency ratio, quarter | 60.5% | 67% |
| Book value per common share | $372.64 | $68.59 |
| Common equity | $110,151 million | $107,359 million |
The chart below draws those three consolidated rows.
Goldman Sachs posted the results link on 13 October 2026, the morning of the filing, pointing at the release and the presentation.
$GS announces 3Q 2026 net revenues. View the full results, accompanying presentation, and learn more on our 9:30am ET conference call: https://t.co/3PaBwQLKxv pic.twitter.com/Sf78cP9DnS
— Goldman Sachs (@GoldmanSachs) October 13, 2026
Segment labels beside the trading line
Global Banking & Markets net revenues were $13,458 million, split into investment banking fees of $3,224 million, FICC of $3,471 million, Equities of $6,441 million and Other of $322 million. FICC plus Equities is $9,912 million, $4,254 million above consolidated market making, because financing moves to other rows on the consolidated page. FICC financing was $1,207 million and Equities financing $3,365 million, the balance-sheet cousin of net interest, beside intermediation of $2,264 million and $3,076 million.
Institutional Securities net revenues were $10,029 million: Investment Banking $2,159 million, Equity $5,799 million, Fixed Income $2,011 million and Other $60 million. Equity plus Fixed Income is $7,810 million, $2,209 million above consolidated trading of $5,601 million. The release ties the Equity increase of 41% to client activity, with Asia named, and the Fixed Income decline of 7% to credit and structured commodities.
| What the line covers | Goldman Sachs | Morgan Stanley |
|---|---|---|
| Markets-and-banking segment | Global Banking & Markets, $13,458 million | Institutional Securities, $10,029 million |
| Investment banking inside that segment | Fees, $3,224 million | Investment Banking, $2,159 million |
| Equities desk | Equities, $6,441 million | Equity, $5,799 million |
| Fixed income desk | FICC, $3,471 million | Fixed Income, $2,011 million |
| Wealth and asset management | Asset & Wealth Management, $5,051 million | Wealth Management, $9,065 million; Investment Management, $1,459 million |
| Remainder on the segment page | Platform Solutions, $170 million | Other inside Institutional Securities, $60 million |
Goldman Sachs's three segments reach firm net revenues exactly: $13,458 million, $5,051 million and $170 million sum to $18,679 million. Morgan Stanley's three headlines sum to $20,553 million, $215 million above consolidated net revenues, and the summary page leaves that elimination unpublished.
Investment banking on two rows
Consolidated investment banking and the segment fee line sit $9 million apart at Goldman Sachs and $202 million apart at Morgan Stanley. Goldman Sachs prints $3,233 million on the income statement and fees of $3,224 million in Global Banking & Markets. Advisory was $1,654 million, equity underwriting $666 million and debt underwriting $904 million, with Advisory described as a record on completed mergers. The fees backlog decreased versus the end of June. A backlog counts announced work, and revenue waits for a closing. The firm points to the June 10-Q for the definition.
Morgan Stanley prints consolidated investment banking of $2,361 million and an Institutional Securities line of $2,159 million, and leaves the product split of that $202 million unpublished. Wealth transactional revenue of $1,166 million includes investment banking along with trading and commissions, so part of the gap can sit there. Inside the segment, advisory was $887 million, equity underwriting $525 million and fixed income underwriting $747 million, so advisory is the wide gap against Goldman Sachs and debt underwriting is the nearest pair.
Net interest has an address
Goldman Sachs printed interest income of $22,793 million and interest expense of $19,023 million, so net interest income of $3,770 million, 5% below June and 2% below a year earlier. Morgan Stanley printed interest income of $16,188 million and interest expense of $12,938 million, so net interest of $3,250 million, 17% above June and 30% above a year earlier. The levels sit near each other. The year-on-year changes point opposite ways.
The presentation places about $2.32 billion of Goldman Sachs net interest in Global Banking & Markets, $751 million in Asset & Wealth Management and $704 million in Platform Solutions. Financing inside FICC and Equities is further balance-sheet income classified as non-interest, so folding it into net interest would tell the story twice. Morgan Stanley's wealth business printed net interest of $2,228 million, up from $1,991 million on lending growth and higher sweep deposits, the largest single home visible for the firm's $3,250 million. Platform Solutions, $170 million of net revenues and 72% lower than a year earlier, is the Goldman Sachs row with a blank cell on the Morgan Stanley map. The release ties the drop to Apple Card markdowns after that portfolio moved to held for sale. The three Goldman Sachs segments reach $18,679 million only with that $170 million included.
Pay ratios and the wealth payroll
A compensation ratio divides compensation and benefits by net revenues. Morgan Stanley prints 39% for the quarter, from $7,997 million on $20,338 million, against 41% a year earlier and 40% for the nine months. Goldman Sachs prints compensation of $5,122 million. Divided by $18,679 million, that is 27.4%. Wealth compensation at Morgan Stanley was $4,860 million of the $7,997 million, on wealth net revenues of $9,065 million, while Institutional Securities compensation was $2,632 million on $10,029 million. The firm ratio is pulled up by the advisor payroll. Goldman Sachs leaves compensation unsplit by segment. Headcount was 47,500 there, and 83,728 at Morgan Stanley.
The efficiency ratio divides a wider expense total by net revenues. Goldman Sachs operating expenses of $11,308 million are the presentation's 60.5%, and the nine-month ratio in the release is 59.4%. Morgan Stanley's ratio, total non-interest expenses over net revenues, is 67% for the quarter on $13,712 million of expenses, and 66% for the nine months. A lower ratio means expenses took a smaller share of that period's net revenues. Charitable contributions of about $450 million, in the Goldman Sachs presentation footnote, cut diluted earnings per share by about $1.00, and the printed 60.5% includes that gift.
Morgan Stanley's account posted the rounded lead on 14 October 2026: net revenues of $20.3 billion, net income of $4.9 billion, earnings per share of $3.03 and return on tangible common equity of 22.6%.
Q3 2026 earnings: Morgan Stanley reports third quarter 2026 net revenues of $20.3 billion, net income of $4.9 billion, EPS of $3.03 and ROTCE of 22.6%. Release: https://t.co/IGAXoLffbf pic.twitter.com/xf8O0NKvaY
— Morgan Stanley (@MorganStanley) October 14, 2026
Book value per share, and the equity behind it
Book value per common share was $372.64 at Goldman Sachs and $68.59 at Morgan Stanley, about 5.4 to 1. Dollar equity is a different story: common shareholders' equity of $110,151 million on 295.6 million basic shares, against common equity of $107,359 million on 1,565 million shares. Book value per share is a per-share print, not a measure of which firm holds the larger equity. Multiplying each per-share figure by the printed share count lands within rounding of those equity totals.
Tangible book value is a non-GAAP figure at both firms: $341.43 a share at Goldman Sachs, and $53.96 at Morgan Stanley on tangible common equity of $84,465 million. Standardized Common Equity Tier 1 was 12.4% at Goldman Sachs and 14.9% at Morgan Stanley. Supplementary leverage ratios were 4.3% and 4.8% in that same order. Total assets were $2,182 billion at Goldman Sachs, flagged as preliminary, and $1,692,273 million at Morgan Stanley.
Goldman Sachs bought 2.9 million shares for $3.00 billion, an average of $1,048.73, and Morgan Stanley bought about 7 million shares for $1,540 million, an average of $212.74, which is why per-share book value can rise faster than dollar equity. Annualized return on common equity was 18.7% and 17.8%. Earnings applicable to common shareholders were $5,122 million and $4,751 million, and diluted earnings per share were $17.01 and $3.03. A separate page follows JPMorgan through a different set of questions.
RelatedServiceNow (NOW) vs Salesforce (CRM) Contract Backlog
What a later 10-Q can still revise
The income-statement lines above are reported figures for a closed quarter. Goldman Sachs marks assets under supervision preliminary, at $4.097 trillion on the rollforward, and Morgan Stanley marks the capital ratios as estimates. Total client assets of $10.5 trillion in the Morgan Stanley chairman's comments use a different definition from that supervision total. Wealth net new assets were $232.4 billion, with just over half tied to IPO-related flows, so multiplying the quarter by four would misstate the franchise. After the September Forms 10-Q are filed, lines that move were preliminary or reclassified. A single-company revenue quarter is the shape of the Accenture revenue print.
Every figure here comes from Goldman Sachs Exhibit 99.1 and Exhibit 99.2, filed 13 October 2026, and Morgan Stanley Exhibit 99.1 and Exhibit 99.2, filed 14 October 2026, retrieved 1 November 2026.
Questions the two supplements raise
Which filing comes first?
The first document is each firm's Exhibit 99.1, the earnings release on the Form 8-K, filed by Goldman Sachs on 13 October 2026 and by Morgan Stanley on 14 October 2026 for the quarter ended 30 September 2026. The second exhibit is the Goldman Sachs presentation and the Morgan Stanley financial supplement, where segment detail and several ratios sit. Lists retrieved on 1 November 2026 still showed each firm's June 10-Q as the latest quarterly report.
Why is Goldman Sachs book value per share so much higher?
Goldman Sachs printed book value per common share of $372.64 and Morgan Stanley printed $68.59. Common equity was $110,151 million and $107,359 million. The gap is the share count, 295.6 million basic shares against 1,565 million. A higher per-share figure in this pair means the equity is split into fewer shares. Dollar equity is the comparison that shows the size of each book, and those two totals sit close together.
Are market making and trading the same line?
They are the closest pair on the consolidated income statements. Goldman Sachs printed market making of $5,658 million and Morgan Stanley printed trading of $5,601 million. Segment sums sit further out, because financing stays inside them: FICC plus Equities is $9,912 million at Goldman Sachs, and Equity plus Fixed Income is $7,810 million at Morgan Stanley. The consolidated line is the firm-level comparison. The segment line is the desk view.
Who prints the compensation ratio?
The ratio divides compensation and benefits by net revenues for the quarter. Morgan Stanley prints 39%, from $7,997 million of compensation on $20,338 million of net revenues. Goldman Sachs prints the dollars, and dividing $5,122 million by $18,679 million gives 27.4%. Mix explains much of the gap. Wealth compensation at Morgan Stanley was $4,860 million, the majority of the firm total, while the markets payroll is a smaller share of revenue.
What does the efficiency ratio measure?
It is expenses divided by net revenues for the period named beside it. Goldman Sachs shows 60.5% for the quarter, operating expenses of $11,308 million over net revenues of $18,679 million, and 59.4% for the nine months. Morgan Stanley shows 67% for the quarter, defined as total non-interest expenses over net revenues. A lower reading means costs took a smaller share of that period's net revenues. The ratio stays silent on either stock.
Which figures can the September 10-Q still change?
Both firms say the capital ratios are estimates and can change in the Form 10-Q for the quarter ended 30 September 2026. Goldman Sachs extends the warning to assets under supervision, risk-weighted assets, the supplementary leverage ratio and selected balance-sheet data. The income-statement lines in the table are the amounts reported in the earnings releases. The later 10-Q shows whether any of those reported lines was revised.
One question the supplements leave open
When both September Forms 10-Q reach EDGAR, which of the preliminary capital and balance-sheet lines will move, and which income-statement lines will the two firms leave exactly as these supplements printed them?
The figures above are records from the companies' own filings for the quarter ended 30 September 2026. They set no price target and give no instruction to buy or sell either stock.