

The Coca-Cola Company's Form 10-Q for the quarter ended 2 October 2026 states that unit case volume in North America was even, with 2% growth in Trademark Coca-Cola offset by a 4% decline in water, sports, coffee and tea.
That line is the consumer count where US finished-product revenue, $2,784 million, exceeded US concentrate revenue, $2,475 million. Consolidated net operating revenues still rose 7%, to $13,380 million from $12,455 million. The filing splits the 7% into 7 points of volume, 1 point of price/mix, 1 point of currency and a 1-point drag from acquisitions and divestitures. North America's own bridge was 2 points of volume and 1 point of price/mix, a 3% reported increase, against an even case count. A till count and a reported sales line are different objects, the split drawn on the Walmart sales, traffic and margin page.
Updated 4 November 2026
The bridge below is Item 2's estimate for the three months ended 2 October 2026 against the three months ended 26 September 2025. Geographic volume is concentrate sales after deals. Bottling Investments volume is unit case volume after structural changes. Rounding can leave a row off the printed total. Source: Form 10-Q filed 28 October 2026.
| Segment | Volume | Price/mix | Currency | Deals | Reported |
|---|---|---|---|---|---|
| Consolidated | 7% | 1% | 1% | (1)% | 7% |
| Europe, Middle East and Africa | 6 | 1 | 0 | (3) | 4 |
| Latin America | 8 | 7 | 9 | 0 | 25 |
| North America | 2 | 1 | 0 | 0 | 3 |
| Asia Pacific | 8 | (2) | (3) | 0 | 4 |
| Bottling Investments | 10 | 3 | 1 | 0 | 13 |
Worldwide unit case volume, on average daily sales, rose 5%. Concentrate sales rose 6%, and 7% after divestitures, matching the consolidated volume column. Exhibit 99.1, filed 27 October 2026, says concentrate sales ran 2 points ahead of unit cases because of shipment timing. Equity income of $653 million, from equity-method bottlers, sits outside the 33.4% operating margin.
Seven drivers, ordered by this print
Seven items move the Coca-Cola (KO) share over a long holding period: concentrate price and incidence, unit case volume, currency, marketing, input costs, tax, and the gap between a bottler's margin and a concentrate margin. The order here is a reading of this quarter. Operating income rose from $3,982 million to $4,465 million, an increase of $483 million, or 12%. Another page that separates operating factors from one print is the UnitedHealth factor page.
The filing credits a 7% rise in concentrate sales, favorable price/mix, lower commodity costs, lower other operating charges and a 3% favorable currency effect, partly offset by higher marketing. Volume is first on that wording, currency is ahead of the 1-point consolidated price/mix, and marketing is the named offset. Input costs helped the quarter and hurt the nine months. The margin gap is a level in the segments. Tax carries a contingency larger than the quarter, so it closes the list until a court outcome is in a filing.
Concentrate price and the price/mix residual
The 10-Q's word for concentrate price and mix is price/mix: the revenue change left after volume, currency, and acquisitions and divestitures. It bundles company and bottler pricing with category, package, channel and territory mix. Investors often call the concentrate piece of that residual incidence, and the filing's term is price/mix. A sticker price and the net price that reaches the seller are different measures, the distinction on the Novo Nordisk list-price and net-sales page.
Consolidated price/mix was 1% in the quarter and 1% over nine months. Latin America was 7%, from inflationary pricing and favorable mix. Asia Pacific was a 2% decline from unfavorable mix, and the nine-month bridge shows a 6% price/mix decline once affordability initiatives are in the mix. North America and Europe, Middle East and Africa were each 1%, with pricing partly offset by unfavorable mix, and Bottling Investments was 3%. Gross margin rose to 63.2% from 61.5%, which the filing ties to pricing, currency, steadier commodity costs and the Nigeria disposal.
Unit cases, and the shipment gap
A unit case is 192 US fluid ounces. Unit case volume counts finished drinks on average daily sales. Concentrate sales count syrup and related inputs and follow the number of days. Inventories, price-increase timing and consolidation open a gap: syrup sold to an unconsolidated bottler is revenue on that sale, while syrup sold to a consolidated bottler waits until the finished drink reaches a third party.
Case counts rose 5% in Europe, Middle East and Africa, 6% in Latin America and 6% in Asia Pacific, and were even in North America. Bottling Investments rose 8%, and 10% after structural changes. India and Southwest Asia rose 17%. Mexico rose 3% and Brazil rose 6%. Exhibit 99.1 says the consolidated case gain was led by India, China, Mexico and Brazil. The company expects full-year concentrate sales growth to finish slightly behind unit case growth.
Currency inside one company
Currency, including hedges, added 1 point to consolidated revenue and 3% to operating income in the quarter, and 2 points and 4% over nine months. A weaker dollar against the peso, the real, the rand and the yuan helped, and a stronger dollar against the yen, the rupee, the euro and the lira hurt. Latin America's reported revenue rose 25%, with 9 points from currency, and the filing assigns a 14% currency benefit to the rise in that segment's operating income from $897 million to $1,152 million. Asia Pacific carried a 3-point revenue headwind and a 6% operating-income headwind beside an 8% concentrate-sales increase.
Marketing, allocated by the case count
Advertising was $1,777 million, against $1,523 million, up $254 million, or 16.7%. Selling, general and administrative expenses were $3,975 million against $3,618 million, up 10%, which Item 2 ties to marketing and to the timing of incentive pay. Interim marketing that benefits more than one quarter is spread by each quarter's unit cases as a share of the estimated full-year case count. North America moved the other way: operating income rose there on volume, price/mix and lower marketing, while higher commodity costs pulled against that gain.
Henrique Braun, chief executive of The Coca-Cola Company, said in Exhibit 99.1 on 27 October 2026 that the quarter showed sustained momentum and supported updated guidance.
Input costs and a thin designated hedge
Commodity costs were lower in Europe, Middle East and Africa, Latin America and Bottling Investments, and higher in North America. Over nine months they offset the consolidated operating-income increase, alongside marketing, while gross margin still rose. Designated commodity derivatives had a notional value of $48 million on 2 October 2026, against $53 million at year-end. Economic hedges of materials and vehicle fuel, outside hedge accounting, were $807 million, up from $482 million, still small beside quarterly cost of goods sold of $4,930 million.
Tax, and the case still in court
Income tax was $777 million, against $500 million, and the effective rate was 16.1% against 11.9%. Pretax income rose 16%, to $4,833 million. Net income attributable to shareowners rose 8%, to $4,009 million, and diluted earnings per share rose 8%, to $0.93 from $0.86. The company expects about 19.7% for 2026 before significant items, and that rate leaves the IRS case aside.
The dispute covers 2007 through 2009. With interest, the company describes a $6.0 billion liability, paid as a deposit on 10 September 2024. Interest receivable was $589 million on 2 October 2026. The Eleventh Circuit heard the appeal on 25 June 2026, and the 28 October 2026 10-Q still treats it as open. The company states that it expects to prevail. Its estimate of remaining incremental tax and interest for 2010 through 2025 is about $14 billion as of 31 December 2025, plus about $450 million for the latest quarter if the Tax Court methodology holds, close to the quarter's $483 million operating-income increase.
Two margins in one share
Concentrate operations were $8,199 million of quarterly revenue, 61.3%, and finished-product operations were $5,181 million, 38.7%. Operating margins below are the company's. Segment gross margins are computed from Note 16, including intersegment sales, while the filing itself prints the consolidated 63.2%. Figures are in millions of dollars.
| Segment | Revenue | COGS | Gross margin, computed | Operating income | Operating margin |
|---|---|---|---|---|---|
| Europe, Middle East and Africa | 3,104 | 768 | 75.3% | 1,171 | 39.3% |
| Latin America | 1,958 | 293 | 85.0% | 1,152 | 58.9% |
| North America | 5,386 | 2,565 | 52.4% | 1,766 | 32.8% |
| Asia Pacific | 1,563 | 497 | 68.2% | 563 | 37.6% |
| Bottling Investments | 1,523 | 1,038 | 31.8% | 205 | 13.4% |
| Consolidated | 13,380 | 4,930 | 63.2% | 4,465 | 33.4% |
Eliminations were $192 million, so segment revenues sum above the consolidated total. Latin America kept a 58.9% operating margin. Bottling Investments reached 13.4%, from 4.2%, as operating income moved from $57 million to $205 million. An October 2025 agreement to sell a portion of Africa bottling to Coca-Cola HBC awaits approvals, with deconsolidation expected by the end of 2026 and an option on the remaining 25% within six years of closing. Assets held for sale were $6,275 million.
Where the reference price sits
KO closed at $94.80 on the New York Stock Exchange on 3 November 2026 at 4:00 pm Eastern, down $1.03, or 1.07%, from $95.83, on volume of 16,101,610 shares, on the stockanalysis.com quote retrieved 4 November 2026. In the daily-close file the high close was $95.83 on 2 November 2026 and the low close was $67.54 on 7 January 2026. From the 4 November 2025 close of $68.66, the unadjusted price rose 38.1%, and the chart uses those closes.
Related6 Walmart (WMT) Myths on Sales, Traffic and Margin
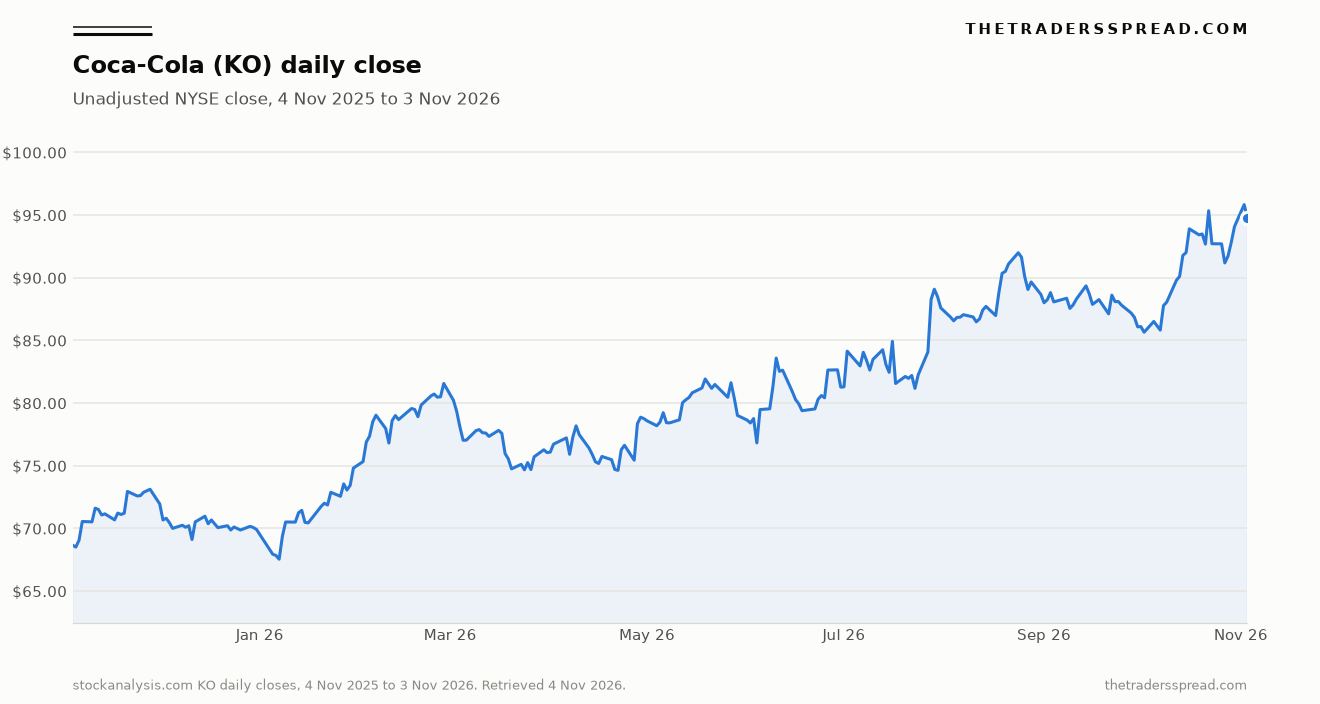
Shares outstanding were 4,301,902,335 on 26 October 2026, about $407.8 billion at the 3 November close, arithmetic across dates eight days apart. The October dividend is $0.53, payable 15 December 2026 to holders of record on 1 December, and four quarters at that rate are 2.24% of $94.80. Nine-month dividends paid were $6,842 million against $4,391 million on a payment-timing difference the filing describes. Repurchases were 10.0 million shares at $78.77. Cash from operations of $12,471 million less $1,063 million of capital spending is $11,408 million, beside the $11.4 billion free-cash-flow figure in Exhibit 99.1.
Key facts
- Net operating revenues were $13,380 million in the quarter ended 2 October 2026, up 7%, on 7 points of volume, 1 of price/mix, 1 of currency and a 1-point deal drag. Source: Coca-Cola Form 10-Q, Item 2, filed 28 October 2026.
- Unit case volume rose 5%, and concentrate sales rose 6%, or 7% after divestitures, running 2 points ahead of unit cases on shipment timing. Source: Form 10-Q Item 2, filed 28 October 2026, and Exhibit 99.1 filed 27 October 2026.
- Operating margin was 33.4% against 32.0%. Latin America was 58.9% and Bottling Investments 13.4%. Gross margin was 63.2% against 61.5%. Source: Form 10-Q Item 2 and Note 16, filed 28 October 2026.
- The effective tax rate was 16.1% against 11.9%. Operating income was $4,465 million, up 12%, and diluted earnings per share were $0.93. The company expects about 19.7% for 2026 before significant items. Source: Form 10-Q, filed 28 October 2026.
- The NYSE close was $94.80 at 4:00 pm Eastern on 3 November 2026, down 1.07% from $95.83. From the 4 November 2025 close of $68.66 the unadjusted rise is 38.1%. Source: stockanalysis.com, retrieved 4 November 2026.
FAQ
What does Coca-Cola mean by price/mix?
Price/mix is the revenue change left after volume, currency, and acquisitions and divestitures. The Form 10-Q filed on 28 October 2026 defines it as pricing by the company and its bottlers, plus mix across products, packages, channels and territories. In the quarter ended 2 October 2026 the consolidated figure was 1%, Latin America was 7%, and Asia Pacific declined 2%. Investors often call the concentrate-price piece incidence, which the filing names price/mix.
Why can unit case volume and concentrate sales diverge?
Unit case volume counts finished drinks sold by the Coca-Cola system on average daily sales. Concentrate sales count syrup and related inputs and follow the number of days. Inventories, price-increase timing and consolidation open a gap. In the latest quarter unit cases rose 5% and concentrate sales rose 7% after divestitures, a lead the company ties to shipments and expects the full year to give back.
How wide is the margin gap between concentrate markets and owned bottling?
Latin America's operating margin was 58.9% on $1,958 million of segment revenue in the quarter ended 2 October 2026. Bottling Investments' was 13.4% on $1,523 million. Computed from Note 16, gross margin was 85.0% in Latin America and 31.8% in bottling. Concentrate operations were 61.3% of revenue. Equity income of $653 million is bottler profit below the 33.4% consolidated operating margin.
What did currency do to the latest quarter?
Currency, including hedges, added 1 point to consolidated revenue and 3% to operating income in the three months ended 2 October 2026. Latin America's reported revenue rose 25%, with 9 points from currency and a 14% benefit to that segment's operating income. Asia Pacific had a 3-point revenue headwind and a 6% operating-income headwind. The peso, real, rand and yuan helped, and the yen, rupee, euro and lira worked the other way.
Where does the IRS transfer-pricing case stand?
The case covers 2007 through 2009. Coca-Cola paid a $6.0 billion deposit, with interest, on 10 September 2024, and carried $589 million of interest receivable on 2 October 2026. The Eleventh Circuit heard the appeal on 25 June 2026, and the 28 October 2026 10-Q still treats it as open. The company states that it expects to prevail. Further exposure is about $14 billion for 2010 through 2025 if the Tax Court method holds.
What would change the ranking
Volume leads because Item 2 names a 7% concentrate-sales increase first among the causes of the $483 million rise in operating income, and the bridge prints 7 points of volume against 1 of price/mix and 1 of currency. Tax sits last because the 16.1% effective rate is under the 19.7% full-year expectation, and the IRS amounts are a contingency rather than a line in operating income.
A later filing that records an appellate decision upholding the Tax Court methodology would move tax ahead of volume. About $14 billion of estimated incremental tax and interest for 2010 through 2025 is larger than quarterly operating income of $4,465 million, and the further $450 million assigned to the latest quarter is almost the entire $483 million increase. If the annual report then prints a wider gap than the 10-Q's "slightly" between full-year concentrate growth and unit cases, volume drops behind currency or price/mix. A fresh closing price would leave the order as it stands.
Figures above are reference data from The Coca-Cola Company's Form 10-Q filed on 28 October 2026, Exhibit 99.1 filed on 27 October 2026, and a stockanalysis.com quote timestamped 3 November 2026 at 4:00 pm Eastern. They are not a solicitation to buy or sell a security, and they do not set a price target.