

Is the five-year Treasury ladder pricing a fresh dip in the par yield, or a level the note already printed inside a window the book left open? It is pricing the dip the cash curve has still to print, and it is doing that on clocks that differ from the ten-year ladder rung by rung.
Two low events and two high events carry that question, and the rungs use different start dates. On the low five-year event a yes means the par yield in the "5 Yr" column prints lower than the strike on any date in that rung's window, which ends on 31 December 2026. Original rungs open on 3 September 2026. Rungs added on 23 October 2026 restart at creation. The ten-year events ask the same question of the "10 Yr" column, and their original window opens on 11 November 2025.
That start date is the comparison. From 11 November 2025 through 30 October 2026 the ten-year low in the Treasury file is 3.97 percent, on 27 February 2026, and the original "below 4.0 percent" leg is closed. From 3 September 2026 the five-year low is 4.52 percent, on 3 September itself, above every original five-year low strike through 4.50 percent. Moving a ten-year yes price onto the five-year book mixes a year of path already walked with a low-side path that has stayed above 4.50 percent.
The 30 October 2026 row of the Daily Treasury Par Yield Curve Rates shows the five-year at 4.71 percent and the ten-year at 4.94 percent, 23 basis points apart. The ladders resolve on the par curve, and a separate explainer sets out what a par yield is.
The low book is the market centred here, because it holds more resting size than the five-year high book. At 07:52 UTC on 31 October 2026 the gamma API showed about $58,987 of open interest on that event, beside the volume in the matrix below. The centred ladder is the five-year Treasury low book. Links to Polymarket are affiliate links, from which The Traders Spread may earn a commission at no cost to you.
Updated 31 October 2026
Two clocks, one curve
From the 3 September low of 4.52 percent the five-year par yield climbed through the original high strikes: 4.80 percent on 14 September, 5.03 percent on 24 September, the first row at or above 5.00 percent, and a peak of 5.09 percent on 30 September. Twelve sessions reached 5.00 percent or more, the last on 14 October at 5.00 percent exactly, before the yield fell to 4.71 percent on 30 October. Four early sessions printed 4.52, 4.54, 4.57 and 4.61 percent, all of them still above 4.50 percent.
The restarted window covers six sessions from 23 October through 30 October, with a five-year high of 4.85 percent on 28 October and a low of 4.71 percent on 30 October. A print at or above 4.80 percent sits in that stretch, in line with the re-listed "hit 4.80 percent" rung closing on 30 October 2026. Every print in the stretch sits below 4.90 percent and at or above 4.70 percent, so a rung created that day still refers to rows that have yet to print.
The rules, side by side
Dollar figures are gamma event totals, rounded to the nearest dollar, from the payloads retrieved on 31 October 2026. Yields are the Treasury par curve from the same retrieval.
| Axis | Five-year ladders | Ten-year ladders |
|---|---|---|
| Original window opens | 3 September 2026 | 11 November 2025 |
| Window ends | 31 December 2026 | 31 December 2026 |
| Par-curve column | 5 Yr | 10 Yr |
| Low-side touch test | A print lower than the strike | A print lower than the strike |
| High-side touch test, opening sentence | A print that reaches or is higher than the strike | A print that reaches or is higher than the strike |
| If the final rows are missing | Fail-safe outcome if the 31 December row is still missing at 23:59 Eastern Time on 14 January 2027 | Resolve on the data available 14 calendar days after the period ends |
| Restarted strikes | New lows from 4.55 percent to 4.70 percent, and several re-opened highs, take 23 October 2026 as the start | Lows added on 21 September and 22 October, plus the 5.4 percent high and the second 5.3 percent high, start at creation |
| Event volume, low book / high book | $403,947 / $225,266 | $512,951 / $1,116,938 |
| Event liquidity, low book / high book | $43,597 / $9,398 | $27,853 / $41,590 |
| Latest par yield, 30 October 2026 | 4.71 percent | 4.94 percent |
Equality separates the touch tests. The five-year print of 4.80 percent on 14 September 2026 settles a high rung at that strike, and the original five-year high rung closed the same day, while a low rung would have needed a print strictly under 4.80 percent. The low ladder tops out at 4.70 percent, on the later clock. The missing-data rows in the matrix are the two fail-safes, and they name different remedies.
A path ladder is a different object from a one-day bucket. A consumer-price bucket resolves on a single release, the structure behind the September CPI odds page. A Treasury ladder can close the morning after any business day that tags the strike. The funds-rate book counts policy moves, as on the rate-cut ladder, rather than reading a column of the par curve.
Reading the five-year low book
Every rung below is open on the low event updated at 07:52 UTC on 31 October 2026. Strikes through 4.50 percent use 3 September. Strikes from 4.55 percent were created on 23 October and use that creation window, and the yes price is the first number in outcomePrices. Volume and liquidity are rounded to the nearest dollar, and the bid and ask are the contract price in cents.
| Strike | Window opens | Yes price | Volume | Liquidity | Bid to ask |
|---|---|---|---|---|---|
| Below 4.00 percent | 3 September 2026 | 2.65 percent | $10,032 | $1,227 | 1.2 to 4.1 cents |
| Below 4.10 percent | 3 September 2026 | 6.7 percent | $16,650 | $15,244 | 6.3 to 7.1 cents |
| Below 4.20 percent | 3 September 2026 | 7.35 percent | $36,202 | $7,222 | 6.9 to 7.8 cents |
| Below 4.25 percent | 3 September 2026 | 8.9 percent | $26,452 | $7,712 | 7.9 to 9.9 cents |
| Below 4.30 percent | 3 September 2026 | 16.55 percent | $26,308 | $2,334 | 15.6 to 17.5 cents |
| Below 4.35 percent | 3 September 2026 | 22 percent | $49,562 | $2,920 | 21 to 23 cents |
| Below 4.40 percent | 3 September 2026 | 28.5 percent | $31,806 | $2,175 | 27 to 30 cents |
| Below 4.45 percent | 3 September 2026 | 37.5 percent | $52,918 | $1,763 | 37 to 38 cents |
| Below 4.50 percent | 3 September 2026 | 60 percent | $35,541 | $267 | 44 to 76 cents |
| Below 4.55 percent | 23 October 2026 | 57 percent | $13,157 | $266 | 56 to 58 cents |
| Below 4.60 percent | 23 October 2026 | 65 percent | $9,827 | $630 | 61 to 69 cents |
| Below 4.65 percent | 23 October 2026 | 90.5 percent | $76,145 | $1,293 | 89 to 92 cents |
| Below 4.70 percent | 23 October 2026 | 96.8 percent | $20,076 | $754 | 94 to 99.6 cents |
Size and the displayed price sit apart. The 4.10 percent rung carries $15,244 of liquidity, the most on the ladder, in a book eight-tenths of a cent wide. The 4.50 percent rung carries $267 against $35,541 of lifetime volume, and its 60 percent yes price is the midpoint of 44 to 76 cents, with the last trade at 43 cents. Along the original window the yes prices step up with the strike, and 4.45 percent is the tightest of those steps, at 37 to 38 cents.
The October rungs sit on a 4.71 percent print. "Below 4.70 percent" is 96.8 percent, with the book at 94 to 99.6 cents, and it needs a later row under 4.70. "Below 4.65 percent" is where the last trade and the displayed price part company: the last trade was 74 cents, the live book is 89 to 92 cents, and outcomePrices reads 90.5 percent, on the ladder's heaviest volume of $76,145.
A midpoint that sits out of order
Once the path already printed is set aside, two rungs ask about the same future. The 4.50 percent rung opened on 3 September, and the lowest five-year print since then is 4.52 percent, so that rung is still about a future row lower than 4.50 percent. The 4.55 percent rung opened on 23 October, and the lowest print since then is 4.71 percent, so that rung is about a future row lower than 4.55 percent. Any path that prints below 4.50 percent also prints below 4.55 percent, which puts the yes price on 4.50 percent at or under the yes price on 4.55 percent.
The displayed prices run the other way. OutcomePrices puts 4.50 percent at 60 percent and 4.55 percent at 57 percent. The 4.55 percent book is tight, 56 to 58 cents, on $266 of size. The 4.50 percent book is the wide one: its bid of 44 cents sits under 57, and its ask of 76 cents sits over it. The break is the midpoint the API displays, the figure a chart copies, inside a range that still covers the neighbouring price.
The reference fair on that rung is 47 percent, the average of 37.5 percent at the 4.45 strike and 57 percent at the 4.55 strike, 47.25 percent rounded to the nearest point. The 4.45 rung shares the original window. The 4.55 price is the logical cap, and its later start is the caveat on using it as a ceiling. Anchor rungs in the chart copy the displayed yes price as the reference fair. At 4.50 percent, 60 percent sits above 47 percent on the house scale. The 44-to-76 cent book contains 47 cents, so the gap belongs to the midpoint of a $267 book, while the last trade at 43 cents sits on the other side of 47.
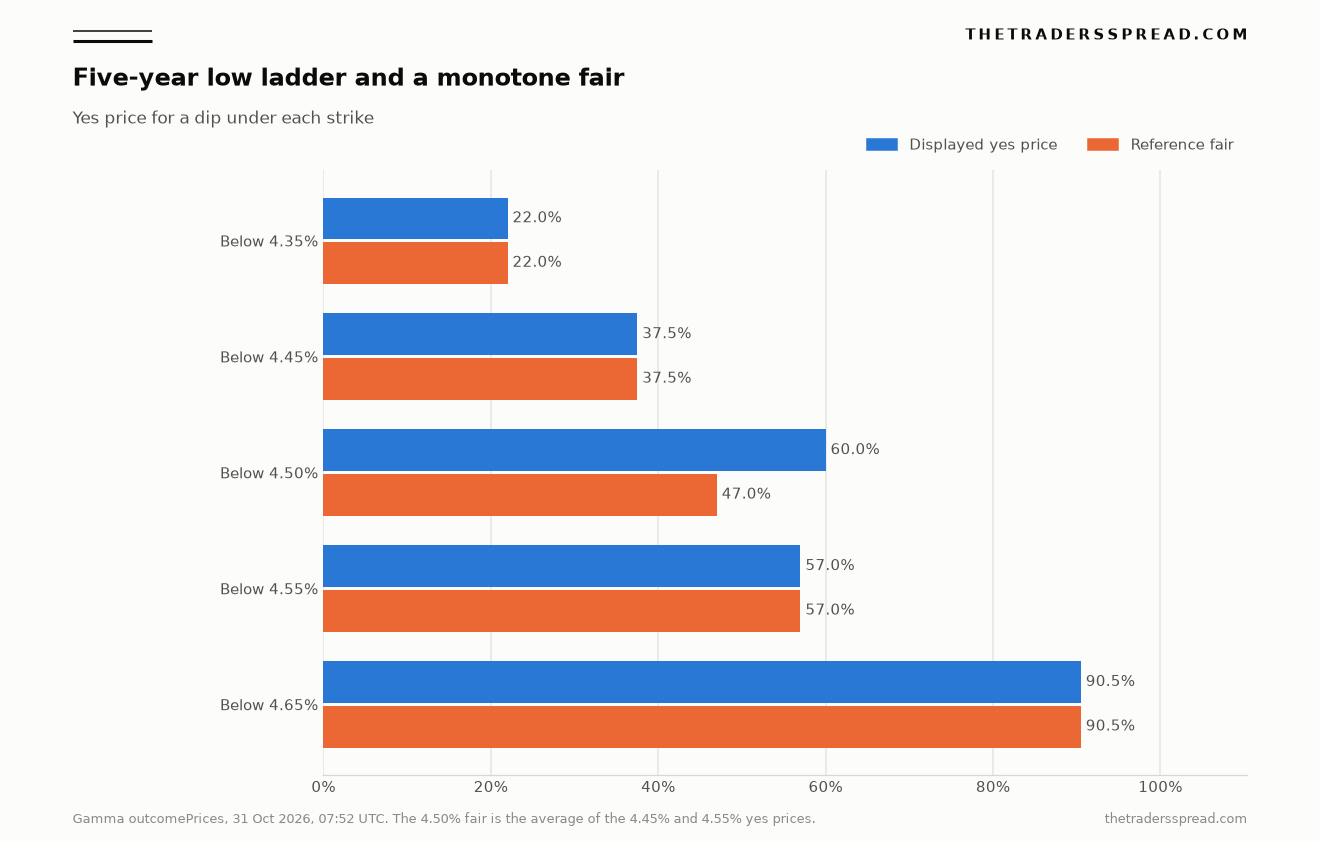
That figure is a probability on one contract, built from two neighbouring displayed prices, and it moves when those neighbours move. A later print under 4.50 percent would close the rung on the rules as written, on the row itself.
What the ten-year book has already closed
The original ten-year low rung at 4.0 percent closed on 28 February 2026, a session after the 3.97 percent print on 27 February. Deeper original strikes remain quoted, and on this retrieval "below 1.0 percent" and "below 2.0 percent" were each 1.9 percent, with "below 3.5 percent" at 1.4 percent and "below 3.9 percent" at 3.95 percent.
The live ten-year lows worth setting beside the five-year book were added after the yield had risen. "Below 4.8 percent" and "below 4.9 percent", created on 22 October 2026, count from creation, and the ten-year low since then is 4.94 percent. The 4.9 percent rung showed 92 percent, bid 89 to ask 95, on about $1,981 of volume. The 4.8 percent rung showed 73 percent on about $54,492. Updated at 07:54 UTC on 31 October, that book is the ten-year Treasury low ladder.
Polymarket's own account posted a weekly Treasury auction total on 30 October 2026, a supply headline that reaches these ladders through a later row of the par curve.
BREAKING: U.S. Treasury borrows a record $839,000,000,000.00 through debt auctions in a single week.
— Polymarket (@Polymarket) October 30, 2026
"Hit 5.0 percent" on the ten-year high book closed on 15 September 2026, the day the par yield printed 5.00 percent. "Hit 5.3 percent", created on 23 September with a window from creation, closed on 5 October 2026, the day of the 5.31 percent print. The second 5.3 percent leg, from 23 October, is open. The ten-year high since then is 5.05 percent, and about $505 traded on the whole high event in the past day. The open book is the ten-year Treasury high ladder.
RelatedDoes a US GDP growth bucket follow the advance print?
"Below 4.3 percent" and "below 4.4 percent", both created on 21 September 2026, showed 10.1 percent and 9.5 percent. The books overlap, 8.3 to 11.9 cents against 8 to 11 cents, a milder form of the five-year 4.50 against 4.55 pattern.
High strikes that are still live
Open highs on both ladders make the third matrix, from the same retrieval and the same rounding. A five-year high of 5.10 or 5.25 percent on the 3 September window has lived through the 5.09 percent peak. A high that uses 23 October has lived through a peak of 4.85 percent.
| Strike | Ladder | Window opens | Yes price | Volume | Liquidity | Bid to ask |
|---|---|---|---|---|---|---|
| 4.90 percent | Five-year | 23 October 2026 | 47.5 percent | $14,656 | $484 | 45 to 50 cents |
| 5.00 percent | Five-year | 23 October 2026 | 40.5 percent | $9,591 | $1,124 | 39 to 42 cents |
| 5.05 percent | Five-year | 23 October 2026 | 20.5 percent | $19,285 | $588 | 13 to 28 cents |
| 5.10 percent | Five-year | 3 September 2026 | 21.55 percent | $86,151 | $1,808 | 10 to 33.1 cents |
| 5.15 percent | Five-year | 23 October 2026 | 14 percent | $5,301 | $770 | 11 to 17 cents |
| 5.25 percent | Five-year | 3 September 2026 | 14 percent | $61,687 | $4,531 | 13 to 15 cents |
| 5.3 percent, re-listed | Ten-year | 23 October 2026 | 30 percent | $1,783 | $1,067 | 21 to 39 cents |
| 5.4 percent | Ten-year | 23 September 2026 | 22 percent | $88,935 | $9,964 | 21 to 23 cents |
| 5.5 percent | Ten-year | 11 November 2025 | 10.8 percent | $227,692 | $9,528 | 10.4 to 11.2 cents |
| 5.7 percent | Ten-year | 11 November 2025 | 5 percent | $128,446 | $9,576 | 4.7 to 5.3 cents |
| 6.0 percent | Ten-year | 11 November 2025 | 3 percent | $119,186 | $11,555 | 2.3 to 3.7 cents |
Two rungs at 14 percent show the trap in a shared label. The 5.25 percent five-year rung has been open since 3 September, through a 5.09 percent peak, in a 13-to-15 cent book. The 5.15 percent rung has been open only since 23 October. From 4.71 percent those strikes are 54 and 44 basis points away. On the original-window 5.10 percent rung the last trade printed 34.4 cents, outside a 10 to 33.1 cent ask.
The re-listed 5.00 percent rung shares a strike with a closed leg. The original closed on 24 September 2026, when the par yield printed 5.03 percent. The second, from 23 October, has seen a high of 4.85 percent. It sits with the 4.90 percent re-list on the five-year Treasury high ladder.
A checklist for the next ladder
The prints above will age. Each check below is a property of the contract text or of the quote, read before two yes prices are set side by side.
- The window comes from the rung itself, including a line that restarts the clock at market creation.
- The column is "5 Yr" or "10 Yr" on the Daily Treasury Par Yield Curve, the page named in the rules.
- A low rung needs a row strictly lower than the strike. A print equal to the strike leaves that low rung open.
- A high rung, on the opening sentence of both books, needs a row that reaches or exceeds the strike.
- A closed rung counts as history, including one that still displays a fully resolved mark.
- Neighbouring yes prices are read in strike order, and the bid-ask is read before the midpoint when the book is wide.
- A ten-year price is compared with a five-year price after the column and the window both match.
- The missing-data line belongs in the comparison, because the five-year text and the ten-year text name different fail-safes.
Read in that order, the list separates a short five-year clock from a long ten-year clock, a restarted strike from the original that shares its label, and a thin-book midpoint from a price the neighbours can support. The 30 October par yields, 4.71 and 4.94 percent, are the reference rows for this retrieval, and the next Treasury row replaces them.
Questions readers ask
Which column settles a five-year Treasury yield ladder?
The rules name the Department of the Treasury daily par yield curve, and the column headed "5 Yr", on both the high event and the low event. The ten-year ladders name the same page and the column headed "10 Yr". A constant-maturity series can match the par yield on a given day, as FRED did on 29 October 2026, and it remains a different series. The text points at the par curve.
Why can one strike show two prices?
A strike can be listed twice, with two windows. The original five-year rung for a print at or above 5.00 percent starts on 3 September 2026 and is closed, after the par yield printed 5.03 percent on 24 September 2026. A second rung with the same strike, created on 23 October 2026, counts from creation. At 07:50 UTC on 31 October its displayed yes price was 40.5 percent. What changed is the clock inside the contract.
Does the ten-year ladder answer the five-year question?
A ten-year yes price is a statement about the "10 Yr" column inside that rung's own dates. On 30 October 2026 the ten-year par yield was 4.94 percent and the five-year par yield was 4.71 percent, 23 basis points apart. The ten-year book has also closed strikes that the five-year book, with its later start, is still quoting. Using one displayed price as a stand-in for the other skips the column, the window and the restart.
Figures on this page are reference prints from the Treasury par curve, retrieved 31 October 2026, and from Polymarket's gamma API at the times cited beside them. The 47 percent reference on the 4.50 percent rung is an average of two neighbouring displayed prices, rounded to the nearest point. Position sizing, order choice and any forecast of the par yield sit outside this reference.