

Silver's rally is being explained by a supply deficit that has existed continuously for six years, which cannot be the explanation for anything that happened this month. Silver traded at $69.57 an ounce on 27 August 2026, up roughly 16% over thirty days — and still down 8.8% over ninety days and about 42% below the record near $121 it set in January. A structural deficit is a constant. It was equally present when silver printed $121 in January and when it collapsed toward $58 in July. Constants do not explain variables that swing that violently, and treating the deficit as this month's catalyst confuses the floor under an asset with the force that actually moves it.
What did move is measurable, and it is the relationship between the two metals rather than either one alone. The gold-to-silver ratio stands at 66.3, down from 69.5 in late July. Over the past twelve months that ratio has travelled from a high of 87.1 in September 2025 to a low of 45.4 on 28 January 2026 — the exact week silver peaked — and back up to the high sixties. That is a 92% swing in silver's price relative to gold inside a single year, on an asset whose physical supply-demand balance barely changed. Silver's monthly price is set by where it sits against gold in that mean-reverting band, not by the deficit. The deficit tells you where the floor is over a decade; the ratio tells you what happens over the next quarter.
Key Facts: Silver at a Glance
- Silver $69.57 an ounce and gold $4,611.10 on 27 August 2026 — gold-api.com spot prices
- Gold-to-silver ratio 66.3, against a 12-month high of 87.1 (9 September 2025) and low of 45.4 (28 January 2026) — The Traders Spread calculation
- Up 16.4% over 30 days, but down 8.8% over 90 days — iShares Silver Trust daily closes via stockanalysis.com
- Up roughly 76% over twelve months, from a 27 August 2025 low — stockanalysis.com
- Approximately 42% below the January 2026 record near $121 an ounce
- Sixth consecutive annual supply deficit of 46.3 million ounces, with industrial demand at 58% of total use — Silver Institute 2026 World Silver Survey, reported August 2026
- 90-day realised volatility 47.8% annualised, against 36.6% over 30 days — The Traders Spread calculation
What Actually Happened This Month
The move is real but narrower than the headlines suggest. Measured on the iShares Silver Trust, the most liquid proxy for the metal, silver gained 16.4% in the thirty days to 26 August and 2.6% in the final week. Spot silver reached $69.57, with gold at $4,611.10 and platinum at $1,852.00 on the same timestamp.
Now widen the lens by sixty days and the picture inverts. Over ninety days silver is down 8.8%. The August rally has not recovered the losses of May and June; it has partially retraced them. Anyone reading a 16% monthly gain as a breakout is looking at the shortest window that produces a positive number.
The twelve-month view adds the third dimension. Silver is up roughly 76% year-on-year, having risen from a low base in late August 2025. It is simultaneously up 76% on the year, down 8.8% on the quarter, up 16.4% on the month, and 42% below its January record. Every one of those statements is accurate, and quoting any one alone produces a materially misleading impression. This is what a 47.8%-volatility asset looks like from different distances, and it is why our markets page carries multiple horizons rather than a single change figure.
The Ratio Is the Mechanism
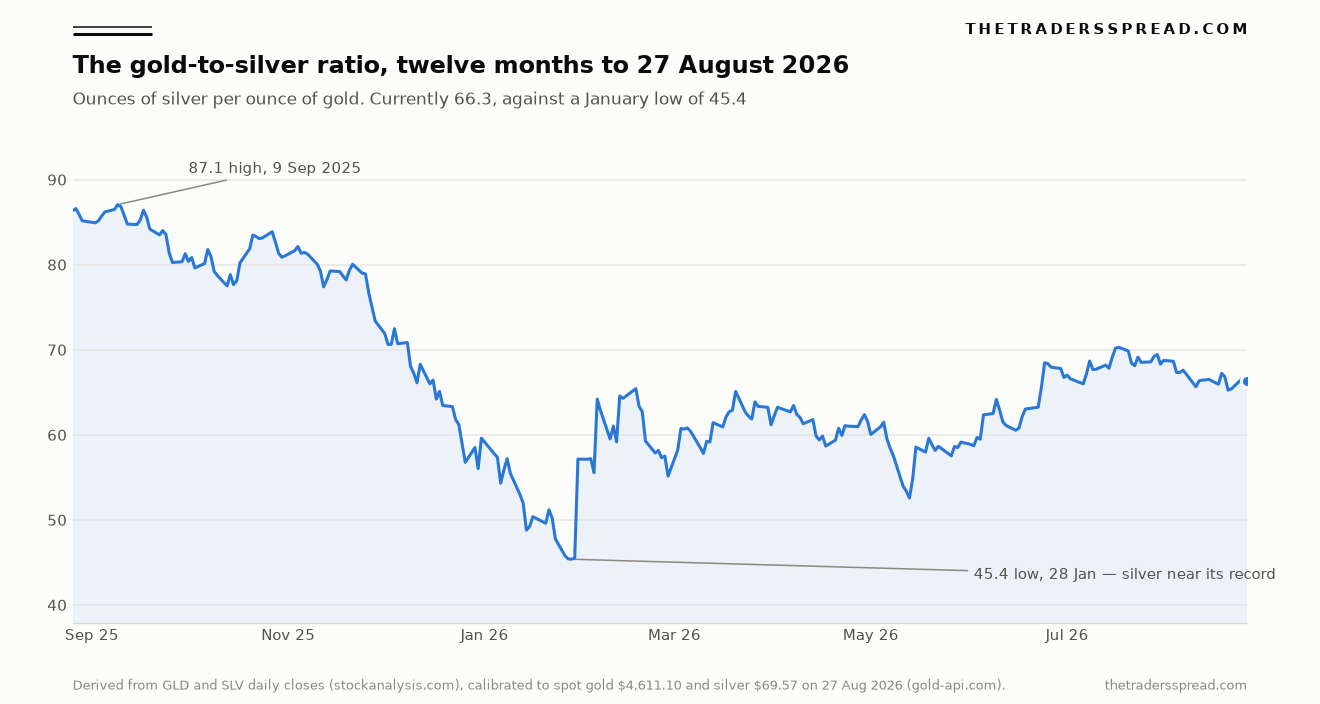
The gold-to-silver ratio expresses how many ounces of silver one ounce of gold will buy. Traders use it as a relative-value gauge: a high ratio means silver is historically cheap against gold, a low ratio means it is expensive. Over the past twelve months this ratio has done something remarkable.
| Date | Gold-to-silver ratio | What was happening |
|---|---|---|
| 9 September 2025 | 87.1 | 12-month high; silver historically cheap |
| 24 December 2025 | 61.2 | Silver re-rating hard against gold |
| 28 January 2026 | 45.4 | 12-month low; silver near its ~$121 record |
| 29 July 2026 | 69.5 | Full mean reversion; silver near $58 |
| 27 August 2026 | 66.3 | Compressing again |
Read that table against the price and the causation becomes hard to miss. Silver's January record coincided precisely with the ratio's twelve-month low of 45.4 — that is the same event described two ways, because a record silver price relative to a rising gold price is a collapsed ratio. The subsequent 42% price decline coincided with the ratio reverting to 69.5. And the current 16% monthly rally coincides with the ratio compressing from 69.5 to 66.3.
Here is the synthesis that matters for position sizing. Across this twelve-month window the ratio's range has been 45.4 to 87.1. At 66.3 it sits almost exactly at the midpoint — 50.2% of the way through its own annual range. Silver is neither cheap nor expensive against gold on its recent history. The easy relative-value trade, in either direction, has already been taken. That is a very different proposition from the "silver is structurally scarce and therefore going up" argument, which was equally available at 45.4 in January and cost anyone who acted on it 42%.
It is worth making that range concrete. Hold gold still at $4,611.10 and let the ratio alone move across the band it has already visited in the past twelve months, and silver lands in wildly different places: at the January ratio of 45.4 silver would be $101.57; at 60 it would be $76.85; at today's 66.3 it is $69.55; at 75 it would be $61.48; and at the September 2025 high of 87.1 it would be $52.94. That is a span of roughly $49 an ounce, or 92% of the current price, generated by the ratio alone with no change in the gold price and no change in the supply deficit. It is the single clearest illustration of where silver's risk actually lives.
Platinum offers a useful control on the argument. At $1,852.00 an ounce on the same timestamp, platinum is the other major precious metal with a majority-industrial demand profile, and it has not tracked silver's monthly move. If a generalised industrial-scarcity narrative were driving precious metals, the two would move together far more closely than they do. The divergence points back at the same conclusion: silver's month was a relative-value move against gold, not a sector-wide repricing of industrial metals.
The deficit data deserves its due, because it is genuine. The Silver Institute's 2026 World Silver Survey records a sixth consecutive annual supply deficit, most recently 46.3 million ounces, with industrial demand accounting for 58% of total consumption. Solar, grid modernisation, electric vehicles and data-centre hardware all consume silver in ways that do not return it to the market. That is a real and durable bid. It is also a slow one, measured in tens of millions of ounces a year against a market that reprices by 40% in a quarter.
Industrial Versus Monetary, and Why It Cuts Both Ways
Silver's dual identity is the source of both its returns and its drawdowns. With industrial demand at 58% of total use, more than half of silver's consumption is tied to the manufacturing cycle. That is the part of the story most often told as unambiguously bullish, on the reasoning that solar and electrification are secular growth markets.
The overlooked half is that industrial demand is cyclical and monetary demand is not. Gold's buyers — central banks, reserve managers, insurance-motivated investors — do not stop buying because a purchasing managers' index softens. Silver's largest single demand category does exactly that. In a growth scare silver loses its industrial bid precisely when the monetary bid that supports gold is strengthening, which is the mechanical reason the ratio spikes toward 87 in risk-off conditions and compresses toward 45 when the industrial cycle runs hot.
This is why silver's realised volatility of 47.8% over ninety days is structural rather than incidental. The metal is levered to two uncorrelated demand functions that periodically pull in opposite directions. Traders comparing it to the rest of the commodities desk should treat it less as gold's cheaper cousin and more as a hybrid of a precious metal and an industrial input, priced accordingly.
The AI infrastructure cycle now sits directly inside this story. Data-centre construction consumes silver in electrical contacts, connectors and power distribution, which is one reason the metal has tracked the capital-expenditure cycle so closely this year — the same cycle visible in Nvidia's latest results, where guidance implied continued heavy build-out. That linkage is genuine, and it is also a concentration risk: it ties a meaningful slice of silver's marginal demand to the capital budgets of a handful of hyperscalers.
Regulation, Physical Delivery and the Squeeze Question
Silver periodically attracts squeeze narratives, and the market structure makes them plausible enough to require a serious answer. The metal trades primarily through the London bullion market and COMEX futures, where paper claims vastly exceed readily deliverable physical inventory in any given week. When retail enthusiasm converges on that gap, the resulting price action can be violent — January's move to $121 had that character.
Regulators have taken an interest in exactly this dynamic. Position limits on COMEX silver futures, administered under the Commodity Futures Trading Commission's framework, exist to constrain concentrated speculative positions, and the LBMA publishes vault holdings data specifically so that the physical base is observable. Neither mechanism prevents volatility; both are designed to ensure it is visible rather than hidden.
The practical point for anyone trading silver through contracts for difference or spread bets is that they hold no claim on physical metal whatsoever. In a genuine delivery squeeze, the spot price and the price a leveraged retail product will fill at can diverge sharply, and financing costs on a held position compound while that plays out. That is a structural feature of the instrument rather than a criticism of any venue; our broker comparison sets out where those financing costs differ on metals.
What This Changes
The relative-value trade is now neutral. At a ratio of 66.3, sitting at the midpoint of its twelve-month range, silver is neither historically cheap nor expensive against gold. The asymmetry that existed at 87 in September 2025 and at 45 in January 2026 has gone. Anyone entering now on relative-value grounds is doing so without the statistical edge that was available at either extreme.
Watch the ratio, not the deficit. The supply deficit will still be reported next year and the year after; it has been reported for six consecutive years and did not prevent a 42% drawdown. The variable that has actually tracked silver's price on a monthly horizon is its ratio to gold. A move back toward 60 would imply meaningful silver outperformance from here; a move back toward 75 would imply the July weakness resuming.
RelatedAntimony Price Prediction: 112,000 Yuan Bull vs 94,000 Bear
Industrial data now matters more than monetary data. With 58% of demand industrial, manufacturing indicators and hyperscaler capital-expenditure guidance are more informative for silver than central-bank commentary — an inversion of how most commodity desks are set up to think about precious metals.
What would change this reading: a decisive ratio break below 60, which would suggest the January dynamic restarting rather than a normal oscillation; or a sharp deterioration in industrial indicators, which would remove the majority of silver's demand base while leaving gold's intact and push the ratio back toward the eighties.
Frequently Asked Questions
Why is the silver price rising in August 2026?
Silver gained about 16.4% over thirty days to $69.57 an ounce, principally through outperformance against gold — the gold-to-silver ratio compressed from 69.5 in late July to 66.3. The widely cited supply deficit is a genuine long-term support but has been present for six consecutive years and does not explain month-to-month moves.
Is silver still below its record high?
Yes, by a wide margin. Silver reached approximately $121 an ounce in January 2026 and now trades at $69.57, roughly 42% below that peak. It is also down 8.8% over ninety days, despite being up around 76% over twelve months. The window you choose determines the answer entirely.
What is the gold-to-silver ratio telling us?
At 66.3 it sits near the midpoint of its twelve-month range of 45.4 to 87.1, which means silver is fairly valued against gold on recent history. High readings historically indicated silver was cheap relative to gold; low readings, as in January 2026, indicated the opposite and preceded a sharp silver decline.
Why is silver more volatile than gold?
Because roughly 58% of silver demand is industrial and therefore cyclical, while gold's demand is predominantly monetary and counter-cyclical. In a growth slowdown silver loses its largest demand source at the same moment gold gains support, which widens the ratio sharply. Silver's 90-day realised volatility is 47.8% annualised.
What is the silver supply deficit?
The Silver Institute's 2026 World Silver Survey records a sixth consecutive annual deficit, most recently 46.3 million ounces, meaning consumption exceeds mine supply and recycling. Industrial applications including solar panels, grid infrastructure, electric vehicles and data-centre hardware consume silver in forms that are rarely recovered.
Does the deficit guarantee higher silver prices?
No. The deficit was present throughout the 42% decline from January's record to July's low, and throughout the subsequent rally. Persistent physical tightness supports the long-run floor but has demonstrably not prevented large drawdowns, because monthly pricing is driven by positioning and relative value against gold rather than by annual supply balances.
Analysis and information only; not investment advice. Commodities and leveraged products carry a high risk of rapid loss. Spot prices cited are as at 27 August 2026; percentage changes are calculated on iShares Silver Trust daily closes as a proxy for the metal. Featured image: silver and clad half dollars by BrayLockBoy, CC BY-SA 4.0 via Wikimedia Commons.
