

We built NOK/SEK this morning from the two dollar rates on the 30 October European Central Bank reference, because a screen that offers one Scandinavian cross is offering a ratio. Frankfurter, at 07:58 UTC on 31 October 2026, gave 9.2302 Norwegian kroner per dollar and 9.8264 Swedish kronor per dollar for that fixing. Divide the Swedish figure by the Norwegian figure and the cross is 1.06459 kronor per krone.
The dollar drops out once the build starts from the euro rates the ECB actually publishes. Pulled from the ECB Data Portal at 07:59 UTC the same morning, those prints are 10.312 kroner per euro, 10.978 kronor per euro and 1.1172 dollars per euro, each the 14:15 CET reference. Kronor divided by kroner is 1.06458. The dollar-leg division sits 0.000007 higher, which is the four-decimal rounding on the dollar rates. Sveriges Riksbank's SEKNOKPMI series printed 1.06458 that day, the euro ratio taken to five decimals.
Across the 255 reference days from 31 October 2025 to 30 October 2026 the same construction rose from 0.93789 to 1.06459, a gain of 13.5 percent. About 70 percent of the log change came from the fall in the Norwegian dollar rate, and about 30 percent from the rise in the Swedish dollar rate. The climb had two parents, and the krone's dollar leg was the larger of them.
Updated 31 October 2026
Start from the two dollar prints
The workable habit is to refuse the cross until both legs are on the desk, from one source, with one timestamp. On this pull the source was Frankfurter's latest endpoint with the dollar as the base and NOK and SEK as the symbols, and the body came back dated 30 October 2026. That date is the fixing day. The retrieval clock, 07:58 UTC on 31 October, is a Saturday, so the file is Friday's reference and it will sit there until the next ECB business day.
Read the units before the decimals. A print of 9.2302 means one dollar buys 9.2302 kroner, and a print of 9.8264 means one dollar buys 9.8264 kronor. A higher dollar rate is a weaker local currency. The two numbers can rise together, fall together, or part company, and only the last of those changes the cross by much. Writing them down as a pair, with the fixing date beside them, is the whole of the first step. A cross taken from another vendor, or from a mid-price at another hour, is a different object and belongs in a different division.
The Norwegian dollar rate has its own page, the USD/NOK forecast, and the Swedish dollar rate has the USD/SEK forecast. Those pages follow each leg on its own terms. The arithmetic here stops once the ratio exists, and each forecast keeps the directional work that belongs to its leg.
Divide, and keep the units next to the result
NOK/SEK, in the quoting convention used here, is Swedish kronor per one Norwegian krone. That is the Swedish dollar rate divided by the Norwegian dollar rate. On the 30 October prints the division is 9.8264 divided by 9.2302, which equals 1.06459232, or 1.06459 once it is cut to five decimals. One krone corresponded to 1.06459 kronor at that reference.
The dollar rates are themselves ratios, which is why the dollar disappears. Kroner per dollar equals kroner per euro divided by dollars per euro. Kronor per dollar equals kronor per euro divided by dollars per euro. Divide the second identity by the first and the dollars-per-euro term sits on both sides of the fraction. What remains is kronor per euro divided by kroner per euro. A desk that only ever divides the two dollar prints still gets that ratio, plus whatever rounding the dollar prints already carry.
A plain percent change leaks once the moves get large, and the year in this file is large enough to show the leak. From 31 October 2025 to 30 October 2026 the Swedish dollar rate rose 3.9215 percent and the Norwegian dollar rate fell 8.4469 percent. Subtracting those percent changes gives about 12.4 percentage points. The cross itself rose 13.5 percent. The exact split is in logs. The change in the log of the cross equals the change in the log of the Swedish dollar rate minus the change in the log of the Norwegian dollar rate: 0.038465 minus a change of −0.088251, which equals 0.126717. The log change in the cross is the same figure. Of that 0.126717, the Norwegian leg contributes 0.088251, or 69.6 percent, and the Swedish leg contributes 0.038465, or 30.4 percent.
Run the same division on the euro legs
The cleaner build skips the dollar. On 30 October the ECB published 10.978 kronor per euro and 10.312 kroner per euro, confirmed on the ECB Data Portal series for the krone and the matching series for the krona and the dollar. The division is 10.978 divided by 10.312, which equals 1.06458495. Rounded to five decimals, that is 1.06458. The dollar-leg result, 1.06459, is one tick away at that precision, and the distance between the unrounded figures is 0.000007.
Frankfurter stores the dollar rates at four decimals. Dividing 10.312 by 1.1172 produces 9.230218, stored as 9.2302. Dividing 10.978 by 1.1172 produces 9.826352, stored as 9.8264. Dividing those stored numbers puts the rounding back in. The Riksbank can therefore agree with the euro legs and sit one tick off the rounded dollar legs on the same afternoon. Both builds are the ECB set. One of them takes a detour through a rounded dollar.
The history pull, Frankfurter from 31 October 2025 with the dollar as the base, returned 255 dates through 30 October 2026 in that same 07:58 UTC response. The matching euro file, same dates, was retrieved a few seconds earlier. On every date the euro-leg ratio and the dollar-leg ratio differed by less than 0.000011. Inside this window the two builds stayed one number, and the gap is the stored rounding.
The euro rates have their own forecast pages, and those pages are about the euro. The krone against the euro is the EUR/NOK forecast. The krona against the euro is the EUR/SEK forecast. Either page can move for a reason that cancels in NOK/SEK. A reader who wants the cross keeps both, and divides.
Set the central-bank prints beside the ratio
Oslo and Stockholm each publish a bilateral figure. On 30 October both of them landed on this ratio at the precision they print.
Norges Bank's EXR table for 30 October, retrieved from the bank's data API on 31 October, shows three spot rates at the ECB concertation time of 14:15 CET. One dollar bought 9.2302 kroner, one euro bought 10.312 kroner, and one hundred Swedish kronor bought 93.93 kroner. The SEK series is stored with its calculated flag set to false, so the bank is labelling that row as a concertation quote rather than as a series derived afterwards from the other two. Invert the published SEK quote all the same. One hundred divided by 93.93 equals 1.06462 kronor per krone. Round the euro ratio onto the same grid: one hundred times 10.312 divided by 10.978 equals 93.933, which rounds to 93.93. At two decimals per hundred kronor, the Oslo bilateral and the ECB ratio are the same observation. The rounded dollar pair lands on 93.93 as well.
The Riksbank figure is tighter, so it can separate the two builds. SEKNOKPMI on 30 October 2026 was 1.06458, retrieved from the SWEA API the same morning. That matches 10.978 divided by 10.312, cut to five decimals. The rounded dollar division, 1.06459232, cuts to 1.06459 instead. The same API gave SEKEURPMI at 10.978 and SEKUSDPMI at 9.82635. The euro rate is the ECB print carried across. The dollar rate is the unrounded ECB cross, kept to five decimals where Frankfurter keeps four. Stockholm's NOK series is the euro ratio. It is a published bilateral rate, and the digits are still the ratio.
Split a move across the two legs
Once the cross is a ratio, a move in it is a gap between two moves. The useful question on any window is which leg opened the gap.
Take 14 April 2026 to 13 May 2026, twenty reference-day steps. The Norwegian dollar rate went from 9.4132 to 9.1690, down 2.59 percent, so the krone strengthened against the dollar. The Swedish dollar rate went from 9.1563 to 9.3171, up 1.76 percent, so the krona weakened against the dollar. The cross went from 0.97271 to 1.01615, up 4.47 percent. Both legs pushed the same way. In the log split, about 60 percent of the rise sits in the Norwegian leg and about 40 percent in the Swedish leg.
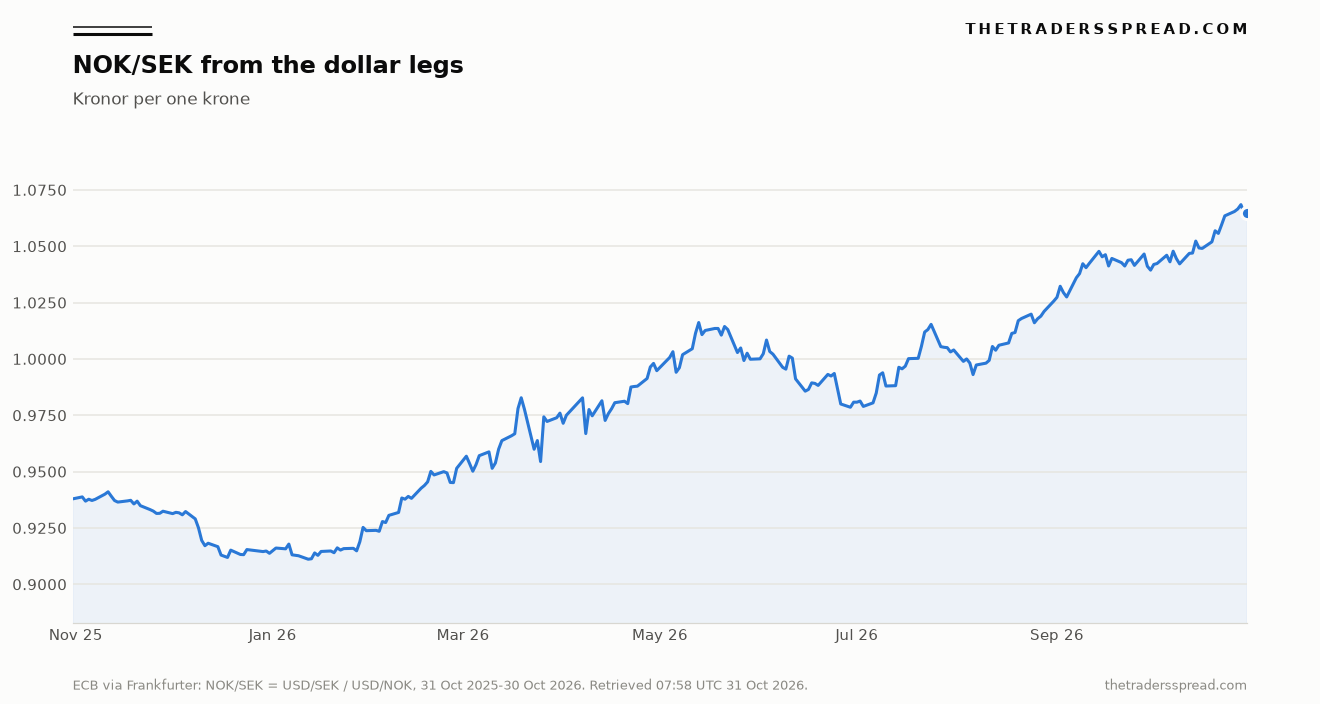
The low of the constructed series was 0.91113 on 12 January 2026, from dollar rates of 10.0449 and 9.1522. The high was 1.06847 on 28 October 2026, from 9.2944 and 9.9308. Between those dates the krone's dollar rate fell and the krona's dollar rate rose, and the cross rose with that gap. In October both dollar rates fell, the krone by 4.11 percent and the krona by 2.02 percent, and the cross still rose 2.18 percent because the krone strengthened by more. Had those shares been reversed, a firm dollar complex would have come with a lower cross.
A flat cross can hide a large dollar move
The mirror image is the window where the cross looks asleep. From 29 December 2025 to 27 January 2026, again twenty reference-day steps, the cross went from 0.91452 to 0.91485, a rise of 0.035 percent. Over those same steps the Norwegian dollar rate fell from 10.0518 to 9.6965, down 3.53 percent, and the Swedish dollar rate fell from 9.1926 to 8.8708, down 3.50 percent. Both currencies strengthened against the dollar by almost the same proportion, and the ratio barely moved.
RelatedCAD/CHF Price Prediction: 0.62 Bull Case vs 0.56 Bear Case
A chart of the cross alone would have filed that stretch as quiet. The log change in the cross is 0.00035, against log changes near 0.036 in each leg, so the shared dollar move disappears from the ratio. A still cross is a finding about the gap between the legs.
The mirror case is both currencies weakening, one of them faster. From 29 May 2026 to 26 June 2026 the Norwegian dollar rate rose from 9.2524 to 9.9145, up 7.16 percent, and the Swedish dollar rate rose from 9.2511 to 9.7163, up 5.03 percent. The cross fell from 0.99986 to 0.98001, down 1.99 percent, because the krone weakened against the dollar by more than the krona did. A joint selloff against the dollar and a lower cross were the same fortnight only through that gap.
The day both dollar rates printed the same number
On 4 August 2026 the two dollar rates remove the last excuse for treating the cross as a separate discovery. The Norwegian dollar rate and the Swedish dollar rate both printed 9.5462, so the ratio was exactly 1. The euro rates underneath told the same story with the dollar already gone: 10.9925 kroner per euro and 10.9925 kronor per euro, with the dollar at 1.1515 per euro. Divide either pair and the cross is 1.00000 on both builds, because the two inputs were identical.
Parity that day was the two legs matching. By 30 October the same construction stood at 1.06459, up 6.46 percent from that print of 1, with the Norwegian dollar rate down 3.31 percent from 9.5462 and the Swedish dollar rate up 2.94 percent from the same starting figure. The log split of that rise is about 54 percent the krone's gain against the dollar and about 46 percent the krona's loss against the dollar. The move away from 1 is still two legs.
Repeating the build on a later fixing takes six moves, and each one uses the legs.
- Pull kroner per euro, kronor per euro and dollars per euro from the ECB for one fixing day, and write the retrieval time next to the fixing date.
- Divide kronor per euro by kroner per euro. That figure is NOK/SEK in kronor per krone, before any dollar rounding.
- Where the screen shows dollar rates, divide kronor per dollar by kroner per dollar and compare. A gap inside the last stored decimal is rounding. A wider gap on the same day means the two pulls come from different fixings.
- For a second date, repeat the division. The log change in the cross equals the log change in the Swedish dollar rate minus the log change in the Norwegian dollar rate.
- Where the two dollar rates moved by nearly the same percent, expect a quiet cross, including on days when both currencies moved a long way against the dollar.
- Set the Riksbank SEKNOKPMI print, and the Norges Bank SEK quote inverted, beside the ratio. Read each at the number of decimals that institution prints.
What would make the two-leg reading fail
The reading fails when a price is still there after the ratio is taken out. Three observations would qualify, and each one is a number a later fixing could print.
The first is a same-day official print that misses the ratio by more than its own rounding. On 30 October the Riksbank figure matched the euro division at five decimals, and Oslo's 93.93 matched that division once it was expressed per hundred kronor and cut to two decimals. A later SEKNOKPMI of 1.06470, or an Oslo quote of 93.80, against these same euro inputs, would be a real disagreement. The test uses the bank's own grid. One unit in the last place they print is the tolerance. Past that, on inputs from the same concertation, the print is a different price.
The second break sits inside the ECB file. Across these 255 dates the dollar-leg ratio and the euro-leg ratio stayed within 0.000011, which is what four-decimal dollar storage costs. A same-day gap of several pips, computed from the unrounded euro rates rather than from already-rounded dollar rates, would mean the cancellation had failed or the dates had been crossed. Either one ends the claim that the two builds are one number.
The third is a wholesale kroner-for-kronor price that stays outside the cost of dealing the two liquid legs for longer than a fixing window. Selling the rich cross and buying it back through EUR/NOK against EUR/SEK, or through the two dollar rates, would leave that wedge untouched only if the cross were clearing away from both legs. A closed leg, a capital control, or a screen labelled NOK/SEK that is actually some other pair would produce a wedge of that kind. This morning's references are the ECB pair, the Riksbank print and the Oslo quote, one ratio at three precisions. A later session that leaves such a wedge in place would be the session that makes this reading fail.
The rates and the ratios above are reference data and arithmetic on that data, and they are not a recommendation to take a position in the krone or the krona.