

On the Central Bank of Kenya forex screen fetched on 18 November 2026, the sidebar still posted the US dollar at 129.98 with a stamp of 17 November, while the indicative table on the same site printed USD/KES at 129.9900 shillings per dollar for 18 November. The pair is shillings for one dollar, so a higher print is a weaker shilling. The comfortable reading of that screen is that a market this quiet has already found its level.
The table argues with the comfort before any path is attached. The 18 November print is three hundredths of a shilling above the 17 November row, and seven hundredths under 130.06, the highest indicative dollar rate of 2026, set on 8 April. A screen that looks finished is sitting on the ceiling of its own year.
| Session | US dollar | Sterling | Euro |
|---|---|---|---|
| 5 November 2026 | 129.96 | 175.18 | 146.27 |
| 12 November 2026 | 129.96 | 172.72 | 144.38 |
| 17 November 2026 | 129.9800 | 171.4400 | 143.0900 |
| 18 November 2026 | 129.9900 | 171.5600 | 142.8700 |
Across the week the 13 November bulletin described, the dollar column was 129.96 on 5 November and 129.96 on 12 November. Sterling fell 2.46 shillings in that same pair of rows, from 175.18 to 172.72, and the euro fell 1.89 shillings, from 146.27 to 144.38. The bulletin's sentence on the exchange rate says the shilling remained stable against major international and regional currencies, and the only figure that sentence then gives is the dollar. The stability line is a dollar sentence, not a three-currency result.
From 12 November to the 18 November table, the dollar added 0.03 shillings. Sterling fell another 1.16, to 171.56, and the euro fell another 1.51, to 142.87. Six further sessions extended the pattern. A usd kes forecast that starts from the adjective, and never from the other two columns, will describe a calm that belongs to one cross.
An older stillness in the same file sat at the other end of the year. Nineteen consecutive indicative sessions from 4 February to 2 March 2026 printed 129.02 exactly, four hundredths of a shilling above the 2026 low of 128.98 on 12 January. The November cluster is the same habit of an unchanged print, exercised seven hundredths under the 8 April high, and it is the one on the screen today.
Key facts
- USD/KES indicative rate 129.9900 on 18 November 2026, with the public sidebar still showing 129.98 posted on 17 November. Source: Central Bank of Kenya forex page and indicative table, retrieved 18 November 2026.
- The 2026 high on that dollar series is 130.06 on 8 April, and the 2026 low is 128.98 on 12 January, across 222 sessions. Source: CBK indicative table, retrieved 18 November 2026.
- October inflation was 7.3 percent, up from 6.8 percent in September, inside a target of 5 percent with a range of 2.5 to 7.5. Source: CBK weekly bulletin, 30 October 2026, and the 58th Monetary Policy Statement, June 2026.
- Foreign-exchange reserves were USD 14,605 million on 12 November, still shown as 5.9 months of import cover, down from USD 14,740 million on 29 October. Source: CBK weekly bulletin, 13 November 2026.
- Remittance inflows were USD 430.5 million in October 2026, 1.9 percent below the USD 438.8 million of October 2025. Source: CBK weekly bulletin, 13 November 2026.
- The Central Bank Rate is 8.75 percent, left unchanged at the meeting of 7 October 2026. Source: Monetary Policy Committee press release, 7 October 2026.
A weighted average, and a sidebar one session behind
The bank's forex page calls the published rate a weighted average of registered interbank spot trades, and its wording is that the rate is market-determined. The 129.9900 figure is that dollar average. The rates table is the same record in longer form, and where the 13 November bulletin rounds to two decimals the four-decimal row is the live fixing.
Central Bank of Kenya posted the day's card on its own account the morning of 18 November, the session the table prints 129.9900.
Daily KES Exchange Rates - 18 November 2026 pic.twitter.com/FLf0VRuKzR
— Central Bank of Kenya (@CBKKenya) November 18, 2026
From 1 October to 18 November the rate ranged from 129.71 to 129.99 across 34 sessions, and 15 of those 34 closed at or above 129.95. The weekly adjective treats that cluster and the February run at 129.02 as one event.
What else moved while the dollar line waited
The 13 November bulletin says the dollar index rose 1.60 percent in the week ending 12 November, and it puts Murban crude at USD 90.07 a barrel on 12 November, down from USD 94.04 on 5 November. A firmer dollar index and cheaper oil can cancel inside USD/KES and still show up in sterling and the euro, which is a thin explanation for the months on either side of that week.
The 30 October bulletin had Murban at USD 110.46 on 29 October, up from USD 108.23 on 22 October. The 7 October projection ties the wider deficit to higher fuel imports and to lower remittances. A marker about twenty dollars lower by mid-November helps the shilling on the fuel side and leaves the remittance half of the sentence where the committee wrote it.
For the week ending 12 November the bulletin has KESONIA at 8.75 percent, excess reserves averaging KSh 31.5 billion above the 3.25 percent cash-reserve requirement, and interbank deals averaging 23 against 16 the week before, with value traded at KSh 13.4 billion against KSh 9.2 billion. The forex sidebar shows KESONIA at 8.7503 percent on 17 November and the 91-day bill at 8.745 percent on 16 November.
The account the adjective leaves out
On 7 October the Monetary Policy Committee held the Central Bank Rate at 8.75 percent. The press release, signed by Dr Kamau Thugge as chairman, estimated the current-account deficit at 3.1 percent of GDP in the twelve months to August 2026, against 2.1 percent a year earlier, and projected 3.2 percent of GDP for 2026 against 2.1 percent in 2025. Services receipts were up 8.7 percent and diaspora remittances were down 1.3 percent, beside the export and import rows in the table.
| Item | Latest figure | Comparison in the source |
|---|---|---|
| Current account, twelve months to August 2026 | 3.1 percent of GDP | 2.1 percent a year earlier |
| Current account, 2026 projection | 3.2 percent of GDP | 2.1 percent in 2025 |
| Goods exports and goods imports | exports up 11.8 percent | imports up 15.8 percent |
| Remittances, October 2026 | USD 430.5 million | USD 438.8 million in October 2025 |
| Remittances, twelve months to October 2026 | USD 5,023 million | USD 5,082 million a year earlier |
| CBK reserves, 12 November 2026 | USD 14,605 million, 5.9 months | USD 14,740 million on 29 October, also 5.9 months |
| Projected balance-of-payments surplus, 2026 | USD 2,426 million | deficit described as more than fully financed |
The committee expects the wider deficit to be more than fully financed, leaving a balance-of-payments surplus of USD 2,426 million in 2026, and reserves at the meeting were USD 14,702 million, or 5.9 months of import cover, against a statutory endeavour of at least four months. The surplus is written down as a projection, while the reserve stock counted since the meeting is already on the page.
From 29 October to 12 November the stock fell from USD 14,740 million to USD 14,605 million, a draw of USD 135 million, and both dates still print as 5.9 months of cover. Cover stays well clear of the four-month endeavour, so the draw is a leak inside an adequate buffer, and quoting 5.9 twice reads the digit as if the stock had stood still.
The October row is USD 8.3 million, or 1.9 percent, under the year-earlier month, and the twelve-month row is 1.1 percent under its own comparison. A flow near five billion dollars still sits beside a reserve stock near 14.6 billion, and the sign on the change is the part the stability sentence leaves out, the same split drawn on the USD/PHP remittance case.
Inflation under the ceiling the exchange rate was asked to defend
The June 2026 monetary-policy statement sets the target at 5 percent, inside a range of 2.5 to 7.5. October's 7.3 percent sits 0.2 points under the top, after 6.8 percent in September and 6.6 percent in August. Core inflation rose to 4.3 percent from 4.0 percent, on processed food and transport. Non-core inflation rose to 15.1 percent from 14.0 percent, on fresh produce, with pump prices higher in the October cycle.
The 7 October release had looked for the print to stay inside the range, helped by exchange-rate stability and by softer food prices if the October-to-December rains arrived. The first inflation month after that sentence showed non-core higher, and the bank put the 7.3 percent figure on its own channel on 31 October.
Inflation highlights. Inflation in October 2026 was 7.3 percent pic.twitter.com/DpmdTaSwZb
— Central Bank of Kenya (@CBKKenya) October 31, 2026
Subtract October's headline from 8.75 and the real policy gap is 1.45 percentage points. Subtract core and the gap is 4.45 points. The comfortable reading uses the core gap. The headline gap is the one an importer of fuel and food clears, and holding 8.75 while headline inflation walked from 6.6 to 7.3 leaves a thinner cushion than the core comparison. A similar split between the real rate and the currency is the hinge of the EUR/ZAR note.
Private-sector lending grew 10.6 percent in September, from 10.3 percent in August, and non-performing loans were 13.9 percent of gross loans, down from 14.8 percent in June and 17.6 percent in August 2025. Average lending rates were 14.4 percent, against 17.2 percent in November 2024, and the 2026 growth projection was revised to 5.0 percent from 4.9 percent. The book the committee describes is healing.
Two years of a band, and where 129.99 sits in it
The indicative series retrieved on 18 November runs 716 sessions, from 5 January 2024 at 157.9012 to the current 129.99. The high is 161.3576 on 23 January 2024 and the low is 128.463 on 13 June 2024. From the peak the rate is down 31.37 shillings, about 19.4 percent, and from the trough it is up 1.53 shillings, about 1.2 percent. Since mid-2024 the live print sits at the top of a band a little over a shilling and a half wide.
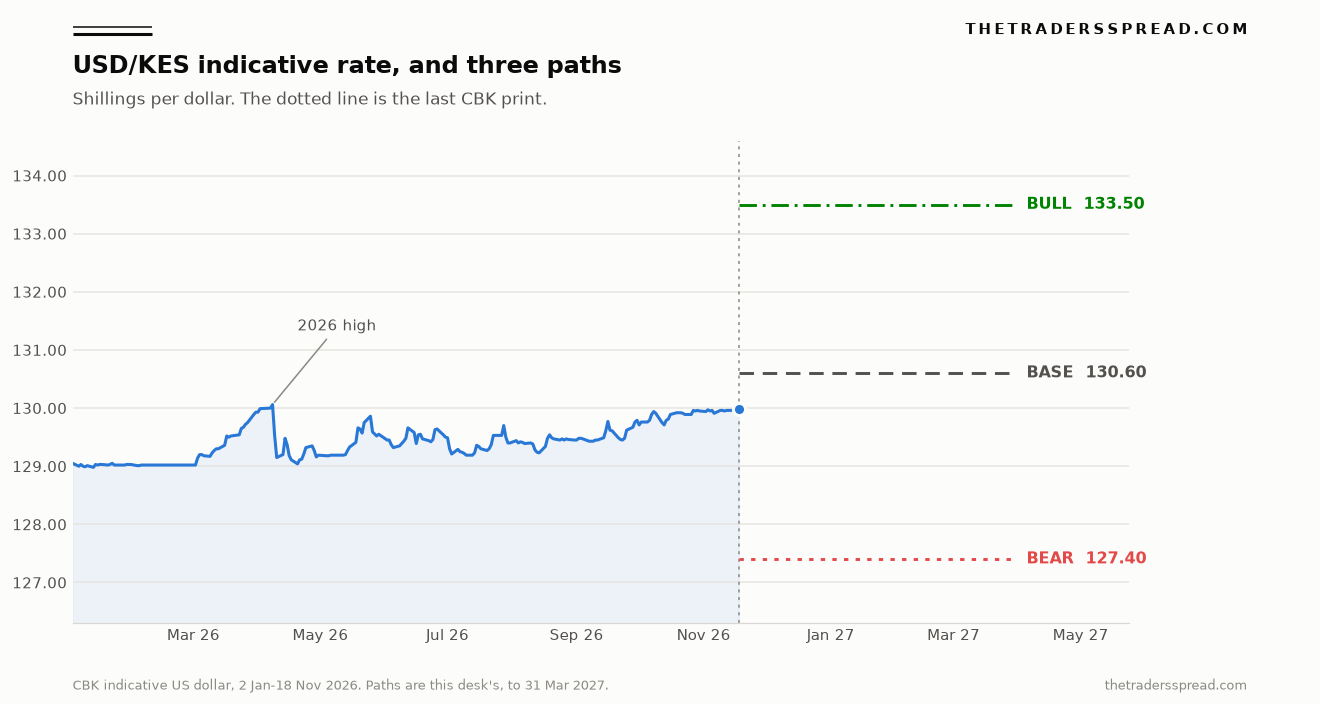
Inside 2026 the range is 128.98 to 130.06, or 1.08 shillings, and the mean absolute daily change on 221 steps is 0.049 shillings. The largest rise in a session is 0.28 and the largest fall is 0.53. A path several shillings away says this regime has ended, and a path glued to 129.99 says a print on the ceiling carries no extra information, which is the claim the weekly adjective keeps making.
On 18 November 2025 the rate was 129.5179, so the latest print is 0.47 shillings higher, about 0.36 percent. From 31 December 2025 at 129.0101 the rise is 0.98 shillings, about 0.76 percent. Over a year in which the deficit estimate widened by about a percentage point of GDP, the dollar cross rose by less than one shilling. Separating a central-bank print from the path around it is also what the USD/INR forecast had to do, on a wider band.
RelatedWhy USD/MYR Rose 0.20% and Malaysia's Ringgit Fell
Base, bull and bear
The horizon is 31 March 2027, which takes in the December 2026 meeting named in the 7 October release and the quarter after it. The three paths are scenario weights for that date. They sum to 100, and each one has to keep the tape and the accounts in view at the same time.
| Path | Level | Gap from 129.99 | Weight | What has to happen |
|---|---|---|---|---|
| Base | 130.60 | +0.61 shillings, +0.47 percent | 50 percent | The average leaks through the 8 April high of 130.06 and stops about half a shilling above it. |
| Bull | 133.50 | +3.51 shillings, +2.70 percent | 28 percent | The two-year cap gives way: oil back toward the late-October marker, remittances still slipping, reserves still edging down. |
| Bear | 127.40 | minus 2.59 shillings, minus 1.99 percent | 22 percent | The 13 June 2024 low of 128.46 breaks, and the 2024 appreciation of the shilling restarts. |
Base at 130.60 is a higher USD/KES, a slightly weaker shilling, and half a shilling is about ten times the mean absolute daily change of 2026, spread across four months. The projected surplus of USD 2,426 million is why the band can absorb a wider current account, and a print already living between 129.71 and 129.99 is why a move just through 130.06 can arrive as a drift. The bias on that base is bull. Conviction is 2 out of 5, because the tape has beaten the accounts for two years and may do so again.
Bull at 133.50 is the exit from the band, still far from the January 2024 extreme of 161.36, and 2.70 percent above the fixing against a largest one-day rise this year of 0.28 shillings. It needs Murban back toward USD 110.46, remittances still short of the year-earlier month, reserves still edging down, and a December discussion of inflation 0.2 points under the ceiling. All four together earn 28 percent, and any one of them alone leaves 133.50 too far, which is why the base holds 50.
Bear at 127.40 sits under every print in the 716 sessions. The June 2024 low was 128.463 and the 2026 low was 128.98, so 127.40 means the appreciation that stopped in mid-2024 has restarted, about a shilling past the old floor. Cheaper Murban near USD 90.07, inflation back toward the middle of the band, remittances above the year-earlier month and reserves back through USD 14,740 million would have to arrive together. The series has stayed above 128.46 for two years, which is why this case is 22 percent.
Prints under 129.00 into December, reserves back above USD 14,740 million, and inflation heading down from 7.3 would shift weight toward 127.40. A sustained break of 128.46, the June 2024 low, retires the higher path and is the invalidation of it. A print through 130.06 that the next bulletin still calls an unchanged shilling, or a reserve draw that takes the cover ratio off 5.9 toward four months, would shift weight from 130.60 toward 133.50.
Questions the fixing leaves open
Where does this USD/KES forecast put the rate by the end of March?
The base path is 130.60 shillings per dollar by 31 March 2027, from 129.9900 on 18 November 2026, a rise of 0.61 shillings. The bull case is 133.50 and the bear case is 127.40. The weights on those three are 50, 28 and 22 percent. They are built from the CBK indicative series and from the October and November official accounts, and they describe that file.
Why did sterling and the euro move while the dollar line did not?
In the bulletin week ending 12 November the dollar index rose 1.60 percent and Murban fell from USD 94.04 to USD 90.07, while the indicative dollar rate stayed at 129.96. Sterling fell 2.46 shillings and the euro 1.89 between the 5 November and 12 November rows. A shilling that tracks the dollar looks frozen in the dollar column and busy in the other two. The frozen column is the one the bulletin's stability sentence quotes.
Do 5.9 months of reserves settle the question?
The cover ratio was 5.9 months on 29 October, when the stock was USD 14,740 million, and 5.9 months on 12 November, when the stock was USD 14,605 million. The ratio sits well above the four-month endeavour the bulletin cites, so cover is adequate on the bank's own test. The digit stayed put through a USD 135 million draw. Quoting 5.9 twice, and stopping, is how a moving stock gets described as a constant.
How close is October inflation to the top of the target band?
The June 2026 monetary-policy statement sets the target at 5 percent, with a range from 2.5 percent to 7.5 percent. October inflation was 7.3 percent, so the gap to the ceiling is 0.2 points, after 6.8 percent in September and 6.6 percent in August. The 7 October release expected the print to stay inside the range, helped by a stable exchange rate and softer food prices. The October bulletin then showed non-core inflation higher, at 15.1 percent.
What would make the 130.60 base the wrong centre?
Prints under 129.00 into December, reserves back above the 29 October stock, and inflation heading down from 7.3 would pull weight toward 127.40. A break of the 13 June 2024 low at 128.46 would retire the higher path. A move through the 8 April high of 130.06, with a reserve draw that shifts the cover ratio or with oil back near the late-October marker, would pull weight toward 133.50. The December meeting is where those updates arrive together.
This desk publishes analysis for information. It is not a recommendation to buy or sell any currency, and money placed in a market can be lost.