

| USD/EGP print | Date on the page | Buy | Sell |
|---|---|---|---|
| Central Bank of Egypt official rate | 16 November 2026 | 53.6169 | 53.7537 |
| Central Bank of Egypt average market rate | 16 November 2026 | 53.6233 | 53.7233 |
USD/EGP shows an official sell of 53.7537 pounds on the Central Bank of Egypt fixing for 16 November 2026 and an average-market sell of 53.7233 pounds on a second central-bank page for that same date, so the desk that wants one dollar price is handed two. Both pages express the prices in pounds and name a buy and a sell, and the average-market sell sits 0.0304 pounds tighter than the wider official pair. I read that clash first, before any story about where the pound might travel, because a path pasted over an undefined quote is a different object from the fixing.
On this desk I treat the official screen as the reference print and the average-market screen as the same institution's second print for the same session. The gap between the two midpoints on 16 November 2026 is 0.0120 pounds. A reader who wants the mechanics of another published fixing can compare the way a central parity is set out for USD/CNY.
Updated 17 November 2026.
Six facts from the pages I opened
- The Central Bank of Egypt official exchange-rate page showed a US dollar buy of 53.6169 and a sell of 53.7537 for 16 November 2026, and the page said it was last updated that day. Source: Central Bank of Egypt, 16 November 2026.
- The separate average-market page showed a US dollar buy of 53.6233 and a sell of 53.7233, headed Average Market Rate in EGP, for the same 16 November 2026 date. Source: Central Bank of Egypt, 16 November 2026.
- The official midpoint was 53.6853 and the average-market midpoint was 53.6733, a same-day gap of 0.0120 pounds, calculated as the average of each page's buy and sell. Source: Central Bank of Egypt prints, 16 November 2026.
- Banque Misr quoted the US dollar at 53.63 buy and 53.73 sell for both notes and transfers on quote 2026111701, timestamped 17 November 2026 at 08:04:22, with all rates in Egyptian pounds. Source: Banque Misr, 17 November 2026.
- The official US dollar history I downloaded holds 654 sessions from a sell of 30.9586 on 3 March 2024 to a sell of 53.7537 on 16 November 2026, and the highest sell in that file is 56.3511 on 26 October 2026. Source: Central Bank of Egypt historical data, retrieved 17 November 2026.
- The IMF Egypt questions page describes a flexible regime in which the pound is determined freely, and it states that the authorities unified the official rate and the parallel-market rate. Source: International Monetary Fund, page retrieved 17 November 2026.
What the two central-bank screens actually publish
The official exchange-rate page says the rates and prices are expressed in pounds. When I opened it, the rates were for 16/11/2026 and the last-updated line read 16 Nov 2026. The US dollar row is the first currency in the table, with a buy of 53.6169 and a sell of 53.7537. The same table carries the euro, sterling, and a long list of other units. I am using the dollar row. The page links to a historical-data form, which is where the 654-row file came from.
The average-market page is a different URL and a shorter table. Its heading is Average Market Rate in EGP, again dated 16 Nov 2026. The dollar buy is 53.6233 and the dollar sell is 53.7233. The average-market dollar sell is 0.0304 pounds below the official sell, while the average-market dollar buy is 0.0064 pounds above the official buy. The two pages cross: one is higher on the bid, the other is higher on the offer. Anyone who quotes the central-bank rate has to name the page and the column.
I pulled the history from the official historical form for the US dollar, from 1 March 2024 through 16 November 2026, and the form returned 654 rows of date, buy, and sell. The first session is 3 March 2024, buy 30.8300 and sell 30.9586, and the latest row matches the live official page at 53.6169 and 53.7537. A feed many desks use for daily reference rates, the Frankfurter currency list I opened the same morning, does not include EGP, and the latest URL for the pair returned a missing-page response, so the chart uses the central bank's own sell column.
The arithmetic on one session
The official sell minus the official buy on 16 November 2026 is 0.1368 pounds. The average-market sell minus the average-market buy is 0.1000 pounds. The official book is wider by 0.0368 pounds. Adding 53.6169 and 53.7537 and dividing by two lands on 53.6853. The same operation on 53.6233 and 53.7233 lands on 53.6733. Official midpoint minus average-market midpoint is 0.0120. These are identities of the two published tables for one date, and they go stale as a level the moment the next session prints.
| Comparison | Pounds | How it is built |
|---|---|---|
| Official sell minus official buy | 0.1368 | 53.7537 minus 53.6169 |
| Average-market sell minus average-market buy | 0.1000 | 53.7233 minus 53.6233 |
| Official midpoint | 53.6853 | Average of the official buy and sell |
| Average-market midpoint | 53.6733 | Average of the average-market buy and sell |
| Official midpoint minus average-market midpoint | 0.0120 | Same-day gap between the two pages |
| Official sell minus average-market sell | 0.0304 | Same-day gap on the sell column |
The column headings on both pages are Buy and Sell, and a midpoint heading is absent. If a later note on this desk cites 53.6853, that figure is my average of the official pair for 16 November 2026. The chart uses the sell, because one line needs one series and the sell is what a buyer of dollars meets on the official table.
What 654 official sessions actually did
The file holds 201 sessions in 2024 from 3 March, 243 in 2025, and 210 in 2026 through 16 November. From the 3 March 2024 sell of 30.9586 to the 16 November 2026 sell of 53.7537, the official sell rose by 22.7951 pounds, which is 73.6 percent of the starting sell. March 2024 alone carries the sell from 30.9586 to 47.2840, a climb of 16.3254 pounds. On the chart that March climb looks nearly vertical, and the vertical look is the scale of daily official sells.
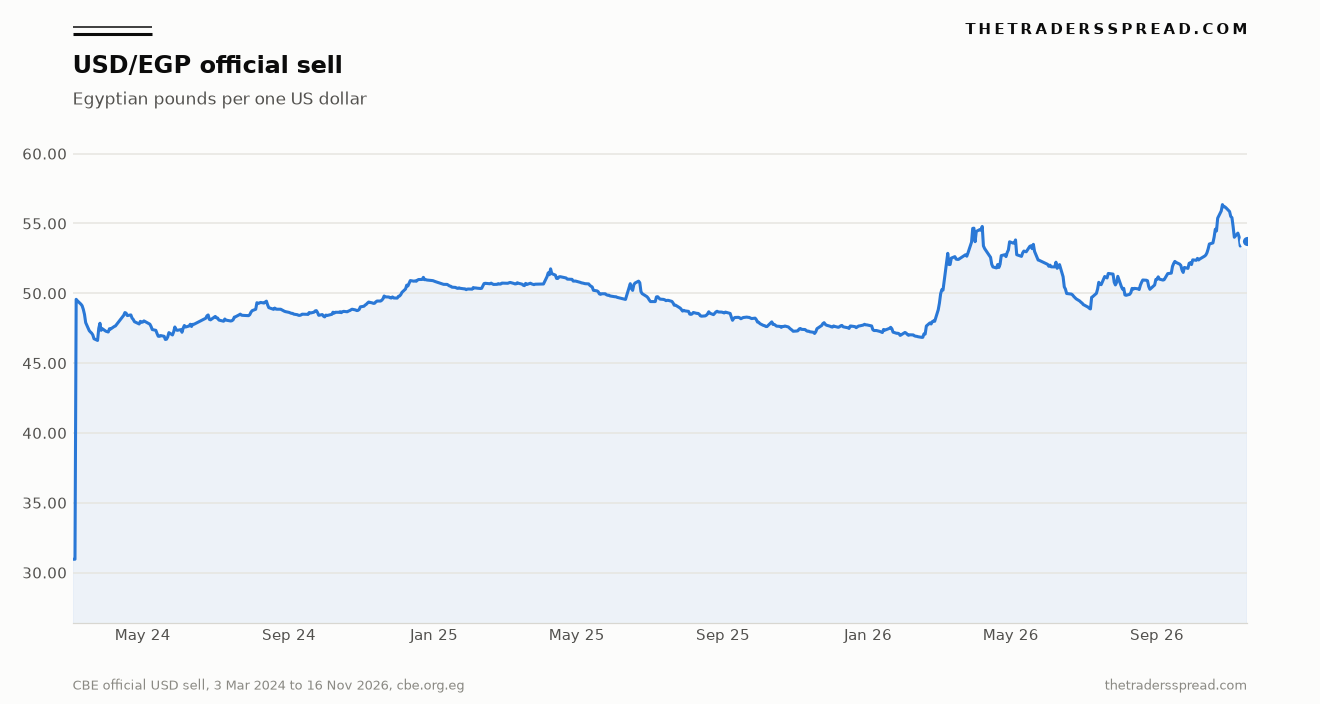
The 2025 sell high is 51.7517 on 9 April, and the 2025 sell low is 47.1254 on 17 November. The year ended at 47.7381 on 31 December 2025, which is 3.1688 pounds below the prior year-end sell. The 2026 low is 46.8467 on 15 February. The high of the whole window is 56.3511 on 26 October 2026. From that February low to the October high is 9.5044 pounds, or 20.3 percent of 46.8467, and the latest sell sits 2.5974 pounds under the high, or 4.6 percent of 56.3511. Forward levels stay off the chart, because the page records prints that already exist.
| Date | Official buy | Official sell | Place in the downloaded file |
|---|---|---|---|
| 3 March 2024 | 30.8300 | 30.9586 | First session in the window |
| 31 March 2024 | 47.1469 | 47.2840 | End of the first month |
| 23 December 2024 | 51.0069 | 51.1444 | Highest 2024 sell |
| 31 December 2024 | 50.7707 | 50.9069 | Year-end |
| 9 April 2025 | 51.6134 | 51.7517 | Highest 2025 sell |
| 17 November 2025 | 46.9903 | 47.1254 | Lowest 2025 sell |
| 31 December 2025 | 47.6043 | 47.7381 | Year-end |
| 15 February 2026 | 46.7106 | 46.8467 | Lowest 2026 sell |
| 31 March 2026 | 54.5257 | 54.6634 | March month-end |
| 30 June 2026 | 49.1612 | 49.2975 | June month-end |
| 26 October 2026 | 56.2126 | 56.3511 | Highest sell in the file |
| 16 November 2026 | 53.6169 | 53.7537 | Latest row, matches the live official page |
A commercial board on the next morning
Banque Misr's exchange-rate page, opened on 17 November 2026, timestamped the board at 17-11-2026 08:04:22 and numbered the quote 2026111701. The header says all rates are in Egyptian pounds. For the US dollar, the notes columns and the transfer columns show the same pair, buy 53.63 and sell 53.73, so the spread on that board is 0.10 pounds. The bank prints two decimals where the central bank prints four. Rounding the official sell of 53.7537 to two decimals produces 53.75, which still differs from 53.73, and the dates differ, so I keep the prints apart.
When I opened the official page it still carried 16 November 2026, while the commercial board already showed a 17 November timestamp. Subtracting 53.73 from 53.7537 and calling the result a same-day bank spread would mix Monday's official sell with Tuesday morning's customer sell. The same-day comparison I will print is official against average market, both dated 16 November 2026. Banque Misr stays in the record as its own clock and its own quote number.
What the regime pages say
The monetary-policy framework page, last updated 23 March 2023 when I opened it, says the bank aims at soundness and price stability under the Central Bank and Banking System Law 194 of 2020. Its listed responsibilities include setting the foreign-exchange system and supervising that market. Price stability, the page says, is pursued during a transition toward flexible inflation targeting, alongside liberalization of the foreign-exchange market. The goals printed there were set by the Monetary Policy Committee in December 2022: 7 percent plus or minus 2 percentage points on average by the fourth quarter of 2024, and 5 percent plus or minus 2 percentage points on average by the fourth quarter of 2026. I am quoting the page's own last-updated line, so a March 2023 sentence stays a document fact until I open a later decision.
The IMF Egypt questions page, retrieved 17 November 2026, describes a shift to a flexible regime in which the pound is determined freely and can move both ways with economic conditions. It says the authorities unified the official and parallel-market rates and made foreign exchange available at one rate, with the stated aims of smoother adjustment, easier exporting, more investment, and preserved central-bank buffers. I did not open a live parallel-market print for the pound, so a street gap stays outside the tables above. The page gives a regime objective and stops short of a pound figure I could date in the first table.
A peg inside a narrow band is a different machine, which is why the desk's note on what the USD/HKD convertibility band does is the contrast. Egypt's published object on the pages I opened is a changing buy and sell, a second central-bank average, and a commercial board with its own clock.
A cross built from dollars inherits the dollar leg the writer chose. GBP/SGD is the product of two dollar rates and the hours those markets are open, and USD/EGP can be one of those legs. Putting the official sell of 53.7537, the average-market sell of 53.7233, or the next-morning Banque Misr transfer sell of 53.73 into that leg changes the cross, and the date has to travel with the figure.
Where a usd egp forecast still has to start
A search for usd egp forecast is usually a request for a path, and the path still begins with a defined print: the official buy, the official sell, the average-market pair, and one commercial board with a quote number. From the 31 December 2025 sell of 47.7381 to the latest sell of 53.7537 the official sell rose by 6.0156 pounds. That sentence is a completed change between two dates in the file. It becomes a forecast only when someone extends it past the last row, and this page stops at the last row.
The spread is the part those paths often drop. An official spread of 0.1368 pounds on 16 November 2026 is small beside the rise since March 2024 and large beside a one-day move. On 15 November 2026 the official sell was 53.8626, so the sell fell by 0.1089 pounds into the latest row, a one-session change smaller than the spread itself. Talking about a tenth of a pound means talking inside the width of the official buy-sell pair, which is why the column has to be named and the call stays empty.
Publication lag belongs in the same starting point. The historical form and the live official page agreed on 16 November 2026 when I checked them on the morning of 17 November, while Banque Misr had already issued quote 2026111701. I use the official session as the reference date and the bank bulletin as a separate observation. The next official row can extend the line or bend it, and until the row exists the chart already drawn is the record.
Related5 Forces That Move the USD/CNY Central Parity Rate
What would change this description
I would rewrite the description of USD/EGP if the next official page I open collapses the buy and the sell into one published figure, or if the average-market sell matches the official sell to four decimals on the same date. Either change would retire the claim that the central bank hands the desk two dollar prices. I would also rewrite the regime paragraph if the IMF Egypt questions page drops the flexible-regime objective, or if it stops saying that official and parallel rates were unified. A parallel-market print that I can open, with a publisher and a timestamp, would add a comparison row. It would fill the cell this page leaves empty.
A sell above 56.3511 would replace 26 October 2026 as the high of the window, and a sell under 46.8467 would replace 15 February 2026 as the 2026 low. A print that only refreshes 53.7537 updates the latest row, and the same-day gap moves with it if the average-market page updates too. Refreshing a level is ordinary maintenance. The description changes when the shape of the quote changes: one number where there were two, matching four-decimal sells on both central-bank pages, or a street price with a publisher and a time. The task is to judge the documentation. The next move of the pound stays with the reader.
Questions the prints raise
Is the official USD/EGP fixing a single price on the central bank page?
The official page publishes a buy and a sell for the US dollar, both in pounds, for a stated date. On 16 November 2026 those prints were 53.6169 and 53.7537, and the spread between them was 0.1368 pounds. I treat the pair as a two-sided fixing. A midpoint of 53.6853 is my average of those two columns. The page labels the columns Buy and Sell, and the historical file repeats that pair on every session I downloaded.
How does the average market rate differ from the official fixing?
The average-market page is a separate Central Bank of Egypt table, headed Average Market Rate in EGP, with its own buy and sell for 16 November 2026 of 53.6233 and 53.7233. The official sell sat 0.0304 pounds above that average-market sell, while the average-market buy sat 0.0064 pounds above the official buy. The midpoints differ by 0.0120 pounds. Same institution, same date, two screens, and the screens cross each other.
What does the IMF page actually say about the pound's regime?
The IMF Egypt questions page, opened on 17 November 2026, describes a flexible exchange-rate regime in which the pound's value is determined freely and can move both ways with economic conditions. The page says the authorities unified the official rate and the parallel-market rate and made foreign exchange available at one rate. It states an objective and a unification step. The session levels sit on the central-bank tables, in the buy column and the sell column.
Why is a parallel-market gap absent from these tables?
A live parallel-market print stayed unopened when I built these tables, so a street gap stays outside them. The IMF page describes unification of the official rate and the parallel rate, and it offers that description in place of a dated street price I can reprint. The cell fills when a page with a publisher and a time is open in front of me.
What new official print would change the description of USD/EGP?
I would rewrite the description if a later official page printed one figure in place of separate buy and sell columns, or if the average-market sell matched the official sell to four decimals on the same date. I would also rewrite it if the IMF questions page dropped the flexible-regime objective. A fresh parallel print I can open and date would add a row, and that row would still leave the pound's next move with the reader.
Published quotes in this reference are general market information for readers comparing official USD/EGP screens, and they are a record of pages opened on 17 November 2026 rather than a solicitation to buy or sell any currency.